Abstract
Introduction:
The goal of a red blood cell (RBC) transfusion is to treat anemia and improve oxygen delivery to tissues (Sharma 2011). RBC metabolic changes during liquid storage increases the affinity of hemoglobin for oxygen by depletion of 2,3-diphosphoglycerate (2,3-DPG). This change reduces the partial pressure of O2 where the oxygen tension of hemoglobin is 50% saturated (p50). Transfusion of stored RBCs manifests immediate deficits in patient 2,3-DPG concentration after surgery with incomplete in vivo restoration 72 hours post-surgery (Scott 2016). This change may bring into question the efficiency of peripheral oxygen unloading of liquid stored RBCs following transfusion.
Ex-vivo rejuvenation of allogeneic RBCs increases the levels of ATP and 2,3-DPG and increases the p50 of stored RBCs by right-shifting the Oxyhemoglobin Dissociation Curve (ODC) (Dennis 1979). RBC Oxygen Release Capacity (ORC) is determined by the percent of oxygen removed from hemoglobin across the arterial (100 mmHg O2) - venous (40 mmHg O2) pressure gradient (Li 2016). The objective was to evaluate the changes in 2,3-DPG and p50 during routine blood bank storage for 35 days and the impact on ORC after RBC rejuvenation.
Methods:
Five (5) units of human whole blood were collected in CPD, processed into leukocyte reduced RBC units and stored in an additive solution (AS-1). Nearly fresh RBC were obtained from a local blood center after days 3 - 6 of storage at 1-6 °C and then stored up to 35 days at 1-6 °C. A ten (10) mL aliquot was withdrawn from each unit on the day of receipt, then on Days 7, 14, 21, 28, and 35. Each aliquot was split equally by volume into Control (untreated) and Rejuvenated Groups (n=5 per group). The Rejuvenated samples (5 mL) were incubated with 0.8 mL rejuvesol™ Solution (Zimmer Biomet) in a dry air blood warmer (Sarstedt SAHARA-III) for one hour at 37 °C. Complete blood counts (CELL-DYN 3700), ODC (TCS Scientific Corp Hemox-Analyzer), and 2,3-DPG (Roche) on perchloric acid extracts were collected. The ORC was calculated from the ODC as previously described (Li 2016).
Results:
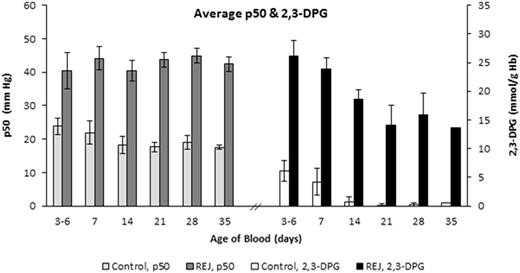
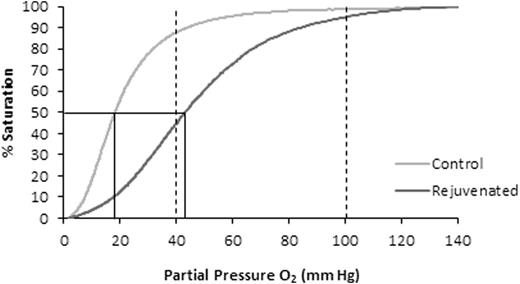
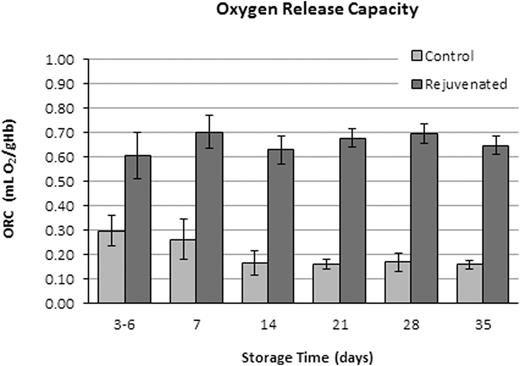
Five (5) units of CPD/AS-1 RBC units were received less than one week post-donation (5.0 ± 1.2 Days). As expected in the Control Group aliquots (n = 5), 2,3-DPG concentration and the p50 value declined significantly (p < 0.001, ANOVA) from Day 7 through Day 35 (Figure 1). Rejuvenated Group aliquots exhibited a significant increase in 2,3-DPG concentration and improved p50 (p < 0.001, t-test) at each storage interval after incubation with rejuvesol Solution compared to untreated Control aliquots (Figure 1). RBC rejuvenation shifted the ODC to the right (Figure 2) and significantly increased the ORC compared to Control aliquots (Figure 3). The ORC of Rejuvenated aliquots did not decline significantly with storage duration (p = 0.11, ANOVA) while Control aliquots were significantly impacted with storage duration (p < 0.001, ANOVA).
Conclusion:
Reduction in ORC with storage duration of unrejuvenated RBCs suggests impaired oxygen tissue delivery occurs with stored RBCs to the tissue microenvironment. Transfusion practices designed to increase hemoglobin concentration may be less effective with increased RBC age because of reduced oxygen release capacity. These in vitro results confirm previous reports regarding 2,3-DPG changes during storage and treatment with rejuvenation (Valeri 2000). Additional research is proposed to confirm these observations on full RBC units, the clinical impact of reduced oxygen release capacity, and what impact RBCs with a superphysiological ORC have on the tissue microenvironment.
RBC p50 (mm Hg) and 2,3-DPG concentration (mmol/g Hb) for paired Rejuvenated and Control groups after storage for 3-6, 7, 14, 21, 28, and 35 days. 2,3-DPG and p50 values were significantly different between groups at each time-point (p < 0.001, t-test).
RBC p50 (mm Hg) and 2,3-DPG concentration (mmol/g Hb) for paired Rejuvenated and Control groups after storage for 3-6, 7, 14, 21, 28, and 35 days. 2,3-DPG and p50 values were significantly different between groups at each time-point (p < 0.001, t-test).
A representative ODC for a RBC aliquot stored for 21 days (Gray) and the "right-shift" of the curve with rejuvenation (Black) used to determine the ORC. The two vertical dashed lines represent the venous PO2 (40 mmHg) and arterial PO2 (100 mmHg). The solid line represents a typical p50 value of Control and Rejuvenated aliquots.
A representative ODC for a RBC aliquot stored for 21 days (Gray) and the "right-shift" of the curve with rejuvenation (Black) used to determine the ORC. The two vertical dashed lines represent the venous PO2 (40 mmHg) and arterial PO2 (100 mmHg). The solid line represents a typical p50 value of Control and Rejuvenated aliquots.
RBC ORC for paired Rejuvenated and Control groups after storage for 3-6, 7, 14, 21, 28, and 35 days. ORC was significantly different between groups at each time-point (p < 0.05, t-test).
RBC ORC for paired Rejuvenated and Control groups after storage for 3-6, 7, 14, 21, 28, and 35 days. ORC was significantly different between groups at each time-point (p < 0.05, t-test).
Inglut:Zimmer Biomet: Employment. Kausch:Zimmer Biomet: Employment. Gray:Zimmer Biomet: Employment. Landrigan:Zimmer Biomet: Employment.
Author notes
Asterisk with author names denotes non-ASH members.


