Abstract
Cerebral oxygen extraction fraction (OEF) is a powerful biomarker that could be used to stratify cerebrovascular morbidity in patients with sickle cell disease (SCD). Recently, several MRI intravascular oximetry techniques have demonstrated early feasibility in non-invasively quantitating OEF. Critical to this technique is the use of empirically derived calibrations that convert the measured magnetic relaxation property, T2, into oxygen saturation. Previous work demonstrated a strong hematocrit and saturation dependence on T2 and our prior work extended early results to hematocrit ranges common in patients with chronic anemia1. Despite improvements in calibration models, it remains an unanswered question whether the unique hemorheologic properties of hemoglobin S (HbS) containing red cells will give rise to fundamentally distinct magnetic properties compared to healthy, hemoglobin A (HbA) cells.
Methods: All studies were performed on at CHLA under an IRB protocol with consent/assent. The blood of 11 subjects with sickle cell disease were studied (6 Male, 5 Female, aged 25.4 ± 14.5 years). Six had HbSS, three had HbSC, and two had HbSB0). Three of the subjects were on chronic transfusion therapy (2HbSS, 1 HbSB0). Two tablespoons of blood was drawn for the antecubital vein and stored at 4°C until analysis. For analysis, blood was placed in a custom built imaging apparatus and heated to 37° C. Oxygen level was measured with a hemoximeter and T2 was measured within a 3T Philips scanner. Following the T2 measurement blood was removed from the imaging apparatus and desaturated in a temperature controlled chamber using a membrane oxygenator and 5% CO2 and 95% N2 gas mixture. MRI T2 measurements and deoxygenation were repeated until a blood saturation level of ~30% was reached. T2 was measured with a phase cycled, CPMG sequence with 0, 4, 8 16 inversions pulse and a tau of 10ms. Monoexponetial fitting was used to derive T2.
Results: Our previous work using a similar system and HbA blood demonstrated a highly reproducible relationship linking T2 to hematocrit and oxygen saturation (Y) as follows:
R2= 1/T2 = A1*HCT*(1-Y)2 + A2*(1-Y)2 + A3*HCT + A4
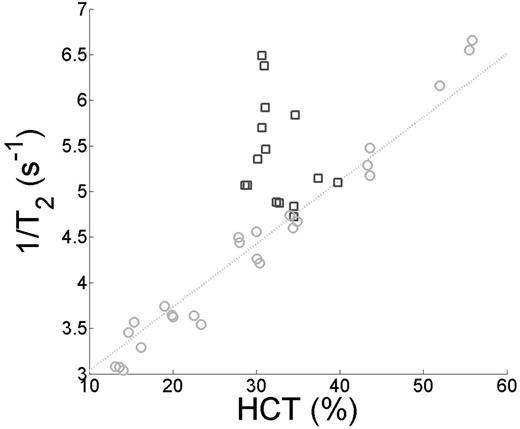
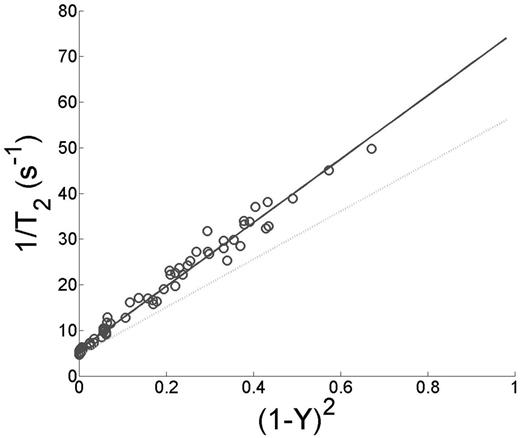
where the coefficients A1, A2, A3, and A4 were fit to data from a broad range of hematocrit and oxygen saturation values. In blood from sickle cell patients, we found that the A1 and A3 terms were zero. Thus the calibration curve was essentially independent of hematocrit. Figure 1 shows the tight relationship between hematocrit and 1/T2 for HbA could not be reproduced in HbS blood. In Figure 2, 1/T2 maintained a tight relationship (R2=.981) with (1-Y)2. The slope of 1/T2 and (1-Y)2was higher in HbS blood compared to HbA. There was also a positive relationship between HbS% and the residual of (1-Y)2 and R2 however this is was a weak effect (R2=0.057).
Discussion: We found that the T2 of HbS containing red cells is distinct from the healthy HbA containing cells. This work has clinical implications for intravascular MRI oximetry performed in patients with sickle cell disease2 in that neglecting the magnetic differences between HbA and HbS may result in a 9.5%± 2.8% average bias in absolute saturation at a HCT of 32% . Interestingly, we were unable find a difference across sickle phenotypes and only small differences in transfused vs nontransfused patients. We suspect that irreversibly sickled cells, even few in number, will greatly influence the local magnetic field and shorten the T2 of sickle blood. It remains to be shown whether the in vitro conditions of this experiment are applicable to in vivo condition more broadly. In-vivo cross-validation studies are ongoing.
1). Bush et al. MRM 2016
2). Jordan LC et al. Brain 2016
Jordan LC, Gindville MC, Scott AO, et al. Non-invasive imaging of oxygen extraction fraction in adults with sickle cell anaemia. Brain
2016;139(Pt 3):738-5
Light gray circle designate HbA samples and dark gray squares correspond to HbS. There was a tight linear relationship between HCT and 1/T2 in HbA cells that was not present in HbS cell.
Light gray circle designate HbA samples and dark gray squares correspond to HbS. There was a tight linear relationship between HCT and 1/T2 in HbA cells that was not present in HbS cell.
Light gray line designates previously published HbA model fit and dark gray squares correspond to HbS. 1/T2 was linearly dependent on (1-Y)2in HbS blood however the slope of this relationship was higher when compared to known relationship with HbA.
Light gray line designates previously published HbA model fit and dark gray squares correspond to HbS. 1/T2 was linearly dependent on (1-Y)2in HbS blood however the slope of this relationship was higher when compared to known relationship with HbA.
Wood:World Care Clinical: Consultancy; Celgene: Consultancy; World Care Clinical: Consultancy; Vifor: Consultancy; Vifor: Consultancy; Ionis Pharmaceuticals: Consultancy; Ionis Pharmaceuticals: Consultancy; Celgene: Consultancy; AMAG: Consultancy; AMAG: Consultancy; Apopharma: Consultancy; Apopharma: Consultancy; Biomed Informatics: Consultancy; Biomed Informatics: Consultancy.
Author notes
Asterisk with author names denotes non-ASH members.


