Abstract
Introduction:
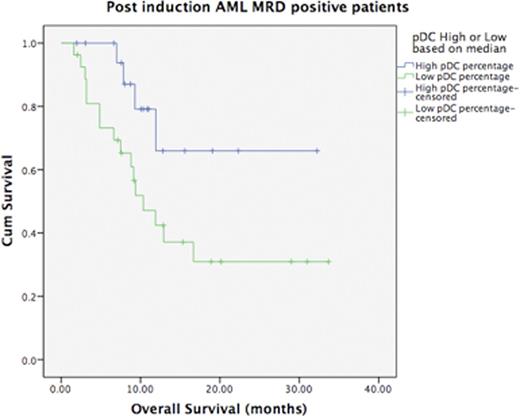
Plasmacytoid dendritic cells (pDCs) are a subset of immune cells that secrete type 1 interferons and serve as antigen presenting cells. In many tumors increased pDC frequencies have been observed and are involved in tumor response initiation. However, there is not much data in acute myeloid leukemia especially in the context of minimal residual disease and outcome. Here we evaluated the frequencies of pDCs in the post induction bone marrow and found a significant correlation with post induction MRD levels. Furthermore, we found that high levels of pDCs in MRD positive patients confer a better overall survival (OS).
Methods:
All adult (>18 years ) of patients who were treated for AML [other than AML with t(15;17)] were accrued over a 2 year period. All patients received "3+7" induction therapy with daunorubicin and cytarabine. If patients were in morphological CR at end of induction, they either received 3 courses of 12-18 gm/m2 high dose cytarabine (HiDAC) or aBMT if feasible. The presence of MRD was assessed using 8 colour flow cytometry on a post induction bone marrows using CD45, CD36, CD38, CD123, CD33, CD117, CD34, HLADR, CD7, CD56, CD13, CD19, CD16, CD11b, CD15 and CD14. Minimum of 500,000 events were acquired/tube on an 8 colour BD FACS Canto II or a 10 colour BC Navios instruments. Kaluza software (v1.3) was used to analyze the .fcs files. MRD was calculated as a percentage of abnormal leukemic cells per total viable cells as gated in forward scatter v side scatter plot. pDCs were calculated as CD123 bright population which expressed HLA-DR (while gating on the progenitors and monocytes based on their expression of CD45 and side scatter). The pDC percentages were counted as a fraction of all viable cells. pDCs were divided into pDC High and pDC Low groups, based on a median pDC value of 0.1%. OS was calculated from start of induction therapy to time of last follow up or death. Chi Squared test was used to analyse categorical values of pDC (hi v/s low) and MRD (positive v/s negative). Log rank test was used to compare pDC groups in MRD positive subset.
Results:
At a median follow up of 16 months, OS was 47.8%. After exclusion of induction deaths, a total of 94 patients of adult AML was assessed for the presence of MRD at the end of induction. Of these MRD was detected in 48 (51.1%, range 0.01-40%). pDC values ranged from <0.01% to 1.95% (median 0.15%). Median pDC value in the MRD positive group was lower (0.05%) as compared to the MRD negative group (0.23%). Out of 94 patients of 44.7% patients belonged to the pDC Low group of which majority patients were MRD positive (66.7% of the pDC Low group). Similarly, majority of patients in the pDC High group were MRD negative (61.5% of the pDC High group). A statistical analysis of these categories was found to be significant (p=0.008). When pDCs (high/low) groups were analyzed in each of MRD subsets we found a significant association in MRD positive group (p=0.03), indicating that MRD positive patients who have low pDC levels have a worse OS (median OS: 10.3 months).
Conclusion:
These pilot data seem to indicate that the pDC burden in the bone marrow may have a role in influencing MRD clearance in the bone marrow. A detailed investigation of the pDC function in the bone marrow microenvironment is warranted. Functional studies on pDCs are warranted to understand the dynamics of disease relapse.
Patkar:Wellcome Trust-DBT India Alliance: Research Funding.
Author notes
Asterisk with author names denotes non-ASH members.


