Abstract
In chronic lymphocytic leukemia (CLL), it is recognized that germinal center experience by the cell-of-origin has an influence on the malignant phenotype and impacts clinical behavior. Measurement of the mutational status of the IGHV locus is a commonly used approach that subgroups patients according to this natural history. Other biomarkers correlating with these subgroups, such as ZAP70 expression and ZAP70 DNA methylation, are also used. Recently, we and others have found vast differences in global DNA methylation profiles among CLL cases that classifies distinct subgroups related to their natural history. Here we systematically evaluate various markers of natural history of the cell-of-origin for their ability to discriminate clinical outcomes.
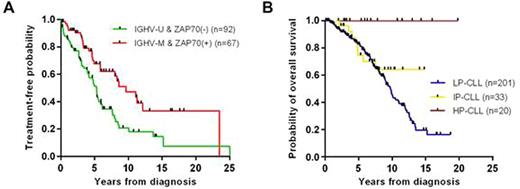
IGHV mutational status and ZAP70 expression are currently the most widely used prognostic markers of germinal center experience. These markers are generally concordant, with IGHV-unmutated associating with ZAP70 positivity. To compare their relative prognostic impact, we selected CLL cases from a large sample cohort collected as a prospective study maintained by the CLL Research Consortium that were discordant (IGHV-mutated and ZAP70(+) or IGHV-unmutated and ZAP70(-); n=192). We found a significant difference in time-to-first-treatment (TTFT; P=0.002) and overall survival (OS; P=0.032) between discordant groups, with curves separating according to IGHV as opposed to ZAP70 (Fig.1A).
DNA methylation-based classification of CLL according to their natural history has not been compared to IGHV status. This classification strategy subgroups the majority of cases into low-programmed CLL (LP-CLL) or high-programmed (HP-CLL) subgroups that generally correlate with IGHV-unmutated/ZAP70(+) and IGHV-mutated/ZAP70(-), respectively, along with a minority of cases in an intermediate (IP-CLL) subgroup. We used our previously-described DNA methylation assay, based on MassARRAY interrogating 7 genomic loci including ZAP70, to group the 192 samples with discordant IGHV/ZAP70 results with 327 samples analyzed previously from the same cohort. DNA methylation (LP-CLL vs. HP-CLL) outperformed IGHV classification (unmutated vs. mutated) in terms of separating TTFT curves (n=432; LP-CLL vs. HP-CLL median difference=4.8 years, unmutated vs. mutated IGHV median difference=2.9 years) and OS curves (n=491; LP-CLL vs. HP-CLL median difference=12.9 years, unmutated vs. mutated IGHV median difference=6.8 years). To evaluate whether DNA methylation subgroups provide additional prognostic information to IGHV, we compared TTFT and OS within IGHV subtypes. We found that the ability of DNA methylation subgrouping to separate OS curves was maintained in the IGHV-unmutated subtype (P<0.001; Fig.1B) and TTFT in both IGHV-unmutated and mutated subtypes (P<0.001 and P=0.016, respectively). Conversely, IGHV subtypes did not significantly separate outcomes within DNA methylation subgroups (P>0.5 for all).
Further investigation of the features of DNA methylation subgroups as defined revealed a strong bias in the frequency of several recurrent adverse prognostic somatic mutations. In particular 17p deletions and EGR2, SF3B1 and XPO1 mutations occurred frequently within the LP-CLL subgroup. We next explored whether the presence of each mutation correlated with clinical outcome within its corresponding DNA methylation subgroup, and found heterogenous results. EGR2 mutations separated TTFT in the LP-CLL subgroup (P=0.0009), but 17p, XPO1 and SF3B1 did not (P>0.3). This suggests that the cell-of-origin should be taken into account to accurately assess the clinical impact of somatic mutations.
In summary, we demonstrate that among discordant cases for IGHV/ZAP70, IGHV appears to be a stronger prognostic factor for both TTFT and OS. When then evaluating the relative importance of DNA methylation subgrouping and IGHV status on TTFT and OS, we find that DNA methylation subgrouping is the more powerful prognostic factor. Among the markers of the cell-of-origin, DNA methylation is a strong tool for risk-stratifying patients and should be considered in development of risk prediction models.
A) Kaplan-Meier analysis of TTFT of IGHV-mutated and ZAP70(+) versus IGHV-unmutated and ZAP70(-) (P=0.002, median difference=4.4 years). B) Kaplan-Meier analysis of OS in patients with unmutated IGHV separated by DNA methylation subgroup (P<0.001).
A) Kaplan-Meier analysis of TTFT of IGHV-mutated and ZAP70(+) versus IGHV-unmutated and ZAP70(-) (P=0.002, median difference=4.4 years). B) Kaplan-Meier analysis of OS in patients with unmutated IGHV separated by DNA methylation subgroup (P<0.001).
Wierda:Acerta: Research Funding; Novartis: Research Funding; Gilead: Research Funding; Genentech: Research Funding; Abbvie: Research Funding. Brown:Infinity: Consultancy; Janssen: Consultancy; Gilead Sciences: Consultancy; Roche/Genentech: Consultancy; Celgene: Consultancy; Sun BioPharma: Consultancy; Pfizer: Consultancy; Abbvie: Consultancy. Kipps:Roche: Consultancy, Honoraria; Celgene: Consultancy, Honoraria, Research Funding; Gilead: Consultancy, Honoraria, Speakers Bureau; Pharmacyclics, LLC, an AbbVie Company: Consultancy, Honoraria; AbbVie: Consultancy, Honoraria, Research Funding.
Author notes
Asterisk with author names denotes non-ASH members.


