Key Points
Functional studies in human primary erythroid progenitor cells support a role for FOXO3 in γ-globin regulation.
Metformin treatment of human primary erythroid progenitor cells increases fetal hemoglobin in a partially FOXO3-dependent manner.
Abstract
Induction of red blood cell (RBC) fetal hemoglobin (HbF; α2γ2) ameliorates the pathophysiology of sickle cell disease (SCD) by reducing the concentration of sickle hemoglobin (HbS; α2βS2) to inhibit its polymerization. Hydroxyurea (HU), the only US Food and Drug Administration (FDA)-approved drug for SCD, acts in part by inducing HbF; however, it is not fully effective, reflecting the need for new therapies. Whole-exome sequence analysis of rare genetic variants in SCD patients identified FOXO3 as a candidate regulator of RBC HbF. We validated these genomic findings through loss- and gain-of-function studies in normal human CD34+ hematopoietic stem and progenitor cells induced to undergo erythroid differentiation. FOXO3 gene silencing reduced γ-globin RNA levels and HbF levels in erythroblasts, whereas overexpression of FOXO3 produced the opposite effect. Moreover, treatment of primary CD34+ cell–derived erythroid cultures with metformin, an FDA-approved drug known to enhance FOXO3 activity in nonerythroid cells, caused dose-related FOXO3-dependent increases in the percentage of HbF protein and the fraction of HbF-immunostaining cells (F cells). Combined HU and metformin treatment induced HbF additively and reversed the arrest in erythroid maturation caused by HU treatment alone. HbF induction by metformin in erythroid precursors was dependent on FOXO3 expression and did not alter expression of BCL11A, MYB, or KLF1. Collectively, our data implicate FOXO3 as a positive regulator of γ-globin expression and identify metformin as a potential therapeutic agent for SCD.
Introduction
Sickle cell disease (SCD) is one of the most common monogenic diseases, with >330 000 affected individuals born annually worldwide.1 It is caused by substitution of glutamic acid by valine, which leads to production of abnormal hemoglobin S (HbS). Increased fetal hemoglobin (HbF), whether endogenous or drug induced, ameliorates the symptoms and complications of SCD by preventing red blood cell sickling through diluting HbS and inhibiting its polymerization.2-4 Although hydroxyurea (HU) is the only US Food and Drug Administration–approved HbF-inducing agent for use in adults with SCD,5,6 up to 50% of patients do not experience clinical improvement on HU, and response to HU is influenced by genetic factors still under investigation.5,7,8 New HbF-inducing drugs, used as monotherapies or combined with HU, are urgently needed.
Genetic studies, including genome-wide association studies (GWASs), have significantly advanced our understanding of γ-globin regulation, with variants in XmnI, BCL11A, and the HBS1L-MYB intergenic region being associated with higher HbF levels in different populations.9-12 However, only ∼40% of the variation in endogenous HbF is accounted for by these variants.12 GWASs tend to favor identification of common variants with a large impact on HbF levels.13 We hypothesized that analysis of whole-exome sequencing (WES), which allows for the examination of rare variants, could identify additional genes and associated pathways that regulate HbF levels in patients with SCD.
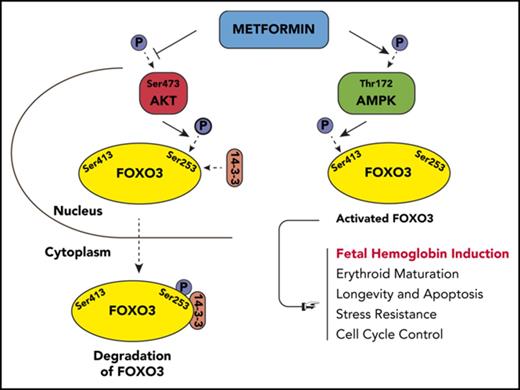
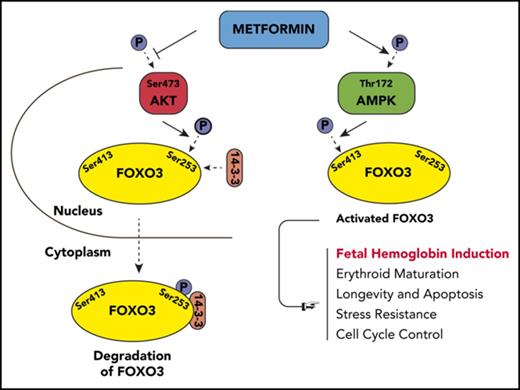
Using WES, we identified a novel gene, FOXO3, as a positive regulator of γ-globin expression; we confirmed its role in functional studies. FOXO3 is a transcription factor with multiple biologic functions, including antioxidant response, longevity, and cell cycle control14-19 ; knockdown of FOXO3 arrests erythroid maturation, and activation of FOXO3 promotes erythroid maturation.20-24 In numerous nonerythroid cell types, FOXO3 is also tightly regulated by the metabolic state of the cell. Under conditions of high glucose or other growth factors, AKT phosphorylates FOXO3 at 3 conserved residues: Thr32, Ser253, and Ser315. This leads to FOXO3 binding to 14-3-3, exposure of the nuclear-localization signal, and transport to the cytosol, causing reduced expression of FOXO3 target genes.25,26 When adenosine triphosphate is low, FOXO3 is phosphorylated by AMPK and exhibits increased activity.27-29
Metformin, a biguanide class agent commonly used as an oral antidiabetic drug, has been shown to activate FOXO3 in nonerythroid cell lines and hepatocytes.28,30-34 Here, we investigate the role of FOXO3 in γ-globin gene regulation through lentiviral expression, RNA interference, and induction by metformin.
Methods
WES and analysis
A total of 171 genomes from pediatric SCD patients (males and females >3 years old and not on HU) underwent WES; genotypes included HbSS and HbSβ0. A total of 69 genes was found to be associated with HbF expression at P < .01 (uncorrected) and a corresponding false discovery rate <0.8 (supplemental Table 1, available on the Blood Web site) using linear regression. Additional details are provided in supplemental Methods.
Purification of human CD34+ cells
Using Ficoll-Hypaque density centrifugation, mononuclear cells were isolated from buffy coats of male and female healthy human blood donors, obtained from the Gulf Coast Blood Bank, or discarded red cell exchange male and female SCD patient samples obtained under a Baylor College of Medicine Internal Review Board Research protocol. CD34+ cells were extracted from the mononuclear fraction by immunomagnetic separation (CD34 MicroBead Kit UltraPure, human; Miltenyi Biotec), according to the manufacturer’s instructions. CD34+ cells were expanded in StemSpan Serum-Free Expansion Media with StemSpan CC100 cytokine mixture (STEMCELL Technologies, Vancouver, BC, Canada) and 1% penicillin-streptomycin. To initiate differentiation, at day 7 the cells were cultured in Iscove’s Modified Dulbecco’s Medium supplemented with 20 ng/mL recombinant human stem cell factor, 3 U/mL human erythropoietin, 10 ng/mL recombinant human interleukin-3, 10% fetal bovine serum, 10−5 M 2-ME, 10−6 M dexamethasone, and 0.3 mg/mL human holotransferrin.35,36
Lentivirus transduction, FOXO3 knockdown, and FOXO3 overexpression
Lentiviral short hairpin RNA (shRNA) particles were made, as previously described,37 using 3 encoded shRNA constructs against FOXO3 derived from GIPZ FOXO3 shRNA Bacterial Glycerol Stock (clone IDs: V3LHS_641762, V3LHS_375381, and V3LHS_375386; Dharmacon), by cotransfecting human embryonic kidney 293FT cells with a vector containing green fluorescent protein. GIPZ nonsilencing lentiviral shRNA (catalog number RHS4346; Dharmacon) was used as a control. Primary erythroid cells were transduced at day 5 of the expansion phase in a 2-phase culture. The effect of the lentiviral shRNA knockdown, compared with control cells and scramble shRNA, was detected by western blot and reverse-transcriptase quantitative polymerase chain reaction (RT-qPCR).
FOXO3 was overexpressed in hematopoietic stem and progenitor cells (HSPCs) from patients with SCD by plasmid transfection. The FOXO3 gene was amplified using polymerase chain reaction (PCR) from template plasmid pcDNA3 FLAG-human FOXO3 (Addgene). The PCR product was cloned into the pENTR11 vector (Invitrogen) and then transferred to the Gateway lentiviral expression plasmid pLenti CMV Puro DEST (w118-1) (catalog number 17452; Addgene) by recombination with Gateway LR Clonase II enzyme mix (Invitrogen), according to the manufacturer’s guidelines. The expression plasmid was packaged into lentivirus by transient cotransfection of human embryonic kidney 293FT cells with packaging and envelope plasmids. The HSPCs were infected in phase 1 expansion medium on day 5 of culture. At 48 hours after transfection, 0.5 μg/mL puromycin was used to enrich positive cells. Cells were harvested on day 12 and analyzed by western blot.
FOXO3 was also knocked down and overexpressed in human erythroleukemia K562 cells, and the effect on γ-globin was determined by western blot. Additional details are provided in supplemental Methods.
Pharmacologic induction of FOXO3 and HbF evaluation
Single-donor–derived terminally differentiated erythroid cells, from untreated, HU treated (30 µM), metformin treated (100 µM), or HU and metformin treated were harvested at day 14. Samples were then evaluated by fluorescence-activated cell sorting (FACS), high-performance liquid chromatography (HPLC), western blot, and RT-qPCR. Drugs were added on day 7 of 2-phase erythroid culture.
Flow cytometric analysis
For intracellular staining of HbF, after washing with phosphate-buffered saline (PBS), erythroid cells were fixed with FIX & PERM Fixation Reagent (Medium A) (catalog number GAS001) for 15 minutes, washed, and permeabilized with FIX & PERM Permeabilization Medium (Medium B) (catalog number GAS002; both from Invitrogen), according to the manufacturer’s protocol. Cells were stained with antibody (R-Phycoerythrin–conjugated anti-human HbF; catalog number MHFH04; Invitrogen) for 20 minutes at room temperature in the dark and then analyzed by FACS. For cell surface marker analysis, cells were suspended in PBS with 2% fetal bovine serum and stained with antibody against band 3 (Miltenyi Biotec) or CD71 (catalog number 561940) and CD235a (glycophorin A [GPA]; catalog number 563666; both from BD Biosciences) for 30 minutes on ice, protected from light.
HPLC
Erythroid cells were pelleted, lysed with HPLC-grade water for 10 minutes on ice, and subjected to 1 freeze-thaw cycle. After centrifugation at 20 000g for 20 minutes at 4°C, hemolysates were collected, and hemoglobins were measured using a PolyCAT HPLC column (100 × 4.6 mm) (item number 104CT0315; PolyLC) at 415 nm. Hemoglobin content was calculated by integrating the area under the curve of the chromatograms and was expressed as ratio comparisons.35,38
RNA isolation and quantitative real-time PCR assays
Total RNA was extracted from cells using an RNeasy Kit (QIAGEN), according to the manufacturer’s instructions, and stored at −80°C. First-strand complementary DNA was generated from 1 μg of RNA using a High-Capacity RNA-to-cDNA Kit (Life Technologies). Real-time PCR reactions were performed with specific TaqMan Gene Expression Assays (FOXO3 Hs00818121_m1, HBG1/2 Hs00361131_g1, HBB Hs00758889_s1, ACTB Hs99999903_m1; Applied Biosystems) or gene-specific primers (500 nM) and Power SYBR Green PCR Master Mix (Life Technologies). The expression level of all target genes was analyzed in triplicate, and target messenger RNA (mRNA) levels were normalized to β-actin transcripts. Relative mRNA levels were calculated using the 2−ΔΔCT method.39 Primer sequences can be found in supplemental Table 2.
Western blot
Cells were lysed in ice-cold radioimmunoprecipitation assay lysis buffer containing multiple protease inhibitors (cocktail of protease inhibitor, phosphatase inhibitors, and phenylmethylsulfonyl fluoride). Insoluble materials were removed by centrifugation. Protein concentration was determined using a BCA Protein Assay Kit. Total proteins were separated by sodium dodecyl sulfate polyacrylamide gel electrophoresis and then electrotransferred onto an Immun-Blot PVDF Membrane (Bio-Rad). The membrane was blocked with 5% nonfat milk or 5% bovine serum albumin and incubated with specific primary antibodies overnight at 4°C. The following primary antibodies were used: monoclonal antibody against γ-globin antibody (51-7) (sc-21756; Santa Cruz Biotechnology); anti-FOXO3 (#2479s), anti–β-actin (#4967s), anti-AMPKα (#2532s), anti-AKT (#4691s), phospho-AMPK (T172), phospho-AKT (Ser473), phospho-FOXO3 (Ser253), and phospho-FOXO3 (Ser413; all from Cell Signaling Technology); anti–β-globin (AP11557b; Abgent), and anti-BCL11A (ab19487; Abcam). The blot was washed 3 times with PBS-Tween and then incubated with HRP-conjugated secondary antibody. After washing 3 times with PBS-Tween, detection was carried out using a Novex ECL Chemiluminescent Substrate Reagent Kit (catalog number WP20005; Life Technologies).
CRISPR/Cas9 knockout of FOXO3
FOXO3 was knocked out via clustered regularly interspaced short palindromic repeat (CRISPR)/Cas9 in HSPCs. Guide RNA (gRNA) sequences (gRNA-1: TCCACTTCGAGCGGAGAGAG; gRNA-2: AGAGAGGCGCATCATCGTCC) were designed and cloned into a lentiCRISPRv2 vector (catalog number 52961; Addgene) digested with BsmBI (Fermentas), as described (http://genome-engineering.org/gecko/wp-content/uploads/2013/12/lentiCRISPRv2-and-lentiGuide-oligo-cloning-protocol.pdf). Human embryonic kidney 293FT cells were cotransfected with lentiCRISPRv2-gRNA constructs, psPAX2, and pMD2.G (Addgene). HSPCs were transduced with lentiviruses and 8 µg/mL Polybrene by spin-infection at 2000 rpm for 1 hour at room temperature in phase 1 expansion medium on day 5 of culture, and cells were collected and analyzed by HPLC on day 14 of culture.
FOXO3 localization
HSPCs were treated on day 13 of culture with metformin for 24 hours. Nuclear and cytoplasmic extracts were prepared using a Thermo Scientific NE-PER Nuclear and Cytoplasmic Extraction Kit (catalog number PI78833). The following primary antibodies were used: anti-Lamin A/C (sc-7292) and anti–α Tubulin (10D8) (sc-53646; both from Santa Cruz Biotechnology) and anti-FOXO3 (#2479s). Detection was carried out using a Novex ECL Chemiluminescent Substrate Reagent Kit (catalog number WP20005; Life Technologies).
In vitro sickling assay
Drug was added to SCD patient–derived CD34+ HSPCs from 3 unique patients on day 7; on day 28, cells were incubated in a 2% oxygen environment for 4 hours. After fixation, cells were stained with Wright/Giemsa. The cells were evaluated and counted in ≥10 high-magnification fields (50× objective) for each sample, with the examiner blinded to the treatment group, using an Olympus ZX71 microscope.40-42
Results
Genomic analysis of rare variants suggests a role for FOXO3 in γ-globin regulation
To identify associations that would not be found by prior efforts that focused on common variants,10,43,44 only rare variants with minor allele frequency <2% were used in our analysis of 171 SCD patients. We identified 68 candidate genes as potentially associated with HbF expression levels (supplemental Table 1) at a false discovery rate <0.8. This list included FOXO3, which is known to play a role in erythroid maturation20-24 and was selected for further functional studies with shRNA knockdown in primary erythroid cells.
Knockdown of FOXO3 reduces γ-globin expression and protein production in HSPCs and K562 cells
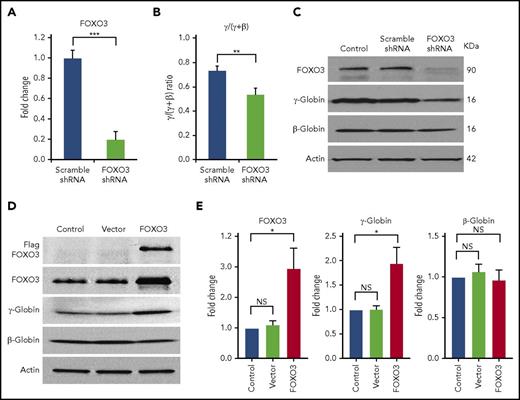
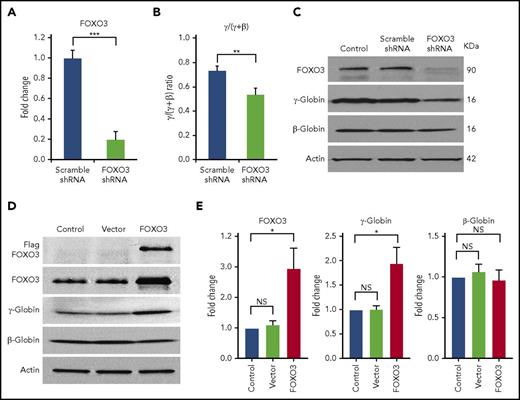
We transduced CD34+ cells isolated from normal human peripheral blood with an shRNA vector that produced an 80% reduction in FOXO3 mRNA expression (Figure 1A). We found that FOXO3 knockdown significantly reduced the γ/(γ+β) globin ratio (P = .004), as measured by RT-qPCR (Figure 1B). FOXO3 knockdown reduced γ-globin, but not β-globin, as detected by western blot analysis (Figure 1C). Overexpression of FOXO3 in HSPCs increased γ-globin protein production without increasing β-globin (Figure 1D-E). Overexpression of FOXO3 in K562 cells also increased γ-globin production, as measured by western blot. Triple-mutant FOXO3, in which 3 serine residues have been altered to prevent phosphorylation of FOXO3 by AKT and degradation in the cytoplasm, resulted in greater amounts of γ-globin production (supplemental Figure 1A). FOXO3 was also knocked down in K562 cells using 3 shRNAs with differing degrees of FOXO3 repression; γ-globin was reduced in proportion to the degree of FOXO3 knockdown (supplemental Figure 1B).
Knockdown of FOXO3 reduces γ-globin expression and protein levels relative to β-globin, and overexpression of FOXO3 increases γ-globin expression and protein levels relative to β-globin. (A) An 80% knockdown of FOXO3 is achieved. (B) Effects of FOXO3 knockdown on γ-globin and β-globin, as measured by RT-qPCR (3 independent assays). (C) Western blot depicting FOXO3 knockdown and its effect on γ-globin and β-globin protein levels. (D) Western blot depicting effects of FOXO3 overexpression on γ-globin and β-globin. (E) Quantification of western blot (3 independent assays). Error bar represents SD. ***P < .0001, **P < .005, *P < .05. NS, not significant.
Knockdown of FOXO3 reduces γ-globin expression and protein levels relative to β-globin, and overexpression of FOXO3 increases γ-globin expression and protein levels relative to β-globin. (A) An 80% knockdown of FOXO3 is achieved. (B) Effects of FOXO3 knockdown on γ-globin and β-globin, as measured by RT-qPCR (3 independent assays). (C) Western blot depicting FOXO3 knockdown and its effect on γ-globin and β-globin protein levels. (D) Western blot depicting effects of FOXO3 overexpression on γ-globin and β-globin. (E) Quantification of western blot (3 independent assays). Error bar represents SD. ***P < .0001, **P < .005, *P < .05. NS, not significant.
Metformin induces FOXO3 in erythroblasts
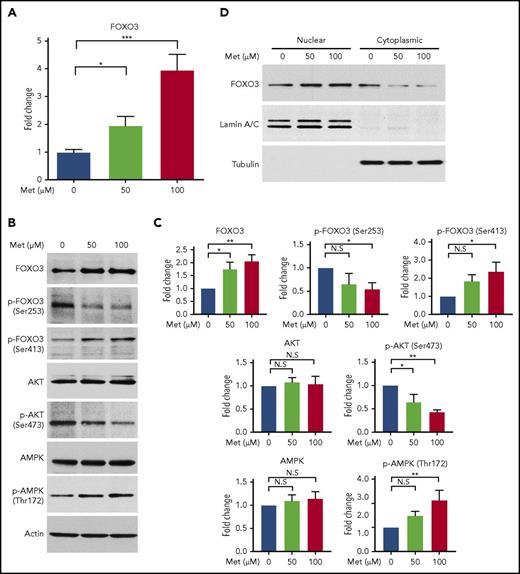
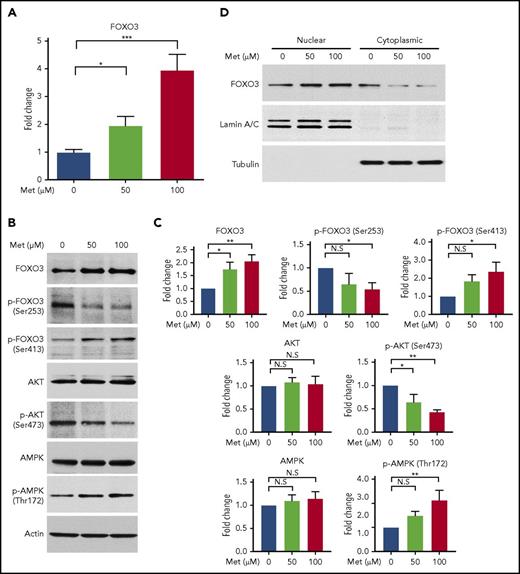
Metformin activates FOXO3 directly or through activation of AMPK in various nonerythroid cell types.28,30 Therefore, we treated normal human CD34+ HSPCs with metformin (0, 50, and 100 µM) to determine its effect on FOXO3 expression and activity in erythroid progenitor cells, as well as to establish whether it would be a suitable compound to examine the effects of pharmacologic induction of FOXO3 on γ-globin. For comparison, the therapeutic level of metformin in the serum of patients with type 2 diabetes is ∼70 µM.45 Metformin produced a two- to fourfold increase in FOXO3 mRNA, as measured by RT-qPCR (Figure 2A).
Treatment of HSPCs with metformin (Met) increases FOXO3 expression, increases the active form of FOXO3, and causes FOXO3 to accumulate in the nucleus. (A) Effect of Met treatment on FOXO3 expression, as measured by RT-qPCR. HSPCs derived from patients with SCD were treated on day 7 of culture and analyzed on day 14. (B) Met treatment increases the active form of FOXO3 activator AMPK (Thr172 phosphorylated AMPK) and the active nuclear-localizing form of FOXO3 (Ser413 p-FOXO3) and decreases the active form of the FOXO3 inhibitor, AKT (Ser473 phosphorylated AKT), and the cytoplasmic form of FOXO3 (Ser253 p-FOXO3). HSPCs derived from patients with SCD were treated on day 13 of culture and analyzed 24 hours later on day 14. (C) Aggregate of 3 individual western blots from 3 experiments with unique CD34+ donors with SCD, quantified. (D) Met treatment causes FOXO3 to accumulate in the nucleus. HSPCs from normal donors were treated with various concentrations of Met for 24 hours, collected, separated into nuclear and cytoplasmic fractions, and analyzed by western blot. Error bar represents SD. ***P < .0001, **P < .005, *P < .01. N.S, not significant.
Treatment of HSPCs with metformin (Met) increases FOXO3 expression, increases the active form of FOXO3, and causes FOXO3 to accumulate in the nucleus. (A) Effect of Met treatment on FOXO3 expression, as measured by RT-qPCR. HSPCs derived from patients with SCD were treated on day 7 of culture and analyzed on day 14. (B) Met treatment increases the active form of FOXO3 activator AMPK (Thr172 phosphorylated AMPK) and the active nuclear-localizing form of FOXO3 (Ser413 p-FOXO3) and decreases the active form of the FOXO3 inhibitor, AKT (Ser473 phosphorylated AKT), and the cytoplasmic form of FOXO3 (Ser253 p-FOXO3). HSPCs derived from patients with SCD were treated on day 13 of culture and analyzed 24 hours later on day 14. (C) Aggregate of 3 individual western blots from 3 experiments with unique CD34+ donors with SCD, quantified. (D) Met treatment causes FOXO3 to accumulate in the nucleus. HSPCs from normal donors were treated with various concentrations of Met for 24 hours, collected, separated into nuclear and cytoplasmic fractions, and analyzed by western blot. Error bar represents SD. ***P < .0001, **P < .005, *P < .01. N.S, not significant.
We then used western blot to analyze total and phosphorylated AKT, AMPK, and FOXO3 proteins to determine the effect of metformin on AKT (FOXO3 inhibitor), AMPK (FOXO3 activator), and the amount of active FOXO3 (Figure 2B-C). AKT is activated by phosphorylation at Ser473; this active form was reduced by metformin in HSPCs. Activated AKT phosphorylates FOXO3 at Ser253, reportedly causing FOXO3 to be bound to 14-3-3 and translocated to the cytoplasm, where it is degraded.46 The amount of FOXO3 phosphorylated at Ser253 was reduced by metformin in HSPCs. The active phosphorylated form of AMPK (Thr172) was increased by metformin, and an increase in the active form of FOXO3, phosphorylated by AMPK at Ser413, was also increased by metformin. Therefore, metformin increases the activated form of FOXO3 (phosphorylated FOXO [p-FOXO3] at Ser413) and reduces the inactive form of FOXO3 (p-FOXO3 at Ser253) through activating AMPK and inactivating AKT. The end result is that metformin causes FOXO3 to localize in the nucleus where it is active, as we demonstrated by separating the cytoplasmic and nuclear fractions of metformin-treated HSPCs and finding that metformin increased the amount of FOXO3 in the nucleus (Figure 2D).
Metformin induces erythroid expression of HbF by activating FOXO3
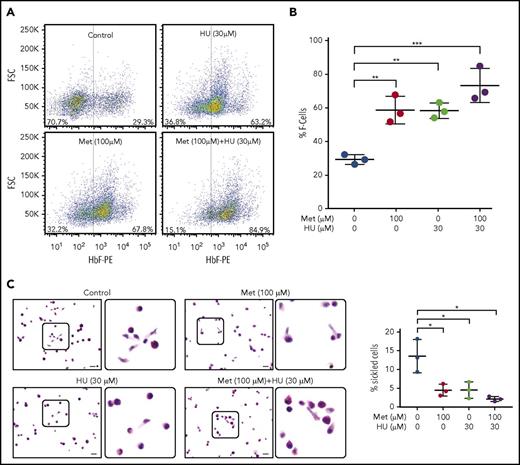
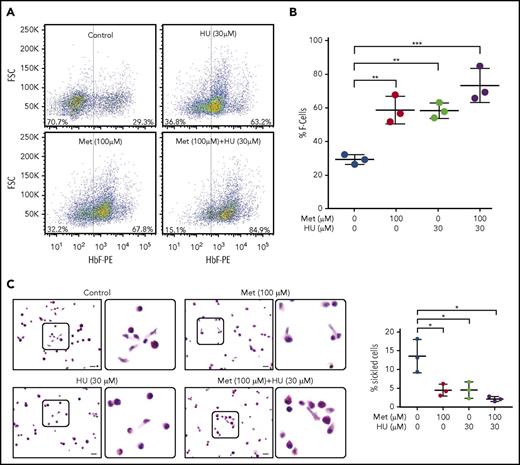
Having established that metformin increases the active nuclear form of FOXO3 in erythroid progenitor cells, we then determined the effect of metformin treatment, alone and with HU, on HbF-immunostaining cells (F cells), as measured by FACS. Both metformin and HU increased the percentage of F cells; the 2 drugs together had an additive effect (Figure 3A). The aggregate of 3 individual assays with 3 unique CD34+ cell donors is shown in Figure 3B.
Metformin (Met) increases the number of HbF-expressing cells in HSPCs and prevents sickling under hypoxic conditions. (A) CD34+ cells from normal individuals were cultured under conditions to promote erythroid maturation. The indicated drugs were added at day 7 and samples were collected on day 14. HbF-immunostained cells (F cells) were measured by flow cytometry at day 14. (B) Aggregate of 3 independent assays. (C) CD34+ cells from a patient with SCD, treated with the indicated drugs from days 7 to 28. On day 28, cells were placed in 2% O2 for 4 hours, fixed, and stained with Wright/Giemsa; scale bars, 10 µm. Error bar represents SD from 3 experiments using CD34+ cells from 3 patients with SCD. ***P < .0001, **P < .005, *P < .01.
Metformin (Met) increases the number of HbF-expressing cells in HSPCs and prevents sickling under hypoxic conditions. (A) CD34+ cells from normal individuals were cultured under conditions to promote erythroid maturation. The indicated drugs were added at day 7 and samples were collected on day 14. HbF-immunostained cells (F cells) were measured by flow cytometry at day 14. (B) Aggregate of 3 independent assays. (C) CD34+ cells from a patient with SCD, treated with the indicated drugs from days 7 to 28. On day 28, cells were placed in 2% O2 for 4 hours, fixed, and stained with Wright/Giemsa; scale bars, 10 µm. Error bar represents SD from 3 experiments using CD34+ cells from 3 patients with SCD. ***P < .0001, **P < .005, *P < .01.
As proof of principle, we next determined the effect of metformin, alone and with HU, on sickling of HSPCs from patients with SCD under hypoxic conditions. We dosed HSPC cultures from 3 patients with SCD with no drug, 30 µM HU, 100 µM metformin, or 30 µM HU + 100 µM metformin from day 7 to day 28. The cells were then placed for 4 hours in 2% oxygen to induce sickling, fixed with glutaraldehyde, and counted manually. Metformin alone produced a threefold reduction in sickling, comparable to that of HU. The 2 drugs together produced a twofold reduction in the percentage of sickled erythroid cells compared with monotherapy (Figure 3C-D).
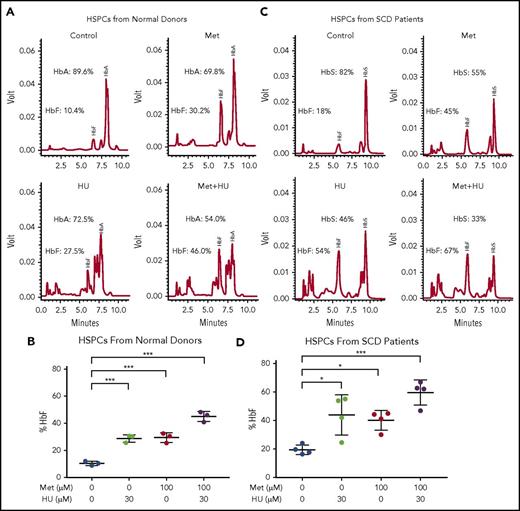
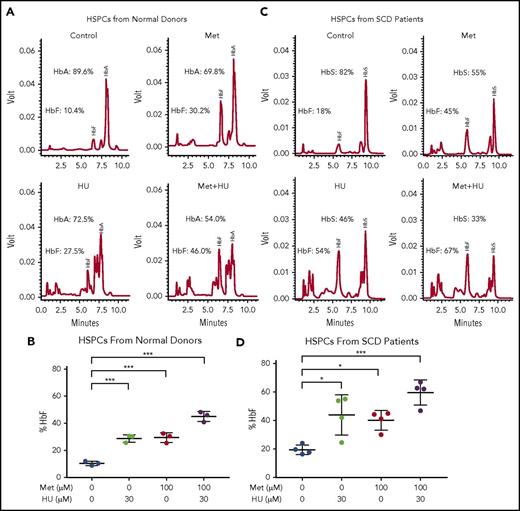
To further investigate the effect of the combination of HU and metformin on HbF, we left HSPCs from normal human blood donors untreated or treated them with 100 µM metformin, alone or in combination with 30 µM HU (Figure 4A-B). The effect of treatment on the γ/γ+β globin ratio was measured by RT-qPCR; it showed greater γ/γ+β globin expression with the 2 drugs together compared with individual treatment (supplemental Figure 2). Representative HPLC tracings are shown from a single normal blood donor. HbF induction was comparable for HU (30 µM) and metformin (100 µM) (27.5% and 30.2%, respectively); the 2 drugs together produced 46% HbF (Figure 4A). The aggregate scatterplot of the percentage of HbF/(HbF+HbA) of CD34+ cells treated with both drugs from 3 individual blood donors is shown in Figure 4B.
Metformin (Met) and HU additively induce HbF in HSPCs from normal individuals and from patients with SCD. (A) HSPCs from a normal individual were treated with the indicated drugs on day 7 of culture and analyzed at day 14. HbA and HbF were measured by HPLC; representative graphs are shown. (B) Aggregate of results of drug treatment of HSPCs from normal individuals on HbF (%). (C) HSPCs from an individual with SCD were treated with the indicated drugs on day 7 of culture and analyzed at day 14. HbA and HbF were measured by HPLC; representative graphs are shown. (D) Aggregate of results of drug treatment of HSPCs from individuals with SCD on HbF (%), calculated as (HbF/HbF+HbA) * 100. Error bar represents SD. ***P < .0001, *P < .05.
Metformin (Met) and HU additively induce HbF in HSPCs from normal individuals and from patients with SCD. (A) HSPCs from a normal individual were treated with the indicated drugs on day 7 of culture and analyzed at day 14. HbA and HbF were measured by HPLC; representative graphs are shown. (B) Aggregate of results of drug treatment of HSPCs from normal individuals on HbF (%). (C) HSPCs from an individual with SCD were treated with the indicated drugs on day 7 of culture and analyzed at day 14. HbA and HbF were measured by HPLC; representative graphs are shown. (D) Aggregate of results of drug treatment of HSPCs from individuals with SCD on HbF (%), calculated as (HbF/HbF+HbA) * 100. Error bar represents SD. ***P < .0001, *P < .05.
We then treated SCD patient–derived CD34+ cell cultures with HU and/or metformin and measured hemoglobin proteins in erythroid progeny. Representative HPLC tracings are shown in Figure 4A and 4C. Figure 4D shows a summary of data generated from 4 SCD patients. In HU-treated cultures derived from HSPCs from blood donors and patients with SCD, additional peaks are visible on HPLC due to carbamylation of hemoglobin, as previously described.47
Of note, the response to HU and metformin varied among individuals, with HSPCs from SCD patients showing greater variation. The HSPCs from 1 patient with SCD showed little HbF induction in response to HU. Individual patient and normal donor responses are shown in supplemental Figure 3. Overall, however, the combination of metformin and HU produced high levels of HbF, with a concomitant reduction in HbS to levels typically seen in patients with sickle cell trait.
Metformin treatment does not delay erythroid maturation of cultured HSPCs
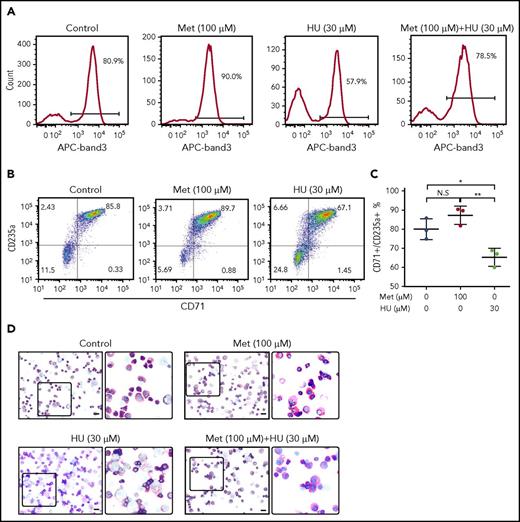
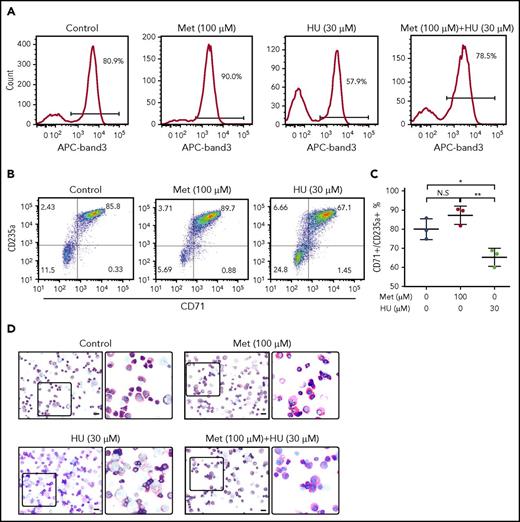
Because FOXO3 is required for erythroid maturation, we hypothesized that metformin, a FOXO3 activator, would not delay erythroid maturation, as seen with HU treatment.23 Normal human-derived HSPCs were left untreated or were treated with metformin (100 µM) or HU (30 µM) and analyzed for surface expression of band 3 (Figure 5A), a known marker of late-stage terminal erythroid differentiation, by flow cytometry. In our culture system, 80.9% of untreated cells were positive for band 3. HU treatment resulted in the expected arrest of erythroid maturation, decreasing band 3 positivity to 57.9%. In contrast, metformin treatment accelerated erythroid maturation slightly, with 90% band 3 positivity. Metformin and HU together resulted in 78.5% band 3 positivity, similar to that of the untreated cells. These findings were supported by the slightly higher double CD71 and GPA positivity in metformin-treated cells compared with control, as well as by visual review of progenitor morphology, which did not detect a significant difference in maturation (Figure 5B-D). Therefore, we conclude that metformin treatment does not arrest erythroid maturation.
Treatment of primary erythroid culture with metformin (Met) does not arrest erythroid maturation. Normal CD34+ cells were cultured under conditions to promote erythroid maturation, and the indicated drugs were added at day 7. (A) Cells were collected and analyzed by FACS at day 14 for band 3 positivity. (B) Cells were collected and analyzed by FACS at day 14 for CD71/GPA positivity. (C) Aggregate of results from 3 unique SCD donors. (D) Cells were fixed and stained with Wright/Giemsa; scale bars, 10 µM. **P < .005, *P < .05. N.S, not significant.
Treatment of primary erythroid culture with metformin (Met) does not arrest erythroid maturation. Normal CD34+ cells were cultured under conditions to promote erythroid maturation, and the indicated drugs were added at day 7. (A) Cells were collected and analyzed by FACS at day 14 for band 3 positivity. (B) Cells were collected and analyzed by FACS at day 14 for CD71/GPA positivity. (C) Aggregate of results from 3 unique SCD donors. (D) Cells were fixed and stained with Wright/Giemsa; scale bars, 10 µM. **P < .005, *P < .05. N.S, not significant.
FOXO3 is necessary for HbF induction by metformin
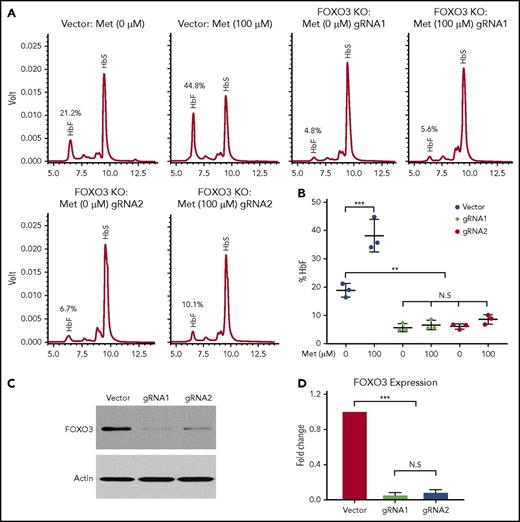
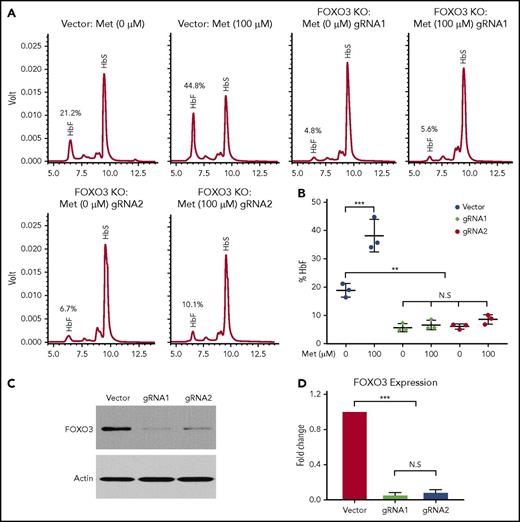
Although the precise mechanism by which metformin induces HbF needs to be investigated further, we determined that FOXO3 was necessary for metformin induction of HbF in HSPCs from patients with SCD (Figure 6). We used CRISPR/Cas9 genome editing to knock out FOXO3 in HSPCs and treated unmodified and FOXO3-knockout cells with 100 µM metformin. HbF production was analyzed by HPLC (Figure 6A). The results of 3 individual assays were quantified (Figure 6B). When FOXO3 was knocked out (Figure 6C-D), γ-globin was greatly reduced, and metformin did not increase the production of γ-globin, as it did in the unedited HSPCs from the same donor. Therefore, we conclude that FOXO3 is necessary for metformin induction of HbF in HSPCs.
Metformin (Met) induces γ-globin protein and RNA in a FOXO3-dependent manner. (A) The effect of Met treatment on HbF in HSPCs with FOXO3 knocked out using CRISPR/Cas9, as determined by representative HPLC. (B) Three aggregate experiments. (C) Western blot showing the effect of CRISPR/Cas9 editing on FOXO3 protein. (D) Quantification of the effect of CRISPR/Cas9 editing on FOXO3 expression. Error bar represents SD. ***P < .0001, **P < .001. KO, knockout; N.S, not significant.
Metformin (Met) induces γ-globin protein and RNA in a FOXO3-dependent manner. (A) The effect of Met treatment on HbF in HSPCs with FOXO3 knocked out using CRISPR/Cas9, as determined by representative HPLC. (B) Three aggregate experiments. (C) Western blot showing the effect of CRISPR/Cas9 editing on FOXO3 protein. (D) Quantification of the effect of CRISPR/Cas9 editing on FOXO3 expression. Error bar represents SD. ***P < .0001, **P < .001. KO, knockout; N.S, not significant.
Metformin does not act through known modifiers of HbF
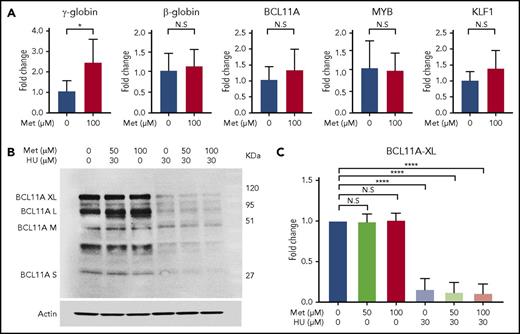
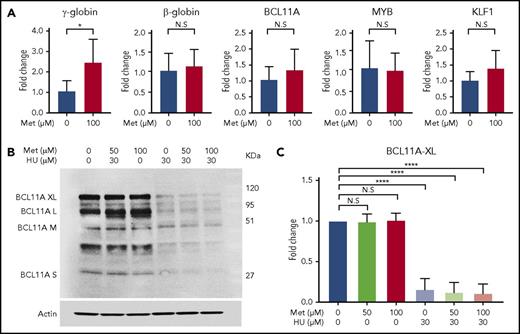
To determine the effect of metformin on known modifiers of HbF (ie, BCL11A, MYB, and KLF1),44,48,49 we treated CD34 cells with 100 µM metformin on day 7 of culture and collected the cells for RT-qPCR and western blot analysis at day 14. RT-qPCR analysis of extracted RNA revealed that, although metformin treatment produces a threefold increase in γ-globin mRNA, it does not alter HBB, BCL11A, KLF1, or MYB expression at the RNA level (Figure 7A). Western blot analysis found that BCL11A protein levels were not altered by metformin treatment; in contrast, HU reduced BCL11A protein levels (Figure 7B). An aggregate of 3 independent assays with BCL11A XL, analyzed by quantitative western blot, is shown in Figure 7C. BCL11A XL was chosen because that isoform is reported to have the most activity in γ-globin repression.
Metformin (Met) does not act through known modifiers of HbF. (A) Treatment with Met does not alter expression levels of BCL11A, KLF1, or MYB. HSPCs from 3 patients with SCD were treated with Met (0 or 100 µM), and expression levels were analyzed by RT-qPCR. (B) Effect of Met treatment on BCL11A, as shown in a representative western blot. (C) Aggregate of 3 independent assays, with quantification of the BCL11A XL band. Error bar represents SD. ****P < .00001, *P < .01. N.S, not significant.
Metformin (Met) does not act through known modifiers of HbF. (A) Treatment with Met does not alter expression levels of BCL11A, KLF1, or MYB. HSPCs from 3 patients with SCD were treated with Met (0 or 100 µM), and expression levels were analyzed by RT-qPCR. (B) Effect of Met treatment on BCL11A, as shown in a representative western blot. (C) Aggregate of 3 independent assays, with quantification of the BCL11A XL band. Error bar represents SD. ****P < .00001, *P < .01. N.S, not significant.
Discussion
The most significant modifier of SCD severity is HbF levels.4,50-59 We sought to use natural genetic variation to reveal additional regulators of HbF, much the way that GWASs were used to identify BCL11A.11 To investigate rare variants, we used WES data from pediatric patients with SCD as a hypothesis generator, because our relatively small sample size limited our statistical power. Our analysis found that individuals with nonsynonymous variants in FOXO3 had lower HbF levels. FOXO3 is a transcription factor that has been shown to be essential for erythroid maturation in mouse models,22,24 and it is an important regulator of glucose metabolism,17,60,61 among other functions14,62-66 ; however, it has not previously been implicated in HbF regulation. Here, we presented functional studies supporting the hypothesis that FOXO3 is a partial positive regulator of HbF, likely along with other factors; knockdown of FOXO3 in HSPCs from normal individuals reduced γ-globin expression and production without altering β-globin expression and production.
Metformin, a biguanide that is used primarily to treat type 2 diabetes, has been reported to activate FOXO3 or its activator, AMPK, in various cell lines and in hepatocytes.28,30-34,67 We first determined the effect of metformin on FOXO3 expression and activity in human erythroid progenitor cells and found that metformin (1) increased FOXO3 expression, (2) increased the activated form of FOXO3 through increasing the active form of its activator, AMPK, (3) decreased cytoplasmic translocation of FOXO3 through reduction of the active form of AKT, and (4) caused FOXO3 to accumulate in the nucleus, where it is active. We then treated human HSPCs with metformin to test our hypothesis that HbF could be induced. Our rationale was that, because knockdown of FOXO3 results in a decline in HbF, an increase in FOXO3 via drug induction would result in an increase in HbF (Figure 2). Metformin levels of 50 and 100 µM were chosen to be comparable to serum levels achievable by typical diabetic dosing of 70 µM metformin.45
Here, we present preclinical data to support the use of metformin to induce HbF and ameliorate the complications of SCD. We show that metformin, at micromolar concentrations achievable in serum at usual diabetic dosing,45 and not the millimolar levels described in the cancer literature that cause apoptosis,28 can significantly increase HbF levels in HSPCs from normal human blood donors and patients with SCD. We further established that metformin did not arrest erythroid maturation, making it a possible therapy for beta thalassemia patients, and that it could likely be given with an agent that did arrest erythroid maturation, such as HU. HSPCs treated with metformin in combination with HU showed additive HbF induction and prevention of sickling under hypoxic conditions.
The mechanism by which metformin induces HbF in HSPCs remains to be fully elucidated. It is well known that γ-globin is expressed more highly relative to β-globin early in erythroid maturation.68 FOXO3 is necessary for erythroid maturation24 ; metformin, which increases FOXO3 production and activity, accelerates erythroid maturation. Therefore, HbF induction by metformin is unrelated to its effects on erythroid maturation, because acceleration of maturation (shown in Figure 5 as an increase in band 3 positivity) would be expected to reduce HbF, not increase it. Further support that HbF induction by metformin is independent of maturation alteration can be seen in the observation that HSPCs treated with metformin and HU together have a band 3 positivity similar to untreated HSPCs, yet show an additive increase in the percentage of HbF. It has been postulated that HU induces HbF through increasing stress erythropoiesis.69 In contrast, FOXO3 is essential to the management of oxidative stress in erythroid cells.14 Therefore, it is also unlikely that an agent that increases FOXO3 would induce stress erythropoiesis in HSPCs.
We have shown that FOXO3 is necessary for HbF induction by metformin and that treatment with metformin does not significantly alter the expression or production of BCL11A in HSPCs or expression of known modifiers of HbF, KFL1 or MYB. This supports our assertion that metformin does not induce HbF through known HbF modifiers.
It is possible that HbF induction by metformin is the result of metabolic manipulation: that metformin induces a mild starvation of the red cell. Observations, made in 1985, that HbF is higher and persists longer in neonates born to diabetic mothers support this hypothesis.70,71 The relevance of the FOXO3 pathway to HbF regulation has also been suggested by the observation that SIRT1, a FOXO3 activator, induces HbF in HSPCs.72
A limitation of this work is that it was performed entirely in vitro, in the gold standard system for studying hemoglobin switching.73,74 Other agents have successfully induced HbF in cell lines or HSPCs but failed in vivo. It is possible that the necessary concentration of metformin will not be achieved in HSPCs in vivo. Although red cells have been shown to be a reservoir for metformin,45,75,76 levels in CD34+ cells are not known. However, a large number of experimental HbF-inducing agents have failed because of the lack of oral bioavailability77 or excessive toxicity,77,78 neither of which is a concern with metformin.
Altogether, our data provide evidence that metformin is a promising HbF-inducing agent, one that may fill many unmet clinical needs: as a solo HbF-inducing agent that can be used in low-resource countries in which laboratory monitoring of myelosuppressive agents like HU is difficult, in pregnancy, and for quantitative hemoglobinopathies in which erythroid suppression is undesirable. As a joint agent with HU, metformin may help older teen and adult patients attain higher levels of HbF and greater disease control. Based on these findings, the Baylor College of Medicine has approved a clinical trial of metformin as a HbF inducer in patients with hemoglobinopathies: Fetal Hemoglobin Induction Treatment With Metformin (FITMet; NCT02981329).
The online version of this article contains a data supplement.
The publication costs of this article were defrayed in part by page charge payment. Therefore, and solely to indicate this fact, this article is hereby marked “advertisement” in accordance with 18 USC section 1734.
Acknowledgments
The authors greatly appreciate Betty Pace’s invaluable mentorship and guidance. They also thank Russell Ware for supplying the samples and phenotypes for the WES analysis that led to the investigation of FOXO3.
The functional studies of FOXO3 and metformin were supported by National Institutes of Health, National Institute of Diabetes and Digestive and Kidney Diseases Grant 1K08DK110448-01, an American Society of Hematology Scholar Award, and a Chao Physician Scientist Award. WES and WES analyses were supported by National Institutes of Health, National Human Genome Research Institute Grant U54 HG003273 and a Russell and Diana Hawkins Family Foundation Discovery Fellowship.
Authorship
Contribution: Y.Z. and V.A.S designed the experiments, analyzed the data, and wrote the manuscript, with input and editing from M.J.W. and A.P.; P.S. and J.R.C. analyzed the sequence data, J.R.C. with supervision from E.B.; and Y.Z., A.P., and C.C.G.S. performed research.
Conflict-of-interest disclosure: The authors declare no competing financial interests.
Correspondence: Vivien Sheehan, Division of Hematology/Oncology, Department of Pediatrics, Baylor College of Medicine, 1102 Bates St, FC 1030.17, Houston TX 77030; e-mail: vsheehan@bcm.edu.

