INTRODUCTION
The 2017 WHO classification requires the presence of ≥1x10⁹/L and ≥10% of monocytes in peripheral blood (PB) for the diagnosis of CMML. Recently, Geyer et al. defines oligomonocytic CMML (O-CMML) as those MDS cases with relative monocytosis (≥10% monocytes) and monocyte count 0.5<1x10⁹/L. The authors showed that clinicopathologic and mutational profile of OCMML were similar to overt CMML. The study of PB monocyte subsets by flow cytometry (FC) has gained interest for CMML diagnosis. As showed by Selimoglu-Buet et al, the increase of classical monocytes (Mo1) >94% is a highly sensitive and specific diagnostic marker for CMML. In the extent of our knowledge, there are no data about PB monocyte subset distribution by FC in O-CMML. Moreover, CD2 and CD56 expression is common in CMML and rarely observed in MDS, the group where O-CMML are currently included. Furthermore, we compared: the molecular profile; cytogenetic abnormalities; cytopenias; BM dysplasia; BM blast and monocyte percentage; PB monocyte percentage, and monocyte and leukocyte counts.
METHODS
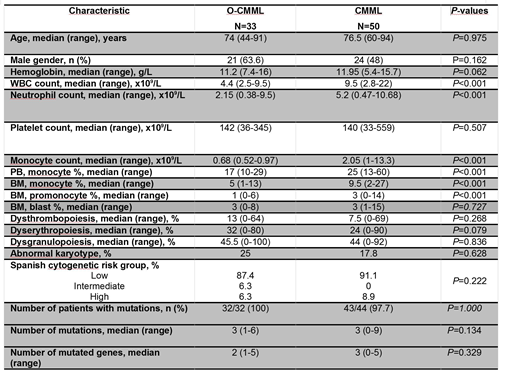
50 CMML and 33 O-CMML from a single institution were prospectively studied from 02/2016 to date. Table 1 summarizes morphologic, cytogenetic, molecular and clinical findings. We studied PB monocyte subsets by FC: Mo1 (CD14bright/CD16-), Mo2 (CD14bright/CD16+) and Mo3 (CD14dim or -/CD16bright). In addition, we assessed the expression of CD56 and CD2 in monocytes (positivity ≥ 20%). Finally, targeted NGS of the entire exonic sequence of 25 genes recurrently mutated in myeloid malignancies was performed (VAF sensitivity: 2%). Chi-Square, Fisher exact or Man-Whitney U tests were used as appropriate.
RESULTS AND DISCUSSION
The Mo1 percentage (%) was significantly inferior in O-CMML (P=0.007), but it is noteworthy that median and mean of Mo1% in O-CMML were upper the cutoff of 94% (median: 96.1 vs 98.1; mean: 94.7 vs 96.9). Moreover, the % of patients with >94% Mo1 was no significantly different when comparing O-CMML and CMML although a clear trend was observed (72% vs 90%; P=0.082). This result is impressive since, as previously reported, the specificity of the Mo1 >94% test is around 90-95% and only 5-10% of false positive rate (FP) should be expected. However, in O-CMML a 72% of FP was observed since following 2017 WHO recommendation these patients should be considered as MDS.
No differences were observed neither in the % of patients showing CD56+ monocytes (65.6% vs 66.7%; P=0.923) nor in the % of them showing CD2+ (28.1% vs 37.5%; P=0.53) when comparing O-CMML and CMML.
We observed no significant differences in platelet count, hemoglobin, BM dyserythropoiesis, BM dysgranulopoiesis, BM dysmegacaryopoiesis, BM blast %, percentage of abnormal karyotypes, and Spanish cytogenetic risk stratification. The main differences were observed in leukocyte count, monocyte count, PB monocyte %, BM monocyte %, and BM promonocyte percentage. Table 1.
There were no differences in the number of mutated genes or in the number of mutations between CMML and O-CMML (Table 1). As expected, TET2 and SRSF2 were the most frequently mutated genes in both groups. Moreover, no significant difference was observed in the presence of TET2/SRSF2 co-mutation, the gene signature of CMML (32% vs 26% in CMML). The genes mutated at a frequency >10% in O-CMML were: TET2 (79%), SRSF2 (36%), SF3B1 (29%), ZRSR2 (25%), DNMT3A (15%), and ASXL1 (14%). The genes mutated at a frequency >10% in CMML were: TET2 (81%), SRSF2 (28%), ASXL1 (23%), CBL (23%), SF3B1 (16%), and NRAS (14%). Only two genes were mutated at a significant different frequency: CBL (4% vs 23% in CMML, P=0.041) and ZRSR2 (25% vs 7% in CMML, P=0.043). As expected, CMML showed a higher % of RAS pathway mutations (CBL, NRAS or KRAS) since these have been associated with proliferative features (4% vs 40%, P=0.001). This is especially evident in proliferative CMML in which genes associated with proliferation are present at higher frequencies: CBL (4% vs 39% in CMML, P=0.01), NRAS (0 vs 23% in CMML, P=0.029) and ASXL1 (14% vs 62% in CMML, P=0.004).
A significant lower percentage of O-CMML with ZRSR2mut presented Mo1 >94% (33% vs 86%, P=0.024). As shown, O-CMML without ZRSR2mut showed this feature in a similar percentage than CMML (86% vs 90%).
At a median follow-up of 31.2 months, 19% of O-CMML evolved to CMML showing a median time to evolution of 34 months.
CONCLUSION
Our data support the diagnosis of O-CMML as a distinctive subtype of CMML.
Bellosillo:Qiagen: Consultancy, Speakers Bureau; TermoFisher Scientific: Consultancy, Speakers Bureau.
Author notes
Asterisk with author names denotes non-ASH members.


