Abstract
Introduction: Sickle cell disease (SCD) results from the polymerization of the hemoglobin S (HbS) in its T state. The hemoglobin S (HbS) is a variant of normal human hemoglobin A0 (HbA0) with the substitution of the sixth hydrophilic glutamic acid by a hydrophobic valine. The polymerization of HbS depends highly on its concentration and the oxygen partial pressure (ie low pO2). Fetal hemoglobin (HbF) is a potent inhibitor of HbS polymerization making increasing HbF expression a therapeutic strategy. However few studies investigated the optimal HbF target to reach.
Neutron spin echo (NSE) spectroscopy is based on the determination of neutron velocities changes after interaction with the sample in constant magnetic fields. By measurement of the beam polarization after a neutron beam passes through a sample, it gives access to the space Fourier transform of the particle pair-correlations (called intermediate scattering function: I(q,t)) as a function of both time and wavevector, with a extremely high resolution (300 nanoseconds). Neutron diffraction patterns are also accessible providing information on the molecular arrangement of a sample, at the nanometer scale (Angstrom). Using NSE spectroscopy we have shown that Hb diffusion inside RBCs is similar to that in solution at the same concentration [1]. From the concentration dependence of the diffusion coefficient and using a simple model developed for oxygen uptake in the lungs [2] we have shown that the concentration of Hb inside RBCs corresponds to an optimum oxygen transport for an individual under physical activity [3].
Objective: 1/ To investigate the structure and the dynamics of HbS using NSE spectroscopy. 2/ to better understand how HbF inhibit HbS polymerization and its optimal target.
Methods: We implemented a new method to study simultaneously the HbS polymerization process and the diffusion of free Hb remaining in solution using NSE spectroscopy at the Institut Laue-Langevin in Grenoble, France. Hb solutions were obtained from RBCs of patients or healthy donors after hyposmotic hemolysis and ultracentrifugation at 150.000g for 1 hour. To amplify the signal, the exchange of hydrogen with deuterium was performed by dialysis. Different mixtures of HbF/HbS (with HbF = 0, 15, 24 and 100%) as well as HbA (100%), at a concentration of 200 g/L, were studied at pH = 7.4 and under different pO2 ranging from 0 to 20%.
Results: NSE has been used for the first time to analyze HbS polymerization characteristics. These studies show how the polymerization process is strongly affected by the pO2 and the fraction of HbF present in solution.
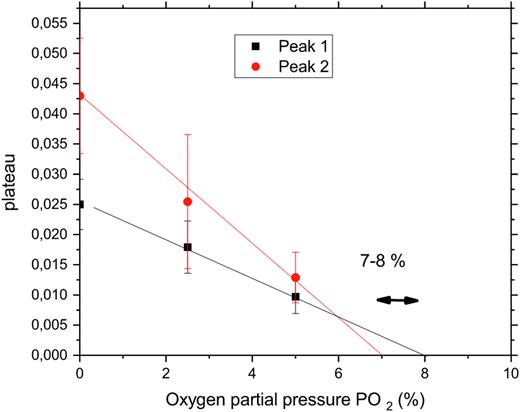
NSE measures the particle pair-correlations as a function of time. After a decrease in the pO2, HbS molecules start to polymerize and stop to move, between 8 and 7 % O2 in our experiment (Figure 1). We observed a relative variation of 2 hemoglobin polymer "peaks” for pure HbS solution according to pO2 applied, with peak 1 and peak 2 corresponding to 2 different HbS fibers. At this moment the signal measured gives a "plateau” (y axis). Higher plateau values indicate higher number of HbS molecules within the fiber. Moreover, we showed how the free (non polymerized) Hb diffusion is affected by polymerization and discuss some physiological implications.
HbF highly decreased the HbS polymerization and improved the Hb diffusion depending on its concentration. Under our conditions, at 0% O2, HbS polymer fibers were scarce with the mixture containing 24% HbF.
Conclusion: We provide new insights to better understand the HbS polymerization and its inhibition induced by HbF as well as their behavior according to Hb oxygen saturation. This study also represents further bases to better define a protective HbF threshold to reach to clinically control SCD.
1-W. Doster and S. Longeville, Biophys. J. (2007) 93 (4), 1360-1368.
2-A. Clark et al., Biophys. J. 1985, 47, 171.
3-S. Longeville et al., Scientific Report, 2017, 7, 10448
Figure 1: Example of HbS molecules polymerization induced by decrease in PO2. Solution of pure HbS measured by NSE according to pO2 (x -axis). NSE measures the particle pair-correlations as a function of time. When HbS molecules stop to move (polymerization) the measured signal gives a plateau (y axis) whose value is increased by an increased number of molecules within the fiber. Peak 1 and peak 2 correspond to 2 different HbS fibers.
Disclosures
Bartolucci:JazzPharma: Consultancy; Innovhem: Other: Co-founder; Hemanext Inc: Consultancy; Novartis: Consultancy, Research Funding; Global Blood Therapeutics: Consultancy, Research Funding; Agios: Consultancy, Research Funding; Emmaus: Consultancy, Research Funding; Bluebird bio: Consultancy, Research Funding; Fabre Foundation: Research Funding; Roche: Consultancy; Addmedica: Consultancy, Research Funding.
Author notes
Asterisk with author names denotes non-ASH members.


