Key Points
Glofitamab combinations with chemotherapy and antibody-drug conjugates reveal strong synergy in preclinical humanized lymphoma models.
Novel chemotherapy-free combinations further amplify glofitamab activity and present promising tailored alternatives to SOC treatments.
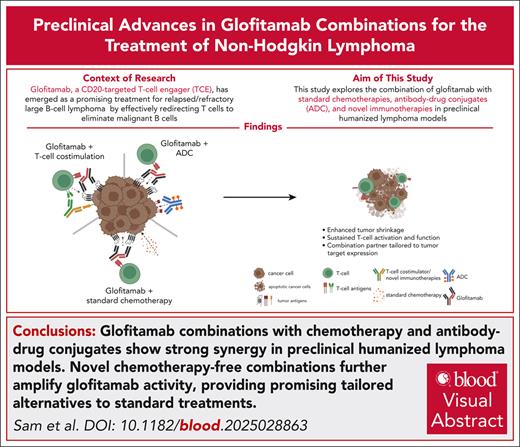
Visual Abstract
T-cell engagers (TCEs) are transformative therapeutics in hematologic malignancies, including non-Hodgkin lymphoma. Initially approved for relapsed/refractory disease settings, TCEs are now explored in first-line and second-line settings, often combined with standard-of-care (SOC) treatments, including chemotherapy and antibody-drug conjugates. This study investigates glofitamab (CD20×CD3 TCE) combinations in preclinical humanized lymphoma models, addressing heterogeneity of tumor antigen expression, immune evasion, and T-cell exhaustion. Combining glofitamab with R-CHP-Pola (rituximab, cyclophosphamide, doxorubicin, prednisone, and polatuzumab vedotin) chemotherapy or Pola demonstrated strong synergistic antitumor efficacy with rapid tumor regression and reduced tumor cell proliferation. Glofitamab combination with gemcitabine/oxaliplatin also demonstrated strong efficacy, enhancing intratumor T-cell number, activation, and reduced exhaustion. These combinations were particularly advantageous in models with low and heterogeneous CD20 expression, facilitating rapid tumor debulking and elimination of CD20-low/CD20– cells. Translational studies with patient-derived peripheral blood mononuclear cells receiving glofitamab combination with chemotherapies demonstrated sustained T-cell functionality throughout extended treatment cycles. Novel chemotherapy-free combinations, including CD19-targeted 4-1BBL and CD19-CD28, amplified glofitamab activity, especially in CD20 high– and homogenous-expressing tumor models, with dual costimulatory approaches revealing synergy. In addition, the combination with checkpoint inhibitors (programmed cell death protein 1/Lag3-bispecific antibody) and regulatory T-cell depletion (α-CD25) emerged as promising approaches for enhanced efficacy and to sustain T-cell functionality. These findings highlight the versatility of glofitamab when integrated with SOC and innovative combinations, addressing resistance and improving patient outcomes. The preclinical investigations provide a strong foundation for ongoing and future clinical trials, emphasizing the need to tailor TCE-based combination therapies to maximize efficacy while minimizing toxicity in lymphoma treatment. These trials were registered at www.clinicaltrials.gov as #NCT04408638 and NCT03467373.
Introduction
Glofitamab, a CD20-targeted T-cell engager (TCE), has emerged as a promising treatment for relapsed/refractory (R/R) large B-cell lymphoma (R/R LBCL) by effectively redirecting T cells to eliminate malignant B cells.1 TCEs are powerful agents that simultaneously bind to tumor antigens and CD3ε on T cells, facilitating immunological synapse formation, polyclonal T-cell activation, and subsequent tumor cell killing. In a phase 2 study (ClinicalTrials.gov identifier: NCT03075696), glofitamab achieved high complete response (CR) rates and durable responses with a manageable toxicity profile,2 leading to its accelerated approval by the US Food and Drug Administration and European Medicines Agency for patients with R/R LBCL after ≥2 previous therapies. This approval reflects a broader trend of TCEs targeting antigens such as CD19, CD20, B-cell maturation antigen, and GPRC5D, which have demonstrated promising efficacy in hematologic malignancies, resulting in recent approvals of teclistamab,3 mosunetuzumab,4 epcoritamab,5 talquetamab,6 and odronextamab,7 beyond the landmark approval of blinatumomab8 in 2014. Despite these advances, there remains significant potential for improving CR rates, duration of response, progression-free survival, and overall survival. The new emerging strategies involve TCE combinations that (1) overcome resistance mediated by loss or downregulation of tumor antigens, (2) target tumor-intrinsic resistance mechanisms and tumor burden by chemotherapy or antibody-drug conjugates (ADCs), or (3) improve T-cell fitness by providing efficient T-cell costimulation and/or preventing T-cell exhaustion.
The development of TCEs in hematologic malignancies is progressing from application in R/R settings to earlier lines of therapy, including first-line and second-line (2L) treatments. In these earlier settings, TCEs are often combined with established chemotherapy regimens.9 For instance, frontline combination treatment of diffuse LBCL (DLBCL) of TCEs with therapies such as R-CHOP (rituximab, cyclophosphamide, doxorubicin, vincristine, and prednisone) and R-CHP-Pola (polatuzumab vedotin) is being explored.10,11 In the 2L setting, regimens such as GemOx (gemcitabine and oxaliplatin) are under investigation.12 However, the potential synergistic effects of combining these regimens with TCEs needs to be further investigated. Some chemotherapeutic agents are known to induce immunogenic cell death (ICD) that stimulates antitumor immunity. For example, anthracyclines and oxaliplatin have been found to induce ICD, leading to the activation of antigen-presenting cells and subsequent T-cell responses.13 Conversely, certain chemotherapy agents may have immunosuppressive effects that could negatively affect T-cell functionality. For instance, platinum-based chemotherapies have been reported to attenuate the proliferative response of effector CD8+ T cells, which could potentially diminish the efficacy of concurrent immunotherapies.14 Therefore, when designing combination therapies involving TCEs and chemotherapy, it is crucial to select agents that either preserve or enhance T-cell function to optimize the synergistic potential.
The combination of TCEs and ADCs represents an additional promising strategy to enhance antitumor efficacy by leveraging complementary mechanisms of action. TCEs mediate immune-driven cytotoxicity by redirecting T cells to tumor cells, whereas ADCs deliver cytotoxic payloads directly to malignant cells via tumor-specific antibodies, enabling efficient tumor cell elimination. By using 2 different tumor antigen targets for the ADC and the combined TCE, this dual approach is particularly relevant for overcoming tumor antigen expression heterogeneity, a remaining major challenge in cancer immunotherapy, where varying levels of antigen expression can lead to immune escape and therapy resistance.15 Preclinical and clinical data suggest that combining ADCs with TCEs may improve therapeutic outcomes, as found in multiple myeloma and other R/R cancers.16 In addition, ADCs have demonstrated significant efficacy in solid tumors, and their integration with TCEs is being explored to enhance immune responses and reduce resistance.17
Last, the exploration of chemotherapy-free combinations involving TCEs is an emerging area in cancer therapy, aiming to enhance antitumor efficacy while minimizing the potential adverse effects associated with traditional chemotherapy.18 Combining TCEs with costimulatory agonists, immune checkpoint inhibitors, and regulatory T-cell (Treg) depletion represents a promising strategy to enhance antitumor immunity by overcoming immunosuppressive barriers and sustaining T-cell activation and fitness. Costimulatory agonists, such as 4-1BB (CD137) and CD28 agonists, amplify T-cell activation and expansion, reinforcing the cytotoxic potential of TCEs and improving response durability.19-21 However, TCE-driven T-cell activation can also lead to upregulation of immune checkpoint molecules, associated with T-cell exhaustion. To counteract this, checkpoint inhibitors, including anti–programmed cell death protein 1 (PD-1)/programmed cell death 1 ligand 1 (PD-L1) antibodies, have been combined with TCEs to sustain T-cell function and enhance antitumor activity. Combining TCEs with other immunotherapeutic agents has demonstrated promise in overcoming resistance mechanisms and enhancing therapeutic outcomes.22-25 In addition, Tregs contribute to an immunosuppressive tumor microenvironment, dampening T-cell responses.26,27 Strategies targeting GITR, OX40, and ICOS, including Treg depletion using α-CD25 antibodies, have been explored to inhibit or eliminate Tregs. These approaches aim to restore T-cell cytotoxicity and enhance the efficacy of immunotherapy.28,29
The integration of TCEs with chemotherapy, ADCs, and chemotherapy-free immunotherapy represents a multifaceted strategy to enhance antitumor activity and overcome resistance. As TCE-based therapies advance into earlier treatment settings, a mechanistic understanding of their combinability is crucial for optimizing clinical outcomes. This study provides a comprehensive preclinical evaluation of glofitamab-based combinations in humanized lymphoma models and primary patient samples, identifying effective combination strategies with the potential to improve clinical efficacy.
Materials and methods
Detailed material and methods are available in the supplemental Data (available on the Blood website).
In vivo studies in tumor-bearing humanized mice
Three- to 4-week-old female NSG mice were humanized through human hematopoietic stem cell engraftment, as detailed in the supplemental Methods. In certain instances, humanized BRGS-CD47 mice were directly obtained from Jackson Laboratory. Cell line- and patient-derived xenograft models were injected subcutaneously into the mouse flank, and tumor volume was monitored using caliper measurements. Treatments were administered via IV or intraperitoneal routes, and body weight monitoring was recorded weekly. As reported in supplemental Figure 1D, the evaluation of glofitamab in all lymphoma models revealed close alignment of OR and CR rates with matching clinical trial results, suggesting high translatability. All studies adhered to ethical guidelines under approved veterinary licenses, with daily monitoring and approved termination criteria applied.
Flow cytometry analysis and ex vivo glofitamab restimulation of patient blood samples
Patient blood samples from the (www.ClinicalTrials.gov identifiers: NCT03467373 and NCT04408638) trials were collected at predefined time points according to clinical protocols. Ex vivo flow cytometry using the T/B/natural killer cell activation panel 4 was centrally evaluated with validated analyses (Covance CCLS). For ex vivo restimulation assays, patient CD4+ and CD8+ T cells were isolated and cocultured with target cells (Toledo) in the presence of glofitamab and analyzed for cytokine production and cell surface activation markers using flow cytometry.
Immunohistochemistry
For histological analysis, tissue samples were fixed in 4% paraformaldehyde and embedded in paraffin. Primary antibodies targeting CD3, CD19, CD20, CD79b, and Ki-67 were used for staining. Stained slides were scanned with an Olympus Slideview VS200, and positive cells were quantified using Halo AI software. The CD20 H-score, ranging from 0 to 300 and based on staining intensity and proportion, was calculated to assess CD20 biomarker abundance in xenograft models.
Ex vivo flow cytometry analysis of mouse tissue
Mouse blood, spleen, and tumor samples were processed into single-cell suspensions and stained with human antibodies targeting CD45, CD3, CD4, CD8, PD-1, Tim-3, Lag-3, CD25, 4-1BB, HLA-DR, or for intracellular markers such as Ki-67 and GZMB. Flow cytometry analysis was conducted using a BD fluorescence activated cell sorter Fortessa or Cytek Aurora, and the data were analyzed with FlowJo software version 10.6.2.
The research involving humanized mouse models was conducted in compliance with ethical standards and approved by the internal Institutional Animal Care and Use Committee. Specifically, the study was conducted under licenses ZH225-17, ZH181/2020, and ZH181/2023, ensuring adherence to established guidelines (GV-Solas, Felasa, Tierschutzgesetzt) for animal welfare. All procedures were performed with regular health monitoring and under specific pathogen-free conditions to ensure the well-being of the animals. In addition, blood samples from patients in the (www.ClinicalTrials.gov identifiers: NCT04408638 and NCT03467373) clinical trials were collected as part of the approved clinical protocol, ensuring compliance with ethical standards for human research.
Results
Evaluation of the combinatorial effect of glofitamab with R-CHOP and R-CHP-Pola
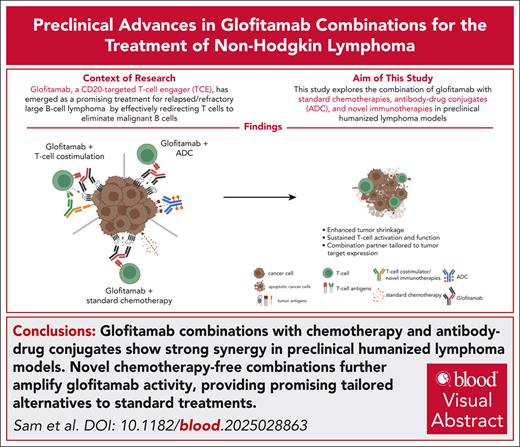
To evaluate the therapeutic potential of combining glofitamab with R-CHOP and R-CHP-Pola, we conducted studies in humanized BRGS47 mice bearing the SU-DHL-8 DLBCL model, which exhibits low/no response to glofitamab. The dosing and scheduling were designed to closely replicate the clinical trial design (www.ClinicalTrials.gov identifier: NCT03467373; Figure 1A). The SU-DHL-8 tumor model is characterized by low and heterogeneous CD20 expression (CD20 H-score of 62; supplemental Figure 1C), high and homogeneous CD79b expression, and very low intratumor T-cell infiltration at baseline (Figure 1B). Treatment with R-CHOP or Pola monotherapy did not result in a substantial tumor growth inhibition (TGI) in this tumor model (Figure 1C). However, the treatment with R-CHP-Pola (in which vincristine in R-CHOP is replaced by Pola) translated into a stronger TGI compared with R-CHOP or Pola (with 2/8 tumor-free animals; Figure 1C). Glofitamab monotherapy displayed a treatment response pattern consisting of an initial tumor response followed by tumor escape (Figure 1C) likely due to the outgrowth of CD20-low/CD20– tumor clones as also found in the glofitamab plus Pola combination (Figure 2G). The combination of glofitamab with R-CHOP did not significantly enhance TGI compared with R-CHOP monotherapy (Figure 1C). In contrast, the combination of glofitamab with R-CHP-Pola resulted in a significant (supplemental Figure 2) and sustained TGI, with 7 of 10 tumor-free animals at study termination (Figure 1C). This superior efficacy was supported by the time-to-event analysis, which demonstrated the greatest median survival benefit for the glofitamab plus R-CHP-Pola group compared with all other treatment groups (Figure 1D). The assessment of body weight kinetics pointed out that all combination and chemotherapy treatment groups (including Pola monotherapy) were well tolerated with a ∼5% or less transient body weight drop compared with glofitamab monotherapy, which displayed a ≥10% transient body weight drop due to treatment-related cytokine release (Figure 1E) in line with its mode of action as reported previously.1 The evaluation of B-cell counts in the blood and spleen on day 17 revealed that all treatments effectively depleted peripheral B cells, with Pola monotherapy being slightly less effective compared with the other treatments at this time point (Figure 1F, left). Furthermore, the assessment of T-cell counts demonstrated a significant glofitamab-induced expansion of T cells in the blood and tumor tissue (Figure 1F, right). This intratumor T-cell expansion was less prominent but still increased compared with the control in the glofitamab plus R-CHP-Pola combination. In contrast, treatments with R-CHOP, Pola, R-CHP-Pola, and the combination of glofitamab plus R-CHOP did not lead to an increase in T-cell counts in the peripheral blood or tumors (Figure 1F, right). These findings were confirmed in the OCI-Ly18 model (supplemental Figure 3), where we again observed no additional antitumor efficacy with the combination of glofitamab and R-CHOP, in contrast to R-CHP-Pola combination, which resulted in robust antitumor activity. Moreover, the combination of glofitamab and R-CHOP was associated with a trend toward decreased T-cell infiltration and reduced granzyme B expression in intratumoral T cells compared with glofitamab monotherapy. However, ex vivo analysis at later time point revealed that the combination of glofitamab and R-CHOP resulted in increased intratumoral T-cell numbers and activation compared with the respective monotherapy groups (supplemental Figure 4). This difference may be explained by the timing of sample collection.
Evaluation of the combinatorial effect of glofitamab with R-CHOP and R-CHP-Pola. (A) Experimental design of an in vivo efficacy study. Humanized BRGS-CD47 mice with SC SU-DHL-8 tumors were allocated to 7 experimental groups (14 mice per group) and were treated with either vehicle (histidine buffer), Pola (1 mg/kg), step-up dosing (SUD) of glofitamab (0.15-0.5 mg/kg), R-CHOP (rituximab 30 mg/kg, cyclophosphamide 30 mg/kg, doxorubicin 2.5 mg/kg, vincristine 0.375 mg/kg, methylprednisolone 0.12 mg/kg), R-CHP-Pola (rituximab 30 mg/kg, cyclophosphamide 30 mg/kg, doxorubicin 2.5 mg/kg, methylprednisolone 0.12 mg/kg, Pola 1 mg/kg), or a combination of glofitamab with either staggered R-CHOP or R-CHP-Pola using the same dosing as in monotherapy groups. Treatments were administered IV according to the displayed timeline. Methylprednisolone (P) was injected IV on 3 consecutive days during each cycle of R-CHOP or R-CHP-Pola treatment. Four scout animals per group were taken on day 17 for ex vivo analysis, and the study was terminated on day 31. (B) Representative immunohistochemistry (IHC) staining for human CD19, CD20, CD79b, and CD3 in untreated SU-DHL-8 tumors. (C) Average tumor volumes are illustrated as mean + SEM for all treatment groups over time. Tumor-free mice are indicated as x/10. (D) Time-to-event analysis for all treatment groups, with a cutoff at a tumor volume of 1000 mm3. Median survival values are presented as days after tumor cell injection. (E) Body weight kinetics are illustrated as mean + SEM. (F) Analysis of normalized B-cell frequencies in the blood and spleen and T-cell frequencies in the blood and tumors, assessed via flow cytometry on study day 17. Bars represent the mean + SEM, and individual dots represent values from individual mice. Statistical analysis was performed using 1-way analysis of variance (ANOVA), and significant P values are indicated as follows: ∗P < .05; ∗∗P < .01; ∗∗∗P < .001; ∗∗∗∗P < .0001. SC, subcutaneous; SEM, standard error of the mean.
Evaluation of the combinatorial effect of glofitamab with R-CHOP and R-CHP-Pola. (A) Experimental design of an in vivo efficacy study. Humanized BRGS-CD47 mice with SC SU-DHL-8 tumors were allocated to 7 experimental groups (14 mice per group) and were treated with either vehicle (histidine buffer), Pola (1 mg/kg), step-up dosing (SUD) of glofitamab (0.15-0.5 mg/kg), R-CHOP (rituximab 30 mg/kg, cyclophosphamide 30 mg/kg, doxorubicin 2.5 mg/kg, vincristine 0.375 mg/kg, methylprednisolone 0.12 mg/kg), R-CHP-Pola (rituximab 30 mg/kg, cyclophosphamide 30 mg/kg, doxorubicin 2.5 mg/kg, methylprednisolone 0.12 mg/kg, Pola 1 mg/kg), or a combination of glofitamab with either staggered R-CHOP or R-CHP-Pola using the same dosing as in monotherapy groups. Treatments were administered IV according to the displayed timeline. Methylprednisolone (P) was injected IV on 3 consecutive days during each cycle of R-CHOP or R-CHP-Pola treatment. Four scout animals per group were taken on day 17 for ex vivo analysis, and the study was terminated on day 31. (B) Representative immunohistochemistry (IHC) staining for human CD19, CD20, CD79b, and CD3 in untreated SU-DHL-8 tumors. (C) Average tumor volumes are illustrated as mean + SEM for all treatment groups over time. Tumor-free mice are indicated as x/10. (D) Time-to-event analysis for all treatment groups, with a cutoff at a tumor volume of 1000 mm3. Median survival values are presented as days after tumor cell injection. (E) Body weight kinetics are illustrated as mean + SEM. (F) Analysis of normalized B-cell frequencies in the blood and spleen and T-cell frequencies in the blood and tumors, assessed via flow cytometry on study day 17. Bars represent the mean + SEM, and individual dots represent values from individual mice. Statistical analysis was performed using 1-way analysis of variance (ANOVA), and significant P values are indicated as follows: ∗P < .05; ∗∗P < .01; ∗∗∗P < .001; ∗∗∗∗P < .0001. SC, subcutaneous; SEM, standard error of the mean.
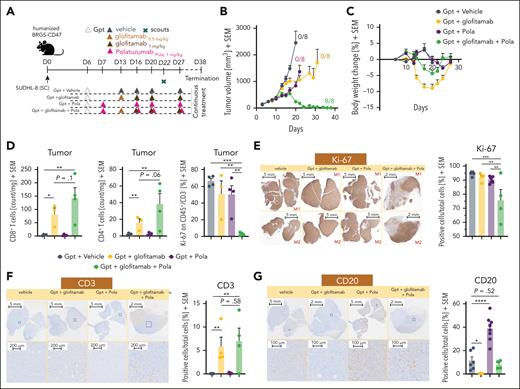
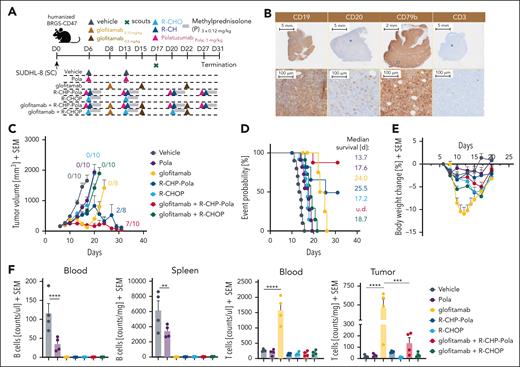
Pola enhances the antitumor efficacy of glofitamab through modulation of CD20 expression. (A) Experimental design of the in vivo efficacy study. Humanized BRGS-CD47 mice with SC SU-DHL-8 tumors were randomized into 5 groups (12 mice each). Mice were treated with either vehicle (histidine buffer), SUD of glofitamab (0.5-1 mg/kg), Pola (1 mg/kg), or glofitamab in combination with Pola (1 mg/kg) using the same dosing as in monotherapy groups. All treatments were administered IV according to the displayed schedule. All groups received Gpt (30 mg/kg). Four scout animals per group were taken on day 22 for ex vivo analysis, and the study was terminated at day 38. (B) Average tumor volumes are illustrated as mean + SEM for all treatment groups over time. Tumor-free mice are indicated as x/8. (C) Body weight kinetics are illustrated as mean + SEM in all groups. (D) Ex vivo flow cytometry analysis of tumors from scout animals reveals normalized CD8+ and CD4+ T-cell counts and the frequency of Ki-67+ cells in the CD45+/CD3− population. (E) Representative IHC staining for Ki-67 in 2 individual tumors at scout time point is shown for all groups (left). Images were captured using a VS120 Virtual Slide Microscope (Olympus). Quantification of Ki-67+ cells per total cells is illustrated (right), using Tissue Studio software (Definiens) for cell quantification. Bars represent means + SEM, and dots indicate individual mouse values. (F-G) Representative human CD3 and CD20 IHC staining of representative tumors at the scout time point is found for all groups. Upper row, lower magnification; lower row, higher magnification. Images were captured using a VS120 Virtual Slide Microscope (Olympus). Quantification of CD3+ or CD20+ cells per total cells is shown (right in panels F-G), using Tissue Studio software (Definiens) for cell quantification. Bars represent means + SEM, and dots indicate individual mouse values. Statistical analysis was performed using 1-way ANOVA, and significant P values are indicated as follows: ∗P < .05; ∗∗P < .01; ∗∗∗P < .001; ∗∗∗∗P < .0001. Gpt, Gazyva pretreatment; M1, mouse 1; M2, mouse 2.
Pola enhances the antitumor efficacy of glofitamab through modulation of CD20 expression. (A) Experimental design of the in vivo efficacy study. Humanized BRGS-CD47 mice with SC SU-DHL-8 tumors were randomized into 5 groups (12 mice each). Mice were treated with either vehicle (histidine buffer), SUD of glofitamab (0.5-1 mg/kg), Pola (1 mg/kg), or glofitamab in combination with Pola (1 mg/kg) using the same dosing as in monotherapy groups. All treatments were administered IV according to the displayed schedule. All groups received Gpt (30 mg/kg). Four scout animals per group were taken on day 22 for ex vivo analysis, and the study was terminated at day 38. (B) Average tumor volumes are illustrated as mean + SEM for all treatment groups over time. Tumor-free mice are indicated as x/8. (C) Body weight kinetics are illustrated as mean + SEM in all groups. (D) Ex vivo flow cytometry analysis of tumors from scout animals reveals normalized CD8+ and CD4+ T-cell counts and the frequency of Ki-67+ cells in the CD45+/CD3− population. (E) Representative IHC staining for Ki-67 in 2 individual tumors at scout time point is shown for all groups (left). Images were captured using a VS120 Virtual Slide Microscope (Olympus). Quantification of Ki-67+ cells per total cells is illustrated (right), using Tissue Studio software (Definiens) for cell quantification. Bars represent means + SEM, and dots indicate individual mouse values. (F-G) Representative human CD3 and CD20 IHC staining of representative tumors at the scout time point is found for all groups. Upper row, lower magnification; lower row, higher magnification. Images were captured using a VS120 Virtual Slide Microscope (Olympus). Quantification of CD3+ or CD20+ cells per total cells is shown (right in panels F-G), using Tissue Studio software (Definiens) for cell quantification. Bars represent means + SEM, and dots indicate individual mouse values. Statistical analysis was performed using 1-way ANOVA, and significant P values are indicated as follows: ∗P < .05; ∗∗P < .01; ∗∗∗P < .001; ∗∗∗∗P < .0001. Gpt, Gazyva pretreatment; M1, mouse 1; M2, mouse 2.
Pola enhances the antitumor efficacy of glofitamab through modulation of CD20 expression
We further evaluated the therapeutic efficacy of combining glofitamab with Pola (Figure 2), to explore the synergistic potential of combining a TCE-mediated T-cell cytotoxicity (mediated by glofitamab) with direct cancer cell killing (mediated by the Pola). SU-DHL-8–bearing humanized BRGS47 mice were treated with either glofitamab or Pola monotherapy or the combination of the 2 mimicking the corresponding clinical treatment schedule (www.ClinicalTrials.gov identifier: NCT03533283; Figure 2A). Neither glofitamab nor Pola monotherapy treatment led to tumor regression or to tumor-free mice at study termination (Figure 2B). However, the combination of glofitamab with Pola led to rapid tumor shrinkage, achieving 100% tumor-free mice by the end of the study (Figure 2B). In addition, this combination demonstrated greater tolerability compared with glofitamab monotherapy, as indicated by a smaller transient reduction of body weight (Figure 2C). This enhanced tolerability is likely due to the additional normal and tumor B-cell debulking activity of Pola before the first glofitamab infusion (Figure 2C). Ex vivo flow cytometry analysis of tumors collected on day 22 revealed a trend toward higher intratumor infiltration of both CD8+ and CD4+ T cells in the combination group compared with glofitamab monotherapy (Figure 2D), paralleled by a remarkable reduction of proliferation of malignant cells (Figure 2D, Ki67+ CD45+ CD3− fraction). The reduced tumor cell proliferation and the increased intratumor T-cell infiltration after the combination treatment were further confirmed by immunohistochemistry (Figure 2E-F). Importantly, treatment with Pola resulted in a more abundant CD20 expression (Figure 2G, left) with an increase in both CD20 optical density (supplemental Figure 5A) and in the overall CD20+ tumor area (Figure 2G, right) whereas CD79b expression seems unchanged at termination (supplemental Figure 5C). This increased CD20 expression may explain the synergistic antitumor activity observed in the combination of glofitamab with Pola. By increasing the proportion of CD20-expressing tumor cells, Pola facilitates increased glofitamab-mediated cytotoxicity and greater tumor cell killing.
The combination of glofitamab with GemOx translates into strong antitumor efficacy and boosts intratumoral T-cell infiltration, activation, and proliferation
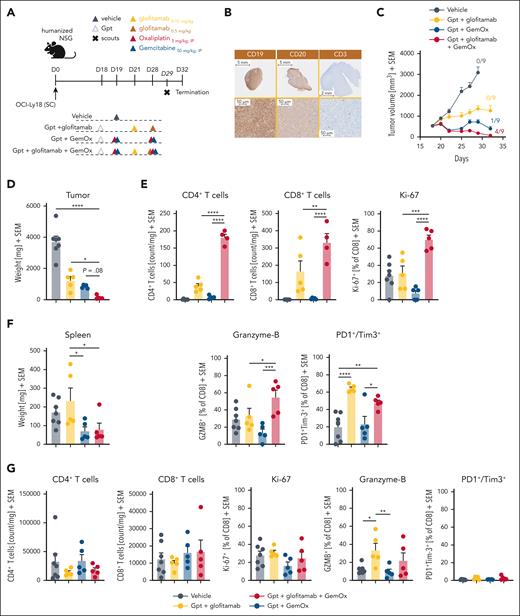
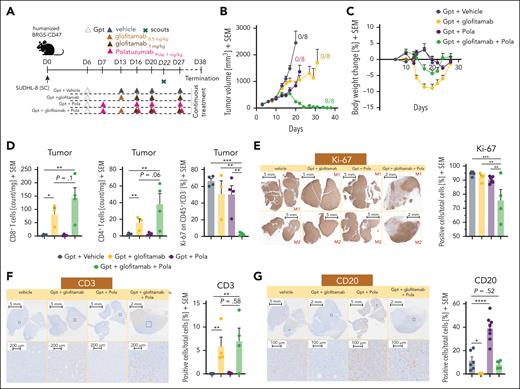
Next, we evaluated the combination efficacy and underlying synergistic mode of action of glofitamab with GemOx in OCI-Ly18–bearing humanized mice (Figure 3). Dose and schedule recapitulate as closely as possible the respective clinical trial design (www.ClinicalTrials.gov identifier: NCT04408638; Figure 3A). The OCI-Ly18 tumor model is associated with medium-high and homogenous CD20 expression (high CD20 H-score of 207; supplemental Figure 1B) and a high CD19 expression, with very low intratumor T-cell infiltration at baseline (Figure 3B). Glofitamab monotherapy demonstrated moderate TGI at the selected dose (Figure 3C). In contrast, treatment with GemOx exhibited more pronounced TGI, resulting in 1 of 9 mice being tumor free at study termination (Figure 3C). Notably, the combination of glofitamab with GemOx led to a more rapid onset of tumor regression, significantly lower tumor volumes at day 27 (supplemental Figure 6) and to a greater number of tumor-free mice (4/9) and reduced tumor weight compared with the other treatment groups by the end of the study (Figure 3C-D). Interestingly, flow cytometry analysis of tumors collected on study day 29 revealed a significantly higher frequency of intratumor CD4+ and CD8+ T cells in the combination group compared with each single agent arm. In addition, an enhanced proliferation and cytotoxic phenotype of intratumor CD8+ T cells, as demonstrated by increased expression of Ki-67 and granzyme B (Figure 3E), was found. The assessment of PD1+/Tim3+ double-positive intratumor CD8+ T cells (putatively exhausted T cells) revealed lower expression levels in the combination group. This suggests a potentially improved fitness of intratumor T cells compared with glofitamab monotherapy (Figure 3E). The assessment of spleen weight at study termination revealed lower weight in groups receiving chemotherapy. However, T-cell numbers and T-cell activation/exhaustion markers in the spleen did not reveal major differences among the treatment groups (Figure 3F-G).
The combination of glofitamab with GemOx translates into strong antitumor efficacy and boosts intratumoral T-cell infiltration, activation, and proliferation. (A) In vivo efficacy study design. Humanized NSG mice with SC OCI-Ly18 tumors were randomized into 4 different experimental groups (14 per group) and were treated with either a vehicle (histidine buffer), SUD of glofitamab (0.15-0.5 mg/kg), GemOx (50/5 mg/kg), or a combination of glofitamab with GemOx, staggered in the first cycle and concomitant in the second using the same dosing as in monotherapy groups. Glofitamab treatments were administered IV and GemOx IP according to the displayed timeline. Five (7 in vehicle) animals per group were taken on day 29, and the study terminated on day 32. (B) Representative IHC staining for human CD19, CD20, and CD3 in untreated OCI-Ly18 tumors. (C) Average tumor volumes are presented as mean + SEM for all treatment groups over time. Tumor-free mice are indicated as x/9. (D) Tumor weights at the scout time point are found as mean + SEM values, with individual data points representing single mice. (E) Ex vivo flow cytometry analysis on tumors from scout animals reveals normalized CD4+ and CD8+ T-cell counts and CD8+ T-cell activation and exhaustion status (from left: Ki-67, granzyme B, PD1+/Tim3+ cells in percentage). (F) Spleen weights at the scout time point are found as mean + SEM values, with individual data points representing single mice. (G) Ex vivo flow cytometry analysis on spleen samples from scout animals reveals normalized CD4+ and CD8+ T-cell counts and CD8+ T-cell activation and exhaustion status (from left: Ki-67, granzyme B, and PD1+/Tim3+ cells in percentage). Bars represent means, and dots indicate individual mouse values. Statistical analysis was performed using 1-way ANOVA, and significant P values are indicated as follows: ∗P < .05; ∗∗P < .01; ∗∗∗P < .001; ∗∗∗∗P < .0001. IP, intraperitoneal.
The combination of glofitamab with GemOx translates into strong antitumor efficacy and boosts intratumoral T-cell infiltration, activation, and proliferation. (A) In vivo efficacy study design. Humanized NSG mice with SC OCI-Ly18 tumors were randomized into 4 different experimental groups (14 per group) and were treated with either a vehicle (histidine buffer), SUD of glofitamab (0.15-0.5 mg/kg), GemOx (50/5 mg/kg), or a combination of glofitamab with GemOx, staggered in the first cycle and concomitant in the second using the same dosing as in monotherapy groups. Glofitamab treatments were administered IV and GemOx IP according to the displayed timeline. Five (7 in vehicle) animals per group were taken on day 29, and the study terminated on day 32. (B) Representative IHC staining for human CD19, CD20, and CD3 in untreated OCI-Ly18 tumors. (C) Average tumor volumes are presented as mean + SEM for all treatment groups over time. Tumor-free mice are indicated as x/9. (D) Tumor weights at the scout time point are found as mean + SEM values, with individual data points representing single mice. (E) Ex vivo flow cytometry analysis on tumors from scout animals reveals normalized CD4+ and CD8+ T-cell counts and CD8+ T-cell activation and exhaustion status (from left: Ki-67, granzyme B, PD1+/Tim3+ cells in percentage). (F) Spleen weights at the scout time point are found as mean + SEM values, with individual data points representing single mice. (G) Ex vivo flow cytometry analysis on spleen samples from scout animals reveals normalized CD4+ and CD8+ T-cell counts and CD8+ T-cell activation and exhaustion status (from left: Ki-67, granzyme B, and PD1+/Tim3+ cells in percentage). Bars represent means, and dots indicate individual mouse values. Statistical analysis was performed using 1-way ANOVA, and significant P values are indicated as follows: ∗P < .05; ∗∗P < .01; ∗∗∗P < .001; ∗∗∗∗P < .0001. IP, intraperitoneal.
Translational investigation of patient T cells treated with glofitamab plus chemotherapy regimens indicates sustained T-cell functionality over prolonged treatment cycles
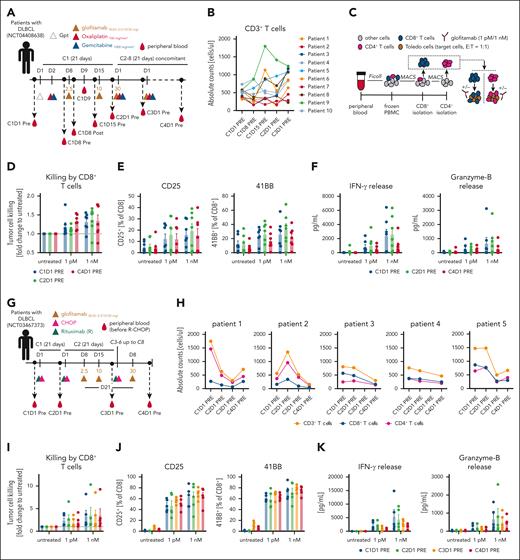
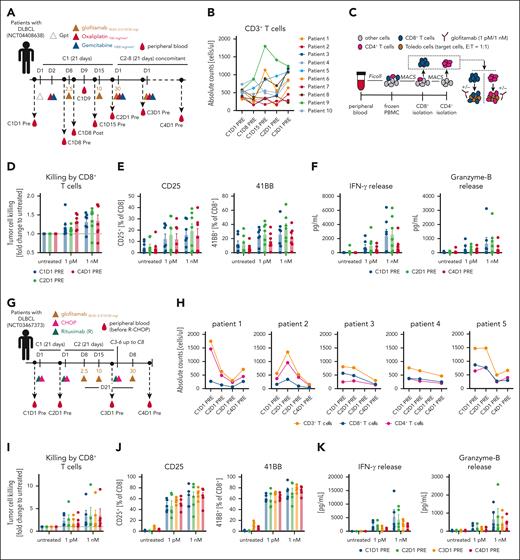
In the glofitamab plus GemOx trial (www.ClinicalTrials.gov identifier: NCT04408638; STARGLO; Figure 4A), blood samples were collected from patients at specified time points to evaluate T-cell kinetics, activation, and functionality over treatment cycles. During the first treatment cycle of glofitamab, an acute and transient T-cell margination, defined by a temporary reduction in CD4+ and CD8+ T-cell counts, was observed (supplemental Figure 7B, left). Longer term T-cell activation, occurring after step-up dosing of glofitamab, was marked by a gradual increase in the proportion of HLA-DR+ circulating CD8+ and CD4+ T cells (supplemental Figure 7B, right). Despite the transient T-cell margination, the number of CD3+ T cells in the peripheral blood returned to pretreatment levels and subsequently remained stable between the first 2 treatment cycles (Figure 4B). Interestingly, data generated with glofitamab in humanized mice revealed a comparable pattern of T-cell kinetics and late activation as observed in patients, underscoring the translational relevance of this mouse model (supplemental Figure 7C-D). To enable ex vivo functional assessment of patient T cells, CD8+ and CD4+ T cells were isolated from peripheral blood mononuclear cells obtained from patients treated with glofitamab plus GemOx (Figure 4C). The ex vivo functional assessment demonstrated that CD8+ T cells maintained functional activity across several treatment cycles. This was evidenced by glofitamab-mediated and dose-dependent ex vivo tumor cell killing (Figure 4D), T-cell activation (indicated by upregulation of CD25 and 4-1BB) (Figure 4E), and increased interferon gamma and granzyme B secretion (Figure 4F). These findings were also confirmed for CD4+ T cells (supplemental Figure 8). The assessment of T-cell kinetics and functionality was also performed using peripheral blood mononuclear cell derived from patients treated with glofitamab plus R-CHOP (NCT03467373, SKYGLO trial; Figure 4G). The analysis of T-cell counts (CD4+, CD8+, and total T cells) revealed a decline over treatment cycles indicating a R-CHOP–mediated lymphopenia (Figure 4H), similar to what was observed in humanized mice (supplemental Figure 4C). Despite lymphopenia, the ex vivo functional assessment of the remaining peripheral T cells revealed that both CD8+ and CD4+ T-cell subsets maintained functional activity during several treatment cycles, as demonstrated by glofitamab-mediated and dose-dependent ex vivo tumor cell killing (Figure 4I), T-cell activation (indicated by upregulation of CD25 and 4-1BB; Figure 4J), and increased interferon gamma and granzyme B secretion in the supernatant (Figure 4K). Similar findings were observed using CD4+ T cells (supplemental Figure 9).
Translational investigation of patient T cells treated with glofitamab plus chemotherapy regimens indicates sustained T-cell functionality over prolonged treatment cycles. (A) Clinical trial design for the glofitamab plus GemOx combination (NCT04408638) outlines the treatment schedule and blood sampling time points. (B) Absolute CD3+ T-cell counts in 10 treated patients over time. (C) Experimental design of the ex vivo T-cell assay from patient blood. T cells were isolated as displayed, including glofitamab-mediated tumor cell killing. Glofitamab was used at 1 pM and 1 nM concentration. (D) Glofitamab-mediated tumor cell killing assay using isolated patient CD8+ T cells is assessed. Mean values ± SEM are displayed, with each dot representing an individual patient. (E) Flow cytometry analysis for CD25 and 4-1BB expression on CD8+ T cells after a 24-hour ex vivo killing assay. (F) Cytokine analysis in the supernatant at the 24-hour end point. (G) Design of the clinical trial for the glofitamab plus R-CHOP combination (NCT03467373), indicating the treatment schedule and blood sampling time points. (H) Absolute CD3+, CD8+, and CD4+ T-cell counts in 5 treated patients over time. (I) Glofitamab-mediated tumor cell killing assay using the same experimental setup as in C. (J) Flow cytometry analysis for CD25 and 41BB expression on CD8+ T cells after a 24-hour ex vivo killing assay. (K) Cytokine analysis in the supernatant at the 24-hour end point. C1D1, cycle 1 day 1; E:T, effector to target; IFN-γ, interferon gamma; PBMC, peripheral blood mononuclear cell; Post, after infusion; Pre, before infusion.
Translational investigation of patient T cells treated with glofitamab plus chemotherapy regimens indicates sustained T-cell functionality over prolonged treatment cycles. (A) Clinical trial design for the glofitamab plus GemOx combination (NCT04408638) outlines the treatment schedule and blood sampling time points. (B) Absolute CD3+ T-cell counts in 10 treated patients over time. (C) Experimental design of the ex vivo T-cell assay from patient blood. T cells were isolated as displayed, including glofitamab-mediated tumor cell killing. Glofitamab was used at 1 pM and 1 nM concentration. (D) Glofitamab-mediated tumor cell killing assay using isolated patient CD8+ T cells is assessed. Mean values ± SEM are displayed, with each dot representing an individual patient. (E) Flow cytometry analysis for CD25 and 4-1BB expression on CD8+ T cells after a 24-hour ex vivo killing assay. (F) Cytokine analysis in the supernatant at the 24-hour end point. (G) Design of the clinical trial for the glofitamab plus R-CHOP combination (NCT03467373), indicating the treatment schedule and blood sampling time points. (H) Absolute CD3+, CD8+, and CD4+ T-cell counts in 5 treated patients over time. (I) Glofitamab-mediated tumor cell killing assay using the same experimental setup as in C. (J) Flow cytometry analysis for CD25 and 41BB expression on CD8+ T cells after a 24-hour ex vivo killing assay. (K) Cytokine analysis in the supernatant at the 24-hour end point. C1D1, cycle 1 day 1; E:T, effector to target; IFN-γ, interferon gamma; PBMC, peripheral blood mononuclear cell; Post, after infusion; Pre, before infusion.
The level and heterogeneity of tumor antigen expression shape combination therapy outcome
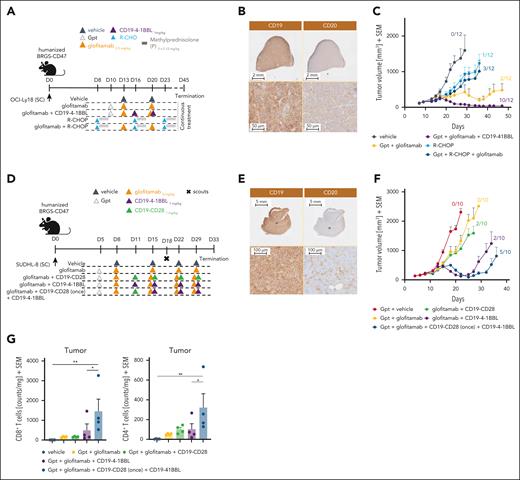
T-cell costimulation plays a fundamental role in sustaining T-cell functionality and improving the responses of both TCE and chimeric antigen receptor T-cell therapies.30,31 We evaluated the benefit of providing T-cell costimulation by combining glofitamab with a CD19-targeted 4-1BBL (CD19–4-1BBL; englumafusp alfa20) in humanized mice using 2 different DLBCL lymphoma models expressing different levels of CD20 antigen. The OCI-Ly18 model (Figure 5A-C), characterized by a homogeneous and medium/high CD20 expression level (Figure 5B; high CD20 H-score of 207), and the SU-DH-L8 tumor model (Figure 5D-G), characterized by a heterogeneous and low/medium CD20 expression level (Figure 5E; low CD20 H-score of 62). Both models are characterized by a homogenous and high CD19 expression (Figure 5B,E). The TGI mediated by glofitamab in the OCI-Ly18 model translated into an initial tumor regression followed by tumor relapse with only 2 of 12 tumor-free animals at study termination. The addition of CD19–4-1BBL deepens and prolongs the efficacy of glofitamab resulting in faster tumor regression, longer response, and increased number of tumor-free animals (10/12; Figure 5C). Interestingly, in this particular model, the combination of glofitamab with CD19–4-1BBL resulted in superior antitumor efficacy as compared with the combination with R-CHOP chemotherapy (Figure 5C), which was overall poorly active under the tested conditions. In the SU-DHL-8 model, glofitamab treatment demonstrated limited antitumor efficacy and did not prevent tumor outgrowth with no mice being tumor free at study termination (Figure 5F). The combination with CD19–4-1BBL initially deepened glofitamab-mediated antitumor responses leading to 2 of 10 tumor-free animals and prolonged the time to tumor escape, but it was unable to completely prevent tumor relapse (Figure 5F). The addition of a second costimulator, CD19-CD28 agonist,21 administered for 1 cycle before the subsequent combination with the CD19–4-1BBL, further strengthened the antitumor efficacy leading to 5 of 10 tumor-free animals, but again did not completely prevent tumor relapse (Figure 5F). The analysis of intratumor CD8+ and CD4+ T-cell counts at day 18 was in line with the antitumor efficacy results, revealing the greatest increase in T-cell counts in the triple combination group (Figure 5G). Immunohistochemistry analysis of CD20 at termination revealed stable CD20 expression in the OCI-Ly18 model after glofitamab treatment, whereas complete loss of CD20 was observed in the SU-DHL-8 model (supplemental Figure 10).
The level and heterogeneity of tumor antigen expression shape combination therapy outcome. (A) In vivo efficacy study design. Humanized BRGS-CD47 mice with SC OCI-Ly18 tumors were randomized into 5 groups (12 mice each) and treated with either vehicle (histidine buffer), glofitamab (0.5 mg/kg), R-CHOP (rituximab 30 mg/kg, cyclophosphamide 30 mg/kg, doxorubicin 2.5 mg/kg, vincristine 0.375 mg/kg, methylprednisolone 0.12 mg/kg), or glofitamab in combination with either R-CHOP (staggered) or CD19–4-1BBL (1 mg/kg) as per the administration scheme. Methylprednisolone was given IV for 3 consecutive days during each cycle of treatment. All treatments were administered IV according to the displayed schedule. Glofitamab monotherapy and its combination with CD19–4-1BBL received Gpt (30 mg/kg). The study was terminated on day 45 after continuous weekly treatment. (B) Representative IHC staining of untreated OCI-Ly18 tumors for CD19 and CD20. Upper row, lower magnification; lower row, higher magnification. Images were captured using a VS120 Virtual Slide Microscope (Olympus). (C) Average tumor volumes are presented as means + SEM for all treatment groups over time. Tumor-free mice are indicated as x/12. (D) Experimental design of the in vivo efficacy study. Humanized BRGS-CD47 mice with SC SU-DHL-8 tumors were randomized into 5 groups (14 mice each). Mice were treated with either vehicle (histidine buffer), glofitamab (2 mg/kg), or glofitamab in combination with CD19–4-1BBL (1 mg/kg) or CD19-CD28 (1 mg/kg). An additional combination group received a single treatment with CD19-CD28 followed by continuous treatment with CD19–4-1BBL in combination with glofitamab, as per the administration scheme. All treatments were administered IV according to the displayed schedule. All groups received Gpt (30 mg/kg). Four scout animals per group were taken at day 18. (E) Representative IHC staining of untreated SU-DHL-8 tumors for CD19 and CD20. Upper row, lower magnification; lower row, higher magnification. Images were captured using a VS120 Virtual Slide Microscope (Olympus). (F) Average tumor volumes are illustrated as means + SEM for all treatment groups over time. Tumor-free mice are indicated as x/10. (G) Ex vivo flow cytometry analysis of tumors from scout animals reveals normalized CD8+ and CD4+ T-cell counts in all groups. Statistical analysis was performed using 1-way ANOVA, and significant P values are indicated as follows: ∗P < .05; ∗∗P < .01; ∗∗∗P < .001; ∗∗∗∗P < .0001.
The level and heterogeneity of tumor antigen expression shape combination therapy outcome. (A) In vivo efficacy study design. Humanized BRGS-CD47 mice with SC OCI-Ly18 tumors were randomized into 5 groups (12 mice each) and treated with either vehicle (histidine buffer), glofitamab (0.5 mg/kg), R-CHOP (rituximab 30 mg/kg, cyclophosphamide 30 mg/kg, doxorubicin 2.5 mg/kg, vincristine 0.375 mg/kg, methylprednisolone 0.12 mg/kg), or glofitamab in combination with either R-CHOP (staggered) or CD19–4-1BBL (1 mg/kg) as per the administration scheme. Methylprednisolone was given IV for 3 consecutive days during each cycle of treatment. All treatments were administered IV according to the displayed schedule. Glofitamab monotherapy and its combination with CD19–4-1BBL received Gpt (30 mg/kg). The study was terminated on day 45 after continuous weekly treatment. (B) Representative IHC staining of untreated OCI-Ly18 tumors for CD19 and CD20. Upper row, lower magnification; lower row, higher magnification. Images were captured using a VS120 Virtual Slide Microscope (Olympus). (C) Average tumor volumes are presented as means + SEM for all treatment groups over time. Tumor-free mice are indicated as x/12. (D) Experimental design of the in vivo efficacy study. Humanized BRGS-CD47 mice with SC SU-DHL-8 tumors were randomized into 5 groups (14 mice each). Mice were treated with either vehicle (histidine buffer), glofitamab (2 mg/kg), or glofitamab in combination with CD19–4-1BBL (1 mg/kg) or CD19-CD28 (1 mg/kg). An additional combination group received a single treatment with CD19-CD28 followed by continuous treatment with CD19–4-1BBL in combination with glofitamab, as per the administration scheme. All treatments were administered IV according to the displayed schedule. All groups received Gpt (30 mg/kg). Four scout animals per group were taken at day 18. (E) Representative IHC staining of untreated SU-DHL-8 tumors for CD19 and CD20. Upper row, lower magnification; lower row, higher magnification. Images were captured using a VS120 Virtual Slide Microscope (Olympus). (F) Average tumor volumes are illustrated as means + SEM for all treatment groups over time. Tumor-free mice are indicated as x/10. (G) Ex vivo flow cytometry analysis of tumors from scout animals reveals normalized CD8+ and CD4+ T-cell counts in all groups. Statistical analysis was performed using 1-way ANOVA, and significant P values are indicated as follows: ∗P < .05; ∗∗P < .01; ∗∗∗P < .001; ∗∗∗∗P < .0001.
Exploring and evaluating novel chemotherapy-free combination partners
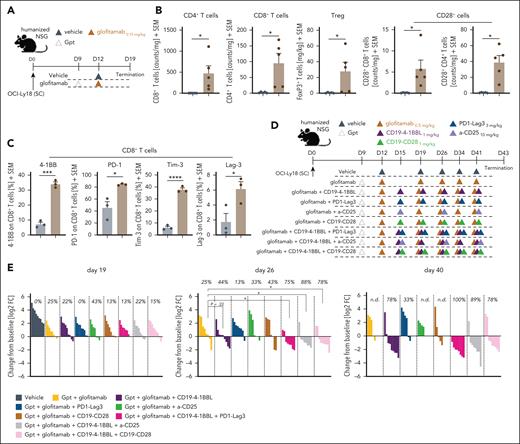
Last, we undertook a mechanistic approach based on the mode of action of glofitamab to identify additional promising chemotherapy-free combination opportunities (Figure 6). Glofitamab treatment (Figure 6A) resulted in a significant increase of intratumor CD4+ and CD8+ T cells with a proportion of these expressing CD28. This was alongside the upregulation of activation and exhaustion markers such as 4-1BB, PD-1, Tim-3, and Lag-3 (Figure 6B-C). In addition, we observed increased intratumor Treg numbers after glofitamab treatment (Figure 6B, middle). These changes in the tumor microenvironment suggest the potential to explore novel immunotherapy combinations.
Exploring and evaluating novel chemotherapy-free combination partners. (A) Experimental design of the in vivo pharmacodynamic (PD) study in humanized NSG mice bearing subcutaneous OCI-Ly18 tumors. The mice were divided into 2 experimental groups, each consisting of 8 mice. One group received a vehicle control (histidine buffer), whereas the other was treated with Gpt (30 mg/kg) followed by glofitamab (0.15 mg/kg). The compounds were administered IV after the displayed timeline, and the study concluded on day 19. (B) Ex vivo flow cytometry analysis was conducted on the tumors at study termination. Normalized counts of CD4+ and CD8+ T cells, Treg counts, and the frequency of CD28+ CD4+ or CD8+ intratumoral T cells are illustrated. In addition, phenotypic analysis of CD8+ T cells was performed, assessing 4-1BB, PD-1, TIM-3, and LAG-3 (from left to right) expression. Bars illustrate means + SEM, and dots indicate values of individual mice. Statistical analysis was performed using unpaired t test, and significant P values are indicated as follows: ∗P < .05; ∗∗P < .01; ∗∗∗P < .001; ∗∗∗∗P < .0001. (C) Experimental design of the in vivo combination efficacy study. (D) Humanized NSG mice with subcutaneous OCI-Ly18 tumors were allocated to 9 experimental groups (10 mice per group) and were treated with vehicle (histidine buffer), glofitamab monotherapy (0.5 mg/kg), or combination treatments with either CD19–4-1BBL (1 mg/kg), CD19-CD28 (1 mg/kg), α-CD25 (10 mg/kg), or PD1-Lag3 (3 mg/kg). Triple combinations of glofitamab + CD19–4-1BBL with either PD1-LAG3, α-CD25, or CD19-CD28 were evaluated. All groups received Gpt (30 mg/kg) on study day 9. Compounds were administered IV according to the displayed timeline, and the study was terminated on day 43. (E) Waterfall plots for day 19 (left), day 26 (middle), and day 40 (right) illustrate individual tumor sizes normalized to the tumor volume of each mouse at the start of treatment on day 9. Positive values indicate tumor growth, whereas negative values indicate regression. Each bar represents an individual mouse at the respective time points, with colors indicating different treatments. The indicated values represent the percentage of mice revealing tumor regression at each time point. Statistical analysis was performed using 1-way ANOVA, and significant P values are indicated as follows: ∗P < .05; ∗∗P < .01; ∗∗∗P < .001; ∗∗∗∗P < .0001. FC, fold change; n.d., not determined.
Exploring and evaluating novel chemotherapy-free combination partners. (A) Experimental design of the in vivo pharmacodynamic (PD) study in humanized NSG mice bearing subcutaneous OCI-Ly18 tumors. The mice were divided into 2 experimental groups, each consisting of 8 mice. One group received a vehicle control (histidine buffer), whereas the other was treated with Gpt (30 mg/kg) followed by glofitamab (0.15 mg/kg). The compounds were administered IV after the displayed timeline, and the study concluded on day 19. (B) Ex vivo flow cytometry analysis was conducted on the tumors at study termination. Normalized counts of CD4+ and CD8+ T cells, Treg counts, and the frequency of CD28+ CD4+ or CD8+ intratumoral T cells are illustrated. In addition, phenotypic analysis of CD8+ T cells was performed, assessing 4-1BB, PD-1, TIM-3, and LAG-3 (from left to right) expression. Bars illustrate means + SEM, and dots indicate values of individual mice. Statistical analysis was performed using unpaired t test, and significant P values are indicated as follows: ∗P < .05; ∗∗P < .01; ∗∗∗P < .001; ∗∗∗∗P < .0001. (C) Experimental design of the in vivo combination efficacy study. (D) Humanized NSG mice with subcutaneous OCI-Ly18 tumors were allocated to 9 experimental groups (10 mice per group) and were treated with vehicle (histidine buffer), glofitamab monotherapy (0.5 mg/kg), or combination treatments with either CD19–4-1BBL (1 mg/kg), CD19-CD28 (1 mg/kg), α-CD25 (10 mg/kg), or PD1-Lag3 (3 mg/kg). Triple combinations of glofitamab + CD19–4-1BBL with either PD1-LAG3, α-CD25, or CD19-CD28 were evaluated. All groups received Gpt (30 mg/kg) on study day 9. Compounds were administered IV according to the displayed timeline, and the study was terminated on day 43. (E) Waterfall plots for day 19 (left), day 26 (middle), and day 40 (right) illustrate individual tumor sizes normalized to the tumor volume of each mouse at the start of treatment on day 9. Positive values indicate tumor growth, whereas negative values indicate regression. Each bar represents an individual mouse at the respective time points, with colors indicating different treatments. The indicated values represent the percentage of mice revealing tumor regression at each time point. Statistical analysis was performed using 1-way ANOVA, and significant P values are indicated as follows: ∗P < .05; ∗∗P < .01; ∗∗∗P < .001; ∗∗∗∗P < .0001. FC, fold change; n.d., not determined.
We, therefore, tested the potential of the combination of glofitamab with anti–PD-1-Lag3 dual checkpoint inhibitor (tobestomig), with a Treg-depleting antibody (α-CD25), and explored the potential of triple combinations using the glofitamab + CD19–4-1BBL as backbone therapy in humanized mice (Figure 6D). Early response assessment on day 19 did not reveal major differences among the treatment groups (Figure 6E, left). The assessment of tumors being in regression on day 26 started to reveal the potential of stronger antitumor efficacy of triple combinations of glofitamab + CD19–4-1BBL + α-CD25 (87%), glofitamab + CD19–4-1BBL + CD19-CD28 (78%), and glofitamab + CD19–4-1BBL + PD1-Lag3 (75%; Figure 6E, middle). The analysis at a later time point day 40 confirmed the efficacy of the triple combination of glofitamab + CD19–4-1BBL+ PD1-Lag3 (100% mice in regression), along with glofitamab + CD19–4-1BBL + α-CD25 (89%), and highlighted the efficacy of the doublet of glofitamab + CD19–4-1BBL (78%; Figure 6E, right).
Discussion
This study provides a comprehensive evaluation of glofitamab-based combination strategies in preclinical humanized lymphoma mouse models, offering critical insights into optimizing therapeutic efficacy through tailored and mode of action–driven approaches.
In humanized mice, the combination of glofitamab with Pola-based regimens (Pola alone or R-CHP-Pola) demonstrated superior and synergistic antitumor activity compared with combination with standard-of-care R-CHOP. Importantly, although the benefit of Pola-based combinations with glofitamab was especially pronounced in models with low and heterogeneous CD20 expression, these regimens may also provide added efficacy in settings with homogeneous and higher CD20 expression. The observed increase in CD20 antigen abundance in tumors treated with Pola likely plays a crucial role in enhancing glofitamab activity and potentially overcoming tumor escape mechanisms related to CD20 antigen loss or downregulation. Our data demonstrate that Pola treatment leads to an intratumoral increase in both CD20 optical density and the percentage of CD20+ cells in vivo. Given the stable CD79b expression upon treatment, these findings would suggest rather active upregulation of CD20 than clonal selection. This aligns with reports that Pola increases CD20 expression via AKT and extracellular signal-regulated kinase phosphorylation in vitro, which may also enhance sensitivity to rituximab-induced.32 Furthermore, the combination of Pola with glofitamab, led to enhanced intratumoral CD8+ and CD4+ T-cell infiltration and reduced tumor cell proliferation rates. These preclinical findings, therefore, provided the rationale for combinations of Pola-based regimens and glofitamab in the clinic, which are currently being investigated in first-line patients with DLBCL (NCT03467373; R-CHP-Pola plus glofitamab11) and in 2L+ patients with R/R LBCL (NCT03533283; Pola plus glofitamab33), reporting high response rates and manageable safety profiles.
The GemOx regimen serves as an alternative to CHOP-based chemotherapy and is considered to be less myelosuppressive, have better immunomodulatory effects, while more tolerable in older or heavily pretreated patients.34,35 Furthermore, oxaliplatin is known to induce ICD which stimulates antigen-presenting cells and may contribute to the priming of tumor antigen-specific T cell.36 As anticipated, the combination of glofitamab with GemOx in our preclinical humanized mouse models also demonstrated combinatorial efficacy, effectively enhancing intratumoral T-cell activation and proliferation while reducing exhaustion markers (PD-1+/Tim-3+), suggesting improved T-cell fitness. Although the exact mode of action of this combination is not fully understood, the direct antitumor effects of chemotherapy, together with the observed pharmacodynamic changes, suggest that GemOx may enhance the activity of glofitamab through multiple mechanisms. These could include reduction of immunosuppressive myeloid cells, modulation of the cytokine milieu to promote T-cell recruitment, and induction of ICD. These promising preclinical findings paved the way for clinical investigations, leading to the STARGLO phase III trial in 2L+ patients with R/R DLBCL (www.ClinicalTrial.gov identifier: NCT04408638; glofitamab plus GemOx12), reporting clinically meaningful benefits in overall survival and progression-free survival compared with R-GemOx in patients with R/R DLBCL who are ineligible for autologous stem cell transplant. Similarly, as revealed by others, epcoritamab (CD20-targeted TCE) in combination with GemOx demonstrated promising activity in R/R DLBCL patients in the EPCORE NHL-2 trial,37 supporting the potential of TCE combinations with GemOx. Last, in the context of the STARGLO trial, we evaluated patient peripheral T-cell functionality over several treatment cycles. Unlike the trial combining glofitamab with R-CHOP, where T-cell lymphopenia, characterized by a decline in peripheral T-cell numbers, was observed, no such events were detected in patients receiving GemOx. Although T-cell functionality was not affected in either trial as such, this still highlights that different chemotherapy regimens can have distinct impacts on T-cell populations.
The development of potent cellular and bispecific therapies has made chemotherapy-free regimens a realistic option for viable frontline treatment, particularly in older patients/ patients with frailty or in biomarker-driven subtypes. In our preclinical models with high and homogeneous CD20 expression (representing most patient population38,39), the chemotherapy-free combination of glofitamab with costimulatory bispecifics, such as CD19–4-1BBL and CD19-CD28, has demonstrated significantly enhanced tumor growth control, exceeding the efficacy of the R-CHOP combination. These combinations offer an “off-the-shelf” alternative to second-generation chimeric antigen receptor T cells and are currently under clinical investigation (glofitamab/CD19-CD28: NCT05219513; glofitamab/CD19–4-1BBL: NCT04077723) with promising emerging clinical activity. Furthermore, as reported here and in other studies,21 the sequential combination of glofitamab with CD19-CD28 and CD19–4-1BBL has the potential to further deepen and prolong the antitumor responses. This off-the-shelf approach offers flexibility for optimal safety and efficacy, while harnessing the synergistic potential of dual costimulatory pathways remains to be evaluated in future clinical trials. Additional chemotherapy-free immunotherapy combination partners, such as dual checkpoint inhibition (PD-1/Lag3) or Treg-depleting antibodies (α-CD25), have demonstrated promise in our preclinical models and have the potential to improve and accelerate the onset of antitumor efficacy paving the way for chemotherapy-free regimens in earlier lines of therapy and/or in older patients/ patients with frailty.
Overall, in preclinical models where glofitamab-mediated signal 1 is suboptimal due to low and heterogeneous CD20 expression and where the risk of CD20-negative tumor clone escape is high, our findings suggest that combining glofitamab with chemotherapy- and/or ADC-based agents that reduce tumor mass independent of CD20 expression, while targeting other tumor antigens (eg, Pola-R-CHP) and/or providing additional immunomodulatory effects (eg, GemOx), may result in better mitigation of tumor escape and boosting of glofitamab-mediated efficacy. Real-world data also suggest that ∼11% to 16% of patients with DLBCL (mostly in R/R setting) display low and patchy CD20 expression38,39 and could potentially benefit from such combination therapies.
Taken together, these preclinical investigations underscore the importance of tailoring treatment strategies to optimize therapeutic outcomes. They provide robust evidence that integrating glofitamab with chemotherapy regimens, ADCs, costimulatory molecules, and other chemotherapy-free immunotherapy combinations that address critical challenges such as antigen heterogeneity, immune evasion, and T-cell fitness/exhaustion offers significant potential to enhance therapeutic outcomes in aggressive non-Hodgkin lymphoma.
Authorship
Contribution: J.S., M. Bacac, C.K., and P.U. contributed to the conceptualization and ideation of the project; J.S., M. Bacac, G.L.-C., S.G., S.C., and S.H. contributed in designing and analyzing all in vitro and in vivo experiments; G.L.-C and M.S. executed the in vitro experiments; A.B. contributed in designing and analyzing the clinical biomarker data; S.B., S.J., and A.S. executed and analyzed the preclinical in vivo pharmacodynamic data; M. Bez organized and prepared all therapies for in vivo; I.D. and V.N. organized and performed the immunohistochemistry analysis; A.V., E.B., B.A., and M.L.C. conducted the in vivo experiments and humanized mice; K.K., K.L., A.B., P.L., and J.R. designed and coordinated the clinical trials and discussed both preclinical and clinical data; J.S. and M. Bacac wrote the manuscript; and all authors reviewed and edited the manuscript.
Conflict-of-interest disclosure: J.S., G.L.-C., S.G., M.S., S.H., K.K., K.L., J.R., S.B., A.V., B.A., I.D., V.N., M. Bez, E.B., S.J., A.S., M.L.C., S.C., C.K., P.U., P.L., A.B., and M. Bacac are or have been employees of Roche at the time of data generation; and hold ownership of Roche stock and patents. J.R. reports having stock ownership for Nkarta Therapeutics.
Correspondence: Johannes Sam, Roche Innovation Center Zurich, Wagistrasse 10, 8952 Schlieren, Switzerland; email: johannes.sam@roche.com.
References
Author notes
Original data are available on request from the corresponding author, Johannes Sam (johannes.sam@roche.com).
The online version of this article contains a data supplement.
There is a Blood Commentary on this article in this issue.
The publication costs of this article were defrayed in part by page charge payment. Therefore, and solely to indicate this fact, this article is hereby marked “advertisement” in accordance with 18 USC section 1734.

