Abstract
A new assay is described that measures the numbers (n) of endogenous long-term repopulating cells (eLTRC) surviving sublethal irradiation. The assay is based on analysis of variances of Pgk-1a phenotypes within groups of sublethally irradiated Pgk-1a/b mice. When ln n is plotted as a function of dose, the radiosensitivity (D0) is the negative reciprocal of the slope and the y-intercept is N or total numbers of eLTRC per mouse. The assay is unique in that N is an absolute value not requiring correction for seeding efficiency, or f. From two independent estimates, total numbers of eLTRC were determined to be 8,700 or 11,900 cells per mouse and D0 was found to be 0.82 or 0.83 Gy. If eLTRC are, in fact, the long-term repopulating cells (LTRC) defined by classical transfer assay, then LTRC can home to the marrow with nearly unit efficiency, only one to two LTRC are required for a mouse to survive a radiation LD50/30, and LTRC possess nearly unlimited self-renewal potential.
STERILIZATION of the hematopoietic stem cell compartment by radiation is lethal, for in the absence of stem cells, marrow cannot regenerate and death soon ensues from hemorrhaging and sepsis. Marrow grafting, a stem cell replacement therapy, protects against lethal irradiation. Surviving recipients are usually chimeras with donor precursor cells being supported by host stromal elements. Currently, the scoring of long-term chimeras — the long-term repopulating cell (LTRC) assay — is the only method available for assaying hematopoietic stem cells.
In many mammals, including mice,1-3 cats,4 and humans,5 one or only a very few LTRC are required to establish a chimera. Knowing numbers (N) of LTRC per mammal and their radiosensitivity (D0), prediction of the radiation doses resulting in 50% survival for 30 days (LD50/30 ) across species should be possible. Surprisingly, neither LTRC N nor D0 are known with certainty for any species. For mice, the D0 of LTRC has been surmised from measurements of cells closely related to LTRC. For these closely related cells (CRC), D0 ranges in value from 0.71 to 1.38 Gy.6 7 Presumably, the D0 of murine LTRC falls within this range.
Estimates of LTRC frequency in mice by binomial theorem8,9 and limiting dilution1 techniques indicate a concentration of one to three LTRC per 100,000 marrow cells. To arrive at absolute frequencies, these estimates need to be corrected for the fraction of LTRC that seed the recipient's marrow and/or spleen.10 While seeding efficiency ( f ) has yet to be measured for LTRC, it, like D0, has been inferred from f values for CRC.11 Because f values do not appreciably change as CRC differentiate, CRC f values are probably applicable to LTRC. However, f is dependent on the sampling interval between primary and secondary recipients and the organs sampled. Seeding efficiencies, therefore, are disparate numbers ranging in value from a low of 0.02 for a 24-hour spleen f to a high of 0.50 for a 2-hour marrow f.12 This 25-fold range inherent in f measurements makes the correction of primary data by application of f uncertain.
To overcome these discrepancies, a new endogenous assay for measuring and characterizing LTRC has been developed. The assay generates values for both N and D0 based on binomial analysis of sublethally irradiated female mice heterozygous for the Pgk-1a and Pgk-1b X-chromosome inactivation markers. Because it is an endogenous assay, N need not be corrected for f. The assay is referred to as the endogenous long-term repopulating cell (eLTRC) assay.
MATERIALS AND METHODS
Mice.C3H/HeHa Pgk-1a mice were a kind gift from Dr Verne M. Chapman (Roswell Park Memorial Institute, Buffalo, NY). These mice were rederived at Charles River Laboratories (Kingston, RI), where a pathogen-free breeding colony was maintained by brother-sister matings. Male C3H/HeHa (Pgk-1a) mice were bred with Charles River Laboratories C3H/HeN females (Pgk-1b) to produce the Pgk-1a/b F1 females (F1 mouse). Mice were shipped at 5 weeks of age and kept in a facility approved by the American Association for Accreditation of Laboratory Animal Care. They were maintained in microisolator cages, five per cage, on hardwood chip contact bedding, and were provided commercial rodent chow and acidified tap water (pH 2.5) ad libitum.
Radiation.Mice received total-body irradiation in the bilateral gamma radiation field of the Armed Forces Radiobiology Research Institute 60Co Facility.13 During irradiation, the animals were restrained in Plexiglass cages. The midline tissue doses ranged from 3.0 to 8.0 Gy and were delivered at a dose rate of 0.4 Gy/min. Before irradiation, the dose rate was established using acrylic mice phantoms. A 0.5-cc tissue equivalent ionization chamber (calibration factor traceable to the National Institute of Standards and Technology) was used for in-phantom dosimetry. The tissue to air ratio was 0.96 for the phantoms. The radiation fields were uniform to within ± 5%. Dosimetric measurements were made according to the American Association of Physicists in Medicine protocol for the determination of the absorbed dose from high-energy photon and electron beams.14
Assays.Groups of F1 female mice 8 to 10 weeks of age were bled from the retroorbital plexus, irradiated 10 to 20 days later, bled again 70 days postirradiation, and sacrificed 130 days postirradiation, at which time samples of peripheral blood and marrow from the femurs, humeri, and tibias were collected. Percentage marrow volumes for femur, humerus, and tibia were taken from Boggs15 as 6.6%, 3.0%, and 2.8%, respectively. Tissue extracts were prepared for electrophoresis as described by Ansell and Micklem.16 Briefly, 50 μL of whole blood was pelleted and resuspended in 1 mL of sample buffer. Heme was extracted with chloroform and the samples frozen at −80°C. Marrow cells were suspended in phosphate-buffered saline (PBS), washed once, and lysed. The cell suspensions were pelleted and resuspended in 50 μL of sample buffer and frozen. Alloenzymes were separated by electrophoresis on Titan III cellulose acetate membranes using a Helan tank (Helan Laboratories, Beaumont, TX). The membranes were stained for Pgk activity as described by Ansell and Micklem.16 The optical density of the enzyme reaction product was measured and integrated on a laser-based scanning densitometer. The ratio under the two peaks was taken as the ratio of the two Pgk alloenzymes. In the first set of experiments, preirradiation samples were analyzed within 2 weeks of collection and analyzed a second and third time with the 70- and 130-day sample runs. Less extensive, duplicate runs of the 70- and 130-day samples were also performed. Among the repeat runs, the variance of the Pgk-1a assay or technical variance7 was so small (Table 1) that, with the second set of experiments, all samples were assayed only once and this was within 30 days of the 130-day sample collections.
Binomial equation.Measuring eLTRC population size by binomial theorem can be illustrated by comparing stem cells to pennies. When the same number (n) of pennies are tossed repeatedly, each toss is a trial and each penny within each toss is an event. The fraction of pennies landing heads for any trial is an estimation of the probability (p) of a single penny landing heads. However, the best estimate of p is the average fraction heads taken over all trials and this is used as p in all calculations. The probability of a penny landing tails is 1 − p or q. The variance of the fraction positive heads between trials is the variance (s2) of p. In those cases where n is not known, but p, q, and s2 can be directly observed, the number of events per trial can be determined by solving the binomial equation n = pq/s2.
Like a penny, which can land either heads or tails, eLTRC will express either Pgk-1a or -1b, but not both. With eLTRC, each mouse is a trial and each eLTRC is an event within that trial. However, there is a difference between trials with pennies as outlined above and trials with eLTRC. With pennies, p always remains constant within and between trials. The probability of any penny landing heads during any event within any trial is always 0.5. When determining eLTRC numbers, this is not the case. Although all eLTRC within a single mouse have the same probability of being Pgk-1a positive, p nonetheless varies between mice. This is a direct result of X-chromosome inactivation occurring early in embryogenesis.
This might be better illustrated by restructuring the penny experiment so that it more closely resembles an eLTRC irradiation experiment. Take several groups of 20 pennies each. Each group of pennies represents an individual embryo/mouse, and within each group, each penny represents one of the 20 prehematopoietic embryonic cells destined to undergo X-chromosome inactivation. Each group is then tossed, fraction positive heads for each group scored, and 19 pennies are then randomly removed from each group. The last step would be analogous to “removing” eLTRC from adult mice by irradiation — as will be explained in more detail later. What is the probability, p, that the one remaining penny within each group will be heads? It is not 0.5 as would be expected from tossing groups of pennies as outlined earlier. Rather, p for any penny within a specific group would be the fraction positive heads for that group as set by the initial 20-penny toss.
This is essentially what is happening to eLTRC. X-chromosome inactivation sets p from that point onward for all hematopoietic stem cells within that embryo/mouse. Subsequent stem-cell amplification, differentiation, and/or irradiation (Table 1) do not change p. Thus, within an adult mouse, the probability that any given eLTRC will be Pgk-1a positive is constant, but p will change from mouse to mouse because of the random nature of X-chromosome inactivation (Table 2, fourth column).
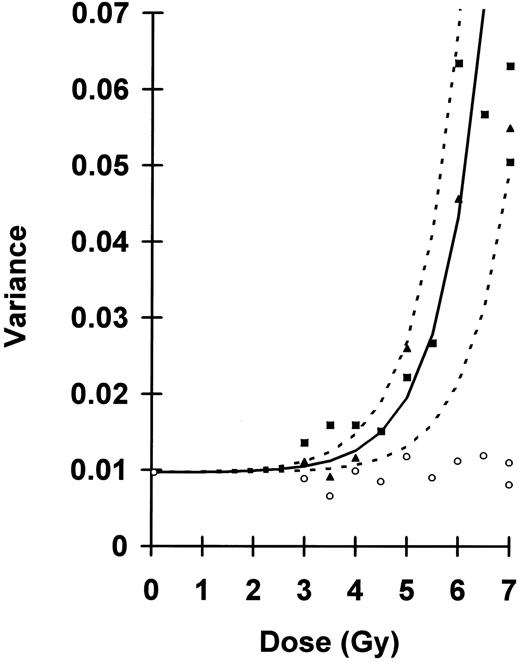
To assess numbers of eLTRC per mouse, n must be reduced to less than a hundred or so cells per mouse so that the variance of p between mice is substantially larger than the variance of p generated by X-chromosome inactivation (Fig 1). High-dose irradiation in the range of 4.0 to 7.0 Gy reduces eLTRC numbers to less than 100 cells. Because p remains constant within individual mice, but varies between mice, the number of eLTRC surviving irradiation is not n = pq/s2, but rather is n = (pq − s21)/(s22 − s21),17 where s21 is the variance of p measured preirradiation and s22 is the variance of p measured postirradiation. Specific calculations of s21, s22, and n are all illustrated in the 5.5-Gy irradiation experiment listed in Table 2. By plotting ln n as a function of dose, and back-extrapolating to 0 Gy, N or total number of eLTRC per mouse can be estimated. The slope of the least-squares fitted line would be −1/D0.
Uncorrected blood sample variances plotted as a function of dose. Preirradiated s21, ○; 70-day postirradiation s22, ▴; and 130-day postirradiation s22, ▪. Fitted curve, —, described by equation 4, where average s21 = 0.0097, D0 = 0.82 Gy, and N = 8,700 cells. Keeping D0 and s21 constant, but varying N between 5,000 and 25,000 cells, generates upper and lower limits, - - - - , encompassing all variances measured postirradiation for doses greater than 4.0 Gy.
Uncorrected blood sample variances plotted as a function of dose. Preirradiated s21, ○; 70-day postirradiation s22, ▴; and 130-day postirradiation s22, ▪. Fitted curve, —, described by equation 4, where average s21 = 0.0097, D0 = 0.82 Gy, and N = 8,700 cells. Keeping D0 and s21 constant, but varying N between 5,000 and 25,000 cells, generates upper and lower limits, - - - - , encompassing all variances measured postirradiation for doses greater than 4.0 Gy.
It has to be assumed that nearly all of the few eLTRC that survive high-dose irradiation contribute equally to hematopoiesis. However, such an assumption is not necessary for preirradiation eLTRC. If the number of eLTRC in a normal mouse is approximately 10,000 cells and only 5% are active, then the variance of p for eLTRC preirradiation would be 0.000394. If all 10,000 contributed equally, then the variance would be 0.0000197. Although this will induce some error in the calculation of n, the error will be extremely small. Either variance is substantially less than the variance resulting from X-chromosome inactivation (0.0097) or the technical variance (0.0012).
When s21 = 0, then n = (pq − s21)/(s22 − s21) reduces to n = pq/s2. This is what occurs with LTRC assay. Marrow is pooled from several donors and is transferred in limiting quantities to lethally irradiated recipients. Each recipient now becomes a trial. The pooling of marrow prior to transfer eliminates the variance of p between trials.
RESULTS
Early in embryogenesis, one of the two female X-chromosomes condenses and undergoes inactivation. Thus, females are mosaics, all of their cells expressing either the maternal or paternal X-chromosome, but not both. For the (C3H/HeNxC3H/HeHa)F1 female mouse the maternal X-chromosome is marked by the Pgk-1b genotype, while the Pgk-1a form scores the paternal X-chromosome. The probability, p, that any given cell will express the Pgk-1a phenotype should be 0.5. However, Pgk genes are closely linked to X-chromosome controlling elements (Pgk-1a :Xcee and Pgk-1b :Xcea) and p for F1 mice is actually 0.73 ± .02 (mean ± SD, Table 1), a value in agreement with that found for other strains of Pgk-1a/b mice.18
According to binomial equation, when p is kept constant within and between trials, such as occurs during embryonic X-chromosome inactivation,19,20 or assessing LTRC frequency by pooling and transferring adult marrow cells from several donors to lethally irradiated recipients,7n is:
where q = 1 − p and s2 is the sample variance of fraction-positive Pgk-1a cells between trials. Using average preirradiation p values from Table 1 and the average preirradiation variances plotted in Fig 1, it was calculated that at the time of X-chromosome inactivation 20.5 ± 3.2 (mean ± SD, 11 determinations) embryonic cells are committed to hematopoiesis in the F1 mouse. Therefore, adult LTRC phenotypes will be distributed among F1 mice according to binomial equation with parameters p = 0.73 and n = 20.5. For eLTRC assay, p will remain constant within trials, but, unlike the LTRC assay, p will vary between trials.
Because p is not altered by sublethal irradiation (Table 1), but does vary between trials, preirradiation variance of fraction-positive Pgk-1a cells must be taken into consideration when calculating n by endogenous assay. This is shown graphically in Fig 1. Under these conditions, n or the number of eLTRC surviving sublethal irradiation is a function of postirradiation variance according to:
where s21 is the preirradiation variance and s22 is the postirradiation variance.15
The technical variance of the assay (Table 1) has little impact on the calculation of n. In the denominator, the technical variances associated with s21 and s22 cancel, while in the numerator, the value pq − s21 is substantially larger than the technical variance of s21.
Primitive hematopoietic cells have limited repair capacity in response to ionizing radiation6 7 and 60Co irradiation effectively reduces eLTRC numbers in situ according to:
where n is the number of cells surviving, N is the number of cells irradiated, D is dose, and D0 is the dose reducing numbers of surviving cells to 0.37 of control values. When n is calculated postirradiation according to equation (2) and ln n is plotted as a function of sublethal dose D, the y-intercept is N and the slope of the fitted curve is −1/D0.
Accurate measurements of blood s22 were hampered by the long life span of the red blood cells. To ensure that the peripheral blood variance had stabilized postirradiation, blood was sampled at both 70 and 130 days postirradiation. As expected, there was a weak correlation (r) of fraction-positive Pgk-1a cells between the preirradiation and 130-day postirradiation blood samples. A much stronger correlation was seen between both the 70- and 130-day blood samples and the 130-day blood and marrow samples (Table 1). eLTRC numbers remained fairly constant between 70 and 130 days postirradiation and N was determined using the 130-day data. For the various marrow compartments, it was not possible to measure preirradiation p and s21. In normal mice, these parameters were found to be similar to those for blood. Therefore, preirradiation blood parameters were substituted for marrow p and s21 when calculating marrow n postirradiation.
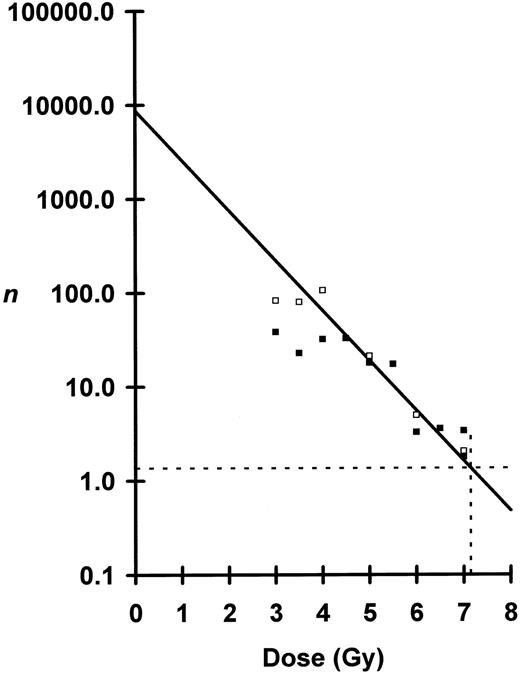
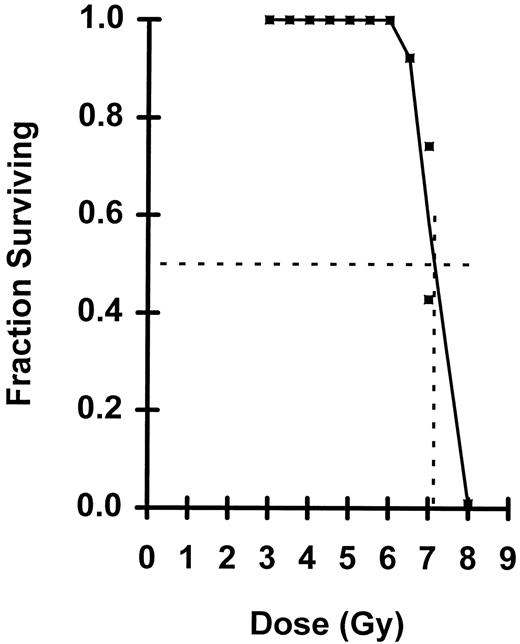
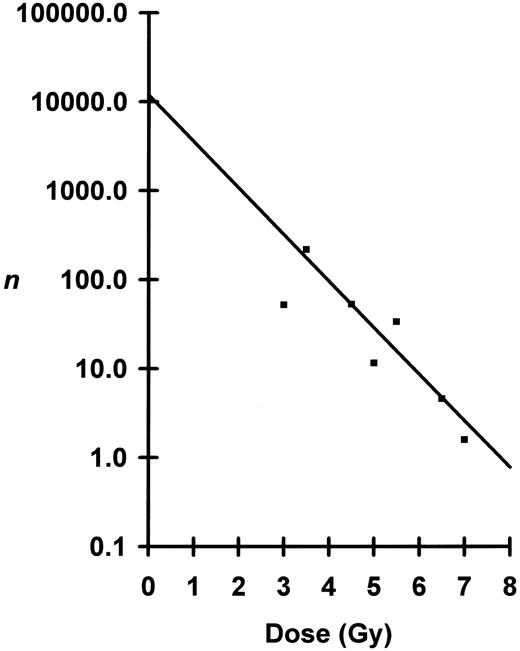
Shown in Fig 2 is a plot of ln n versus dose where n was calculated from the blood data. For doses between 4.5 to 7.0 Gy, the semilog plot is linear, but below 4.0 Gy the curve breaks and flattens. Using the linear portion of the curve from 4.5 to 6.5 Gy — doses which nearly all mice survived — D0 was calculated to be 0.82 Gy and N to be 8,700 cells per mouse. At 7.0 Gy, substantial numbers of irradiated mice died (Fig 3) necessitating corrections for n. At the observed LD50/30, n was determined to be 1.36 eLTRC per mouse (Fig 2). When 1.36 eLTRC per mouse survive irradiation, Poisson statistics state that 26% of the irradiated mice will have no eLTRC (P0 mice) and 35% will have one eLTRC (P1 mice). Assuming that all P0 mice and 70% of P1 mice die, just under two eLTRC are required for an F1 mouse to survive a LD50/30. Average eLTRC for nonsurviving mice would be 0.5, and corrections for n of 0.51 and 0.77 for the two groups of mice receiving 7.0 Gy are the values plotted in Fig 2.
Peripheral blood analysis of numbers, n, of eLTRC surviving irradiation plotted as a function of dose. Seventy-day n, □; and 130-day n, ▪. Because of the break in the curve below 4.0 Gy, the regression line was fitted by least-squares method to data points from 4.5 Gy to 6.5 Gy for the 130-day samples. Negative inverse of the slope or D0 was calculated to be 0.82 Gy ± 0.27 Gy (mean ± SE). The y-intercept or total number, N, of eLTRC per mouse was calculated to be 8,709, +32,299, −6,859 cells (mean ± SE). The 7.0-Gy data points were corrected for survival as described in text. Dotted lines define n = 1.36 for the observed LD50/30 of 7.15 Gy.
Peripheral blood analysis of numbers, n, of eLTRC surviving irradiation plotted as a function of dose. Seventy-day n, □; and 130-day n, ▪. Because of the break in the curve below 4.0 Gy, the regression line was fitted by least-squares method to data points from 4.5 Gy to 6.5 Gy for the 130-day samples. Negative inverse of the slope or D0 was calculated to be 0.82 Gy ± 0.27 Gy (mean ± SE). The y-intercept or total number, N, of eLTRC per mouse was calculated to be 8,709, +32,299, −6,859 cells (mean ± SE). The 7.0-Gy data points were corrected for survival as described in text. Dotted lines define n = 1.36 for the observed LD50/30 of 7.15 Gy.
Fraction of mice surviving a given radiation dose. The dotted lines define the LD50/30 of 7.15.
Fraction of mice surviving a given radiation dose. The dotted lines define the LD50/30 of 7.15.
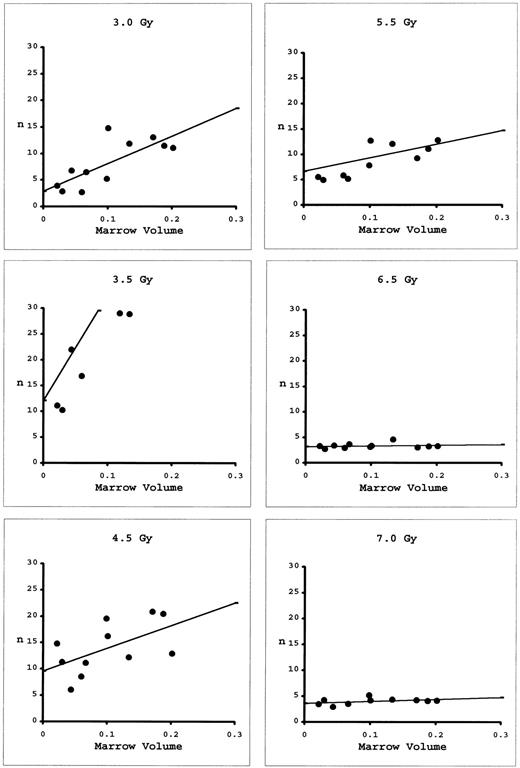
The approach to determining N and D0 using marrow taken from the long bones differs from that for blood. While blood is a universal sampler of all marrow compartments, the marrow of individual long bones represents less than 7% of total marrow. As Micklem et al8 have shown, it is necessary to combine marrow samples from the various long bones of individual mice and redetermine n for these combinations. The results can then be extrapolated to 100% marrow volume (Fig 4). At low doses, there is appreciable slope to these extrapolations, indicating local regeneration of the marrow compartments. At high doses, the slopes are nearly flat, indicating all marrow is being regenerated from very few eLTRC. By plotting these extrapolated n's as a function of dose (Fig 5), D0 was calculated to be 0.83 Gy and N to be 11,900 cells. These values are similar to those determined using peripheral blood, indicating that both the blood and marrow assays are measuring the same multipotent cell.
Numbers, n, of eLTRC estimated from combinations of various volumes of bone marrow in mice receiving radiation doses between 3.0 to 7.0 Gy. Regression lines were fitted by the methods of least squares. Number of eLTRC in the whole marrow volume was estimated by extrapolation to 100%. The five data points exceeding n = 3 in the 3.5-Gy graph are not shown.
Numbers, n, of eLTRC estimated from combinations of various volumes of bone marrow in mice receiving radiation doses between 3.0 to 7.0 Gy. Regression lines were fitted by the methods of least squares. Number of eLTRC in the whole marrow volume was estimated by extrapolation to 100%. The five data points exceeding n = 3 in the 3.5-Gy graph are not shown.
Numbers, n, of marrow eLTRC surviving irradiation plotted as a function of dose. Because of the break in the curve below 3.5 Gy, the regression line was fitted by least-squares method to data points from 3.5 to 6.5 Gy. Correction of observed n at the 7.0-Gy dose was done as for blood samples. Negative inverse of the slope or D0 was calculated to be 0.83 Gy ± 0.31 Gy (mean ± SE). The y-intercept or total number of eLTRC per mouse was calculated to be 11,863, +46,070, −9,434 cells (mean ± SE).
Numbers, n, of marrow eLTRC surviving irradiation plotted as a function of dose. Because of the break in the curve below 3.5 Gy, the regression line was fitted by least-squares method to data points from 3.5 to 6.5 Gy. Correction of observed n at the 7.0-Gy dose was done as for blood samples. Negative inverse of the slope or D0 was calculated to be 0.83 Gy ± 0.31 Gy (mean ± SE). The y-intercept or total number of eLTRC per mouse was calculated to be 11,863, +46,070, −9,434 cells (mean ± SE).
DISCUSSION
Using modified binomial equation to assess numbers of endogenous LTRC surviving irradiation in Pgk-1a/b mice, it was found, based on two independent estimates, that the D0 of eLTRC is 0.82 or 0.83 Gy, and N is approximately 8,700 or 11,900 cells per mouse. Using these parameters, it was determined that the F1 female mouse requires nearly two eLTRC to survive a LD50/30 dose. However, the observed LD50/30 of 7.15 Gy for the F1 female mouse is lower than that normally seen for the C3H/HeN mouse, which is 7.82 Gy.21 The latter value indicates that under optimum conditions, only a single eLTRC is required for survival.
A break and flattening of the dose-response curve for doses less than 3.5 to 4.0 Gy for both blood and marrow greatly restricted the number of data points available for curve fitting. A lengthy extrapolation to 0 Gy is required, resulting in a large standard error (see legends to Figs 2 and 5) for N. Perhaps when the difference between the preirradiation and postirradiation variance becomes very small, the assay is not accurate for technical reasons. Alternatively, the break in the curve may reflect the fact that in normal nonirradiated animals, only a few LTRC contribute actively to hematopoiesis. In humans, the number of eLTRC supporting hematopoieses has been estimated at 400 to 500 cells,22 and in the mouse it is also believed to be in excess of 100 cells.23 The finding that when more than 50 to 100 eLTRC survive irradiation, the dose-response curves break and flatten may simply indicate that not all eLTRC contribute equally to hematopoietic regeneration at lower doses. However, if the break in the curve is an artifact, and assuming postirradiation variance approaches average preirradiation variance in an asymptotic manner, a curve described by the equation:
gives a reasonable fit to the uncorrected postirradiation variances when plotted as a function of dose (Fig 1). Setting D0 to 0.82 Gy and average s21 to 0.0097, all variances for doses greater than 4.0 Gy fall within a range of N between 5,000 and 25,000 cells. For the 4.0- to 6.5-Gy range, the upper limit is 13,000 cells.
By extrapolating n for various combinations of bone marrow samples to 100% marrow volume, it was possible to determine the total number of eLTRC surviving a given radiation dose. However, the reverse extrapolation to the y-intercept is also of interest. As seen in Fig 4, the y-intercept for various doses was remarkably constant over a wide range of doses and never approached one. Thus, even at high doses exceeding 6.5 Gy, where only a few eLTRC survived irradiation, there was no evidence for clonal regeneration in small marrow volumes. Within small marrow volumes, there appears to be a mix of cells derived from at least three to five hematopoietic clones. More direct evidence for the lack of clonal dominance in small marrow volumes comes from the work of Hermans et al.24 They concluded that migration of progenitors between specialized hematopoietic microenvironments is an essential process in the maturation and differentiation of hematopoietic cells. The present work lends support to this conclusion and possibly suggests that migration of LTRC is in itself an important step in hematopoietic proliferation and differentiation.
Using either binomial analysis or limiting dilution techniques,1,7 it is generally agreed that the frequency of LTRC is approximately two to three cells per 100,000 marrow cells when measured 60 to 120 days posttransplantation. When assayed from 150 days on out, the LTRC concentration appears to be one cell per 100,000 marrow cells.8,25 In the present work, constraints prevented measurements of eLTRC at these longer time periods. Nonetheless, assays of the 130-day blood and marrow samples would be expected to give reasonably accurate estimates of eLTRC numbers. Because the total marrow mass of the mouse is approximately 2.8 × 10⁸ cells,14 the total number of LTRC per mouse would be between 2,800 to 8,400 cells. Given the assumption that LTRC and eLTRC are one and the same, the present estimates of N by endogenous assay of 8,700 or 11,900 cells indicate a seeding efficiency for LTRC in the range of 0.3 to near unity. Possibly, LTRC home directly to the marrow by way of specific cell receptors recognizing defined stromal elements.26
Boggs et al27 measured endogenous marrow regeneration following repeated high-dose irradiations. In these experiments, mice received whole-body doses of 6.0 Gy at 6-week intervals. The irradiations were repeated six times without encountering appreciable lethality. Six Gy would have reduced the size at the eLTRC population to approximately six cells and at least 10 cell doublings would have been required to regenerate a large enough population to withstand a second irradiation of 6.0 Gy. Repeated six times, eLTRC would have had to have undergone at least 60 cell doublings. Because the irradiation regimen used by Boggs et al did not exhaust the proliferative capacity of eLTRC, their capacity must be well in excess of 60 cell doublings and, as noted by Boggs et al, probably exceeds the estimated 100 cell doublings for human fibroblasts in vitro. In stark contrast to the nearly unlimited proliferative potential of eLTRC, serial passage of LTRC through lethally irradiated recipients28 results in their rapid disappearance after only nine to 10 cell doublings. If eLTRC and LTRC are the same cell, then it is the trauma of transplantation and not “burn out” resulting from excessive proliferation that is the limiting factor in assessing the regenerative capacity of LTRC by serial passage.
Because all mice survive 6.0-Gy irradiation and, at this dose, all surviving eLTRC appear to contribute equally to hematopoiesis, the difference between the 6.0-Gy preirradiation and postirradiation variances is a simple, direct measurement that can be used to define the position of other hematopoietic stem-cell subpopulations within the hematopoietic stem hierarchy relative to eLTRC. Rearranging equation 4:
gives (s22 - s21)6Gy as a function of N and D0. The higher (s22 − s21)6Gy for a particular subpopulation, the more likely it would include eLTRC. For example, the 12-day colony-forming unit–spleen (CFU-s) is characterized by N ≈ 81,200 and D0 ≈ 0.91 Gy and, for the 28-day cobblestone area-forming cell (CAFC), N ≈ 16,800 and D0 ≈ 1.38.7 29 Substituting these numbers into equation 5 generates (s22 − s21)6Gy values of 0.00168 and 0.00086 for CFU-s and CAFC, respectively. If seeding or plating efficiencies were to be included in these calculations, these values would be further reduced. Nonetheless, at least a 30-fold difference is apparent between these values and that directly observed for eLTRC (0.05212). This might indicate that CFU-s and CAFC are more mature cells than eLTRC.
ACKNOWLEDGMENT
I thank William Jackson for help in statistical analysis of data and Philip Craw for excellent technical assistance.
Address reprint requests to Kenneth F. McCarthy, PhD, 83 Fort Walker Dr, Hilton Head Island, SC 29928.

