Abstract
Despite a decade of human immunodeficiency virus (HIV) seropositivity, a few individuals termed as long-term nonprogressors (LTNPs) maintain a stable CD4+ T-cell count for a period of time. The aim of this study was to establish, through the sequential determination of all known predictors of HIV disease, the proportion of such patients having stringent criteria of true long-term nonprogression. Among 249 individuals who were HIV-infected and prospectively followed up over a 10-year period (1985 to 1995), 12 having a CD4+ T-cell count greater than 500/μL (LTNP I group) and 9 having a CD4+ T-cell count less than 500 but stable over time (LTNP II group) after at least 10 years of infection without intervention of antiviral therapy, were studied over the entire follow-up period. The plasma HIV RNA copy number and the serum concentrations of p24 antigen, each anti-HIV antibody, neopterin, β-2-microglobulin, Immunoglobulin (Ig) G and IgA were determined every 18 months over the study period. Cellular and plasma viremias were cross-sectionaly assayed in all 21 patients. Only two patients had strictly no marker of progression over the follow-up period. They were the only ones who had, over the 10-year period, a viral copy number too low to be detected. The other patients had a viral copy number higher than 400/mL at at least one visit and increasing over the follow-up period, and they evidenced one or more markers of virological or immunological deterioration. Cellular viremia was positive in all patients but two, while plasma viremia was negative in all but one. The population of individuals termed as LTNPs is not virologically and immunologically homogeneous. The majority present biological signs of HIV disease progression. A new pattern of true LTNP can be drawn through stringent criteria based on the whole known predictors. This pattern appears to be rare in HIV-positive population.
DURING THE NATURAL history of human immunodeficiency virus (HIV) infection, clinical latency has not yet been associated with biological latency. It is now established that the virus replicates actively and progressively in lymphoid tissue during the symptomless HIV carrying period, with a rapid and permanent turnover of the CD4+ T-cell pool.1-3 Nevertheless, a number of cohort studies have shown that, despite a decade of infection, a small percentage of HIV-positive individuals remain symptomless and maintain a high CD4+ T-cell count without any intervention of antiviral therapy.4-8 These individuals maintaining a CD4+ T-cell count above 500 per μL over a 10-year period are termed as long-term nonprogressors (LTNPs) and represent less than 5% of the cohorts. However, most LTNPs, when compared with HIV-uninfected controls, show mild biological abnormalities7,9,10 so that the proportion of true LTNPs would probably be less if the definition were broadened to include all known predictors of disease progression. Indeed, these latter markers complement the information provided by the CD4+ T-cell count alone. They include an increase of plasma HIV RNA load,11,12 a conversion from p24 antigen (p24 Ag) negativity to positivity,13 a decrease of serum anti-p24 antibody concentration,14 and biological signs of nonspecific immunostimulation such as elevated serum concentrations of β-2-microglobulin (β2M ), neopterin, immunoglobulin G (IgG), and immunoglobulin A (IgA).15 Thus, it would be interesting to take into account all of the biological markers of disease progression to obtain a limited but well-characterized group of LTNPs in whom the mechanisms conferring the clearest status of nonprogression could be studied. Such findings in these individuals could have important implications for understanding the pathogenesis of the HIV disease and for designing the best therapy.
The current definition of LTNPs based on a CD4+ T-cell count higher than 500 per μL over a long period of time9 could exclude another subgroup of nonprogressing HIV-infected individuals. Although CD4+ T-cell count is the best known and most broadly used surrogate marker of HIV infection, it does not always correlate with the disease stage and with the trend of progression towards acquired immunodeficiency syndrome (AIDS). Indeed, some HIV-infected individuals remain healthy with a CD4+ T-cell count included between 200 and 500 per μL and stable over a decade or more. Little is known about this particular subgroup of HIV-positive individuals, who are not yet considered and termed as LTNPs according to the current definition.
Until now, many of the studies on LTNPs have been limited by a cross-sectional design and have lacked precisely defined dates of HIV seroconversion.6 16 Little information has been reported on longitudinal changes of LTNPs. To address these issues, we present the results of a longitudinal study led in our center over a 10-year period and based on the follow-up of a prospective cohort of individuals diagnosed as HIV-infected before December 1985. Among these individuals, we selected in 1995 (ie, at least 10 years after the diagnosis of HIV infection) those retaining a CD4+ T-cell count higher than 500 per μL without any antiviral therapy (according to the current definition of LTNPs) and those having a CD4+ T-cell count included between 200 and 500 per μL and who remained stable over the same period without any antiviral therapy. Our objectives were to sequentially determine the plasma HIV RNA level and the values of other biological predictors in the patients of these two subgroups followed over a 10-year period and to further establish what proportion of them could be considered as true LTNPS (ie, as individuals without any clinical and biological sign of HIV disease after a decade of carrying the virus).
MATERIALS AND METHODS
Study Population
Two hundred forty-nine individuals diagnosed as HIV-1–infected before December 1985 were included in the study. All were prospectively followed up in our outpatient clinic through regular visits since the discovery of their seropositivity. The diagnosis of HIV infection had been determined for all through a specific ELISA with confirmation by HIV-1 Western blot. At each visit, the patients underwent a physical examination and provided blood specimens for laboratory evaluation. In December 1995, the 249 patients were classified into one of the following groups according to the outcome:
Patients with no symptoms of HIV infection and having a CD4+ T-cell count higher than 500 per μL over the 10-year period without any antiviral therapy (subgroup defined as LTNPs I ).
Patients with no symptoms of HIV infection and having a CD4+ T-cell count included between 200 and 500 per μL and who remained stable over the 10-year period without any antiviral therapy (subgroup defined as LTNPs II ).
Patients with no symptoms of HIV infection and having a CD4+ T-cell count higher than 500 per μL in 1985 and lower than 500 per μL in 1995.
Patients having progressed towards the disease (patients deceased by a cause linked to HIV infection and/or having entered the Center for Disease Control [CDC] stage C).
Patients deceased by suicide or by a cause unlinked to HIV infection.
Patients lost to follow-up.
The date of an HIV infection was estimated for patients belonging to both LTNP groups, as follows, namely the time between (1) an HIV-negative assay result in the 6 months preceding the first HIV-positive assay result, (2) an incomplete Western blot followed by a complete Western blot and/or a well-documented clinical primary HIV infection, and/or (3) a known period of exposure to HIV infection.
Biological Methods
Longitudinal Study
The assays discussed below were performed on blood samples collected at each visit over the 10-year period in patients from LTNP I and II groups.
The quantitation of plasma HIV-1 RNA copies was determined through nucleic acid sequence-based amplification (NASBA; Organon Teknika, Boxtel, Netherlands).17 This assay is based on the simultaneous activity of three isothermal enzymes (avian myeloblastosis virus reverse transcriptase, T7 RNA polymerase, and RNase H), each acting continuously on its appropriate substrates. The isolated nucleic acid was amplified by interaction of these enzymes together with a primer set selected in the gag region of the HIV sequence. Nucleic acid of 100 μL of plasma was used. The cyclic phase was performed under isothermal conditions at 41°C. Quantitation of HIV-1 RNA was based on coamplification of HIV-1 RNA with an internal standard Q-RNA dilution series, thus ensuring equal efficiency of amplification.18 Three distinguishable Q-RNAs (Qa, Qb, and Qc) were mixed with the wild-type sample at different amounts (ie, 104 Qa, 103 Qb, and 102 Qc molecules) and coamplified with the wild-type RNA in one tube. Using electrochemiluminescence-labeled oligonucleotides, the wild-type Qa, Qb, and Qc amplificates were separately detected with a semiautomated electrochemiluminescence detection instrument (NASBA QR system), and the ratio of the signals was determined. The amount of initial wild-type RNA was calculated from the ratio of wild-type signal to Qa, Qb, and Qc signals. The results were expressed in number of viral copies per mL (VC/mL) of plasma. The assay has a quantitation limit of 400 VC/mL. Our protocol stated that a qualitative NASBA assay17 18 (more sensitive than the quantitative assay) would be performed on the sera of patients who were found negative for HIV RNA through the quantitative assay over the entire study period.
The CD4+ T-cell count and the CD8+ T-cell count were measured with specific monoclonal antibodies by flow cytometry.
The concentrations of serum p24 Ag were determined by a monoclonal HIV-Ag immunoassay (Abbott Laboratories, Wiesbaden-Delkenheim, Germany) according to the manufacturer's instructions before and after immune complex dissociation (ICD).19 20 The results were expressed in picograms per milliliter. The specificity of the low-positive results (<30 pg/mL) was confirmed by a neutralization assay (Abbott Laboratories). The concentrations of serum anti-p24 antibody were determined by a HIV p24 antibody assay (rDNA; Abbott Laboratories) by the last dilution still detectable, according to the manufacturer's instructions. The results were expressed by the inverse of dilution.
Quantitation of each serum anti–HIV-1 antibody was determined through ScanBlot analysis of HIV-1 Western blot (SC/WB).21 The Western blot reader, ScanBlot (Genelabs Diagnostics, Redwood City, CA, compatible with the Apple MacIntosh hardware), was used to obtain an automatic and objective reading of Western blot bands. At first, HIV-1–Western blot (Diagnostic Biotechnology, Geneva, Switzerland) was performed with serial dilutions from 1/10 to 1/100,000 of each studied sample to determine dilution, which allowed detection and quantification of the majority of the anti–HIV-1 antibodies within the linear range of the ScanBlot. The strips were incubated for 1 hour at room temperature. The Western blot was performed according to a standard procedure with defined times for each step, in particular for the color development. The quantitation of each anti–HIV-1 antibody was performed by determination of peak height of each band as visualized on Western blot at the 1/200 dilution (the SC/WB measured the intensity of each band as units of reflectance reported as grey units ). The specificities of the anti–HIV-1 antibodies quantified by the SC/WB were p24, p31, p51, p55, p66, Gp41, Gp120, and Gp160; anti-p17 antibody was not included in the study because it was not read by the SC/WB at the chosen dilution. An anti-IgG band was used as a reaction control. The results were expressed by the intensity ratio of each band with regard to an anti-IgG band to avoid the effect of polyclonal variations and to compare between different samples collected over time from a same patient and samples collected from several patients.
The serum concentrations of IgG and IgA were assayed through nephelometry (BN 100; Behring Diagnostic, Rueil-Malmaison, France) and were expressed in grams per liter. The serum concentrations of β2M (Behring Laboratories, Rueil-Malmaison, France) and of neopterin (Brahms Diagnostica, Berlin, Germany) were measured by commercial quantitative competitive radioimmunoassay according to the manufacturer's instructions. The results were expressed in milligrams per liter and in nanomoles per liter, respectively.
The CD4+ T-cell count, the CD8+ T-cell count, and the serum concentrations of IgG, IgA, β2M, and neopterin had been prospectively determined. The quantitation of plasma HIV RNA copies, of p24 Ag before and after ICD, of anti-p24 antibody, and of other anti-HIV antibodies were performed in 1995 on frozen longitudinal samples routinely collected over the study period and stored at −80°C.
Transversal Study
Plasma and cellular viremias were assayed in 1995 in all patients of LTNP I and LTNP II groups by cocultures on heparinized blood (30 mL) within 4 hours of collection. For cellular viremia,22 decreasing numbers of peripheral blood mononuclear cells (PBMCs; 106, 2 × 10⁵, 4 × 10⁴, 8 × 10³, 1.6 × 10³, 3.2 × 10²) isolated by Ficoll-Hypaque gradient centrifugation were cocultured in 24-well plates with 2 × 10⁶ fresh phytohaemagglutinin preactivated PBMCs from HIV seronegative individuals in 1.5 mL RPMI-1640 supplemented with 10% fetal calf serum, 20 IU/mL IL2, antibiotics. The results of quantitative cellular viremia were expressed in tissue culture infectious dose (TCID) 50 per million cells. For plasma viremia,22 the plasma was obtained by blood centrifugation at 3,000g for 15 minutes; decreasing volumes (500, 100, 20, 4, and 0.8 μL) were added to the culture medium of 2 × 10⁶ PBMCs. In both procedures, one-half of the medium was replaced twice a week and 4 × 10⁵ fresh PBMCs were added to each well once a week. The cocultures were monitored for up to 28 days, and a viral replication was evaluated in terms of supernatant p24 Ag titers once a week. The production of p24 Ag in culture supernatants was determined by ELISA (Abbott Laboratories). The last dilution giving a positive culture was taken as the end-point. The results of quantitative plasma viremia were expressed in TCID50 per milliliter.
Statistical Methods
The data of the visits performed every 18 months were retained for the study (ie, seven visits over a 10-year period). Results were expressed as mean ± one SD. The different parameters between LTNP I and LTNP II groups were compared using the Mann-Whitney nonparametric test. In each LTNP group, the evolution over time of the mean values of each biological parameter was studied by the Wilcoxon nonparametric test for paired data. Correlations between quantitative parameters were tested by the Spearman rank test.
RESULTS
Characteristics of the Studied Population
Among the 249 individuals HIV-infected before December 1985 and prospectively followed up in our center:
12 (4.8%) belonged to LTNP I group.
9 (3.6%) belonged to LTNP II group.
52 (20.8%) were still symptomless but their CD4+ T-cell count had gone from more than 500 per μL in 1985 to less than 500 per μL in 1995.
124 (49.8%) were deceased by a cause linked to HIV infection and/or had entered CDC stage C.
6 (2.4%) were deceased by suicide or by a cause unlinked to HIV infection.
46 (18.4%) were lost to follow-up.
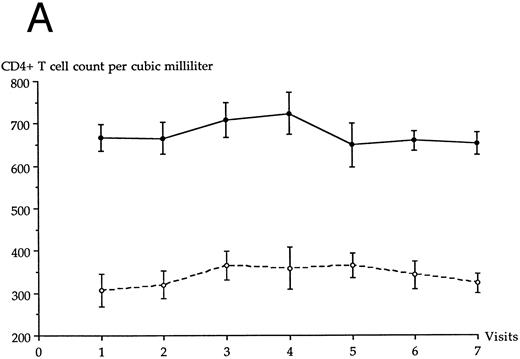
The epidemiological characteristics (age, sex, risk factors of HIV infection) of the 21 patients belonging to LTNP I and II groups are given in Table 1. None had ever received antiviral therapy during the follow-up period, and all were white. Fifteen had documented dates of HIV infection, as shown in Table 1; the six others were seroprevalent patients and probably seroconverted between 1981 and 1985, as suggested by French epidemiological data on HIV infection. The evolution over time of the CD4+ T-cell count in each LTNP group is shown in Fig 1A. The mean age of LTNP I patients and of LTNP II patients was 35.9 ± 6.4 years and 41.4 ± 5.6 years, respectively (significant difference, P = .046).
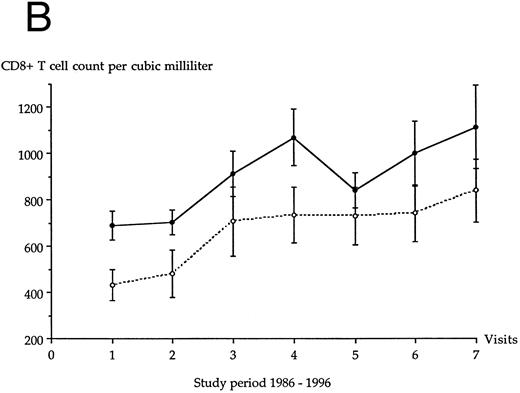
Evolution of the average CD4+ T-cell count (A) and CD8+ T-cell count (B) in each LTNP group over the 10-year follow-up period. (•), LTNP I group (n = 12), (○), LTNP II group (n = 9).
Evolution of the average CD4+ T-cell count (A) and CD8+ T-cell count (B) in each LTNP group over the 10-year follow-up period. (•), LTNP I group (n = 12), (○), LTNP II group (n = 9).
Viral Expression
The plasma HIV RNA copy level increased over the follow-up period in each LTNP group, as shown in Fig 2. This increase was statistically significant for LTNP I group (P < .05), for patients of both groups (P < .05), and not for LTNP II group (P = .17). LTNP I group and LTNP II group were not statistically different at each visit for the plasma HIV RNA copy level. At the end of the follow-up period, HIV RNA copy level was on average twice the initial level in both LTNP groups. Only two LTNPs (nos. 4 and 12 in Table 1) had less than 400 VC/mL over the entire study period, but were positive for HIV RNA through the qualitative NASBA assay; both belonged to LTNP I group. The 19 other patients had more than 400 VC/mL at least one visit over the follow-up period.
Average plasma HIV RNA copy level in each LTNP group over the 10-year follow-up period. (•), LTNP I group (n = 12); (○), LTNP II group (n = 9).
Average plasma HIV RNA copy level in each LTNP group over the 10-year follow-up period. (•), LTNP I group (n = 12); (○), LTNP II group (n = 9).
Cellular viremia (performed on the last visit) was positive in all LTNPs of the study, except in the two individuals (nos. 4 and 12) having a plasma HIV RNA copy level lower than 400 VC/mL over the entire follow-up period. The mean cellular viremia of the LTNP I group and of the LTNP II group was 76.9 (range, 0 to 640) and 79.4 TCID 50 per million cells (range, 0.7 to 206), respectively (nonsignificant difference, P = .24). A positive correlation was observed between the cellular viremia and the plasma HIV RNA copy level determined at the last visit in LTNP I group (r = .67; P = .024), in LTNP II group (r = .71; P = .03) and in patients of both groups (r = .67; P = .01). Plasma viremia was negative in all 21 LTNPs but one (no. 19, Table 1).
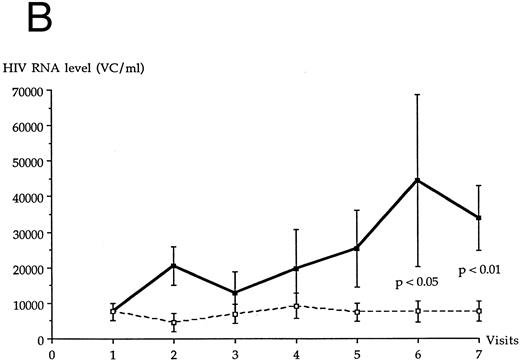
LTNP I group and LTNP II group were not statistically different at each visit for serum concentrations of p24 Ag and of ICD-p24 Ag. Figure 3A shows the appearance of a positive ICD-p24 Ag over time in patients of each LTNP group. At the end of the follow-up period, ICD-p24 Ag was positive in five individuals of LTNP I group and in three individuals of LTNP II group. As shown in Fig 3B, ICD-p24 Ag–positive patients from both LTNP groups had over the study period a plasma HIV RNA copy level higher than the patients negative for ICD-p24 Ag (difference was significant at the sixth and seventh visit; Fig 3B).
(A) Appearance of a positive ICD-p24 Ag over time in individual patients of each LTNP group. (•), Individual patients in LTNP I group; (○), individual patients in LTNP II group. (B) Plasma HIV RNA copy level in LTNPs negative for ICD-p24 Ag (n = 13) and in LTNPs positive for ICD-p24 Ag (n = 8). (▪), ICD-p24 Ag-positive patients (n = 8); (□), ICD-p24 Ag-negative patients (n = 13).
(A) Appearance of a positive ICD-p24 Ag over time in individual patients of each LTNP group. (•), Individual patients in LTNP I group; (○), individual patients in LTNP II group. (B) Plasma HIV RNA copy level in LTNPs negative for ICD-p24 Ag (n = 13) and in LTNPs positive for ICD-p24 Ag (n = 8). (▪), ICD-p24 Ag-positive patients (n = 8); (□), ICD-p24 Ag-negative patients (n = 13).
Immune Function
Anti-HIV Antibodies
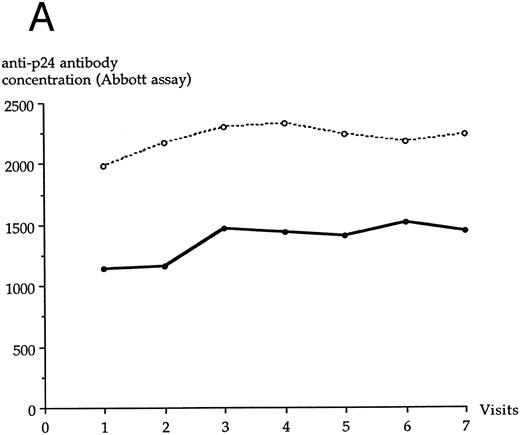
LTNP I group and LTNP II group were not statistically different at each visit for serum concentrations of anti-p24 antibody, as assayed through the Abbott assay (Fig 4A) or the SC/WB analysis (Fig 4B). No significant variation of anti-p24 antibody concentration was observed over the study period in LTNP I and in LTNP II groups. A decrease of anti-p24 antibody concentration was noted at the last visit in both groups through the SC/WB procedure and not through the Abbott assay.
Evolution of the serum anti-p24 antibody concentration over the study period through Abbott assay (A) and SC/WB (B) in each LTNP group. (•), LTNP I group (n = 12); (○), LTNP II group (n = 9).
Evolution of the serum anti-p24 antibody concentration over the study period through Abbott assay (A) and SC/WB (B) in each LTNP group. (•), LTNP I group (n = 12); (○), LTNP II group (n = 9).
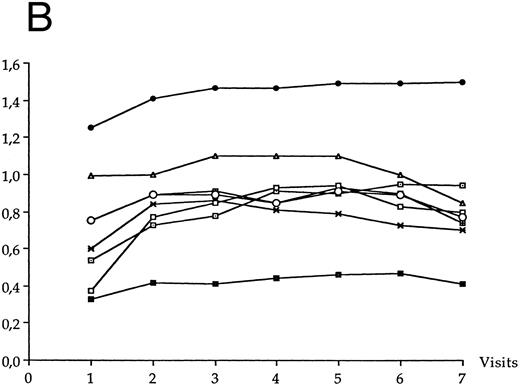
The mean concentrations of each of the other anti-HIV antibodies at each visit of the follow-up period are shown in Fig 5A for LTNP I group and in Fig 5B for LTNP II group. The serum concentrations of anti-Gp120 antibody significantly increased over the follow-up period in LTNP I group (P = .01) and in LTNP II group (P = .008). The serum concentrations of anti-Gp160 antibody also significantly increased over the follow-up period in LTNP I group (P = .006) and in LTNP II group (P = .01). No significant variation of the concentration of the other anti-HIV antibodies was observed in either group over time.
Evolution of the serum anti-HIV antibody concentration over the study period in LTNP I group (A) and in LTNP II (B). (•), Gp160; (⊡), Gp120; (▪), Gp41; (✖), p66; (○), p55; (⊞), p51; (□), p31; (▵), p24.
Evolution of the serum anti-HIV antibody concentration over the study period in LTNP I group (A) and in LTNP II (B). (•), Gp160; (⊡), Gp120; (▪), Gp41; (✖), p66; (○), p55; (⊞), p51; (□), p31; (▵), p24.
A full Western blot pattern was more frequently observed in LTNP II group (6 out of 9) than in LTNP I group (2 out of 12) (P = .059). Over the whole follow-up period, two patients (belonging to LTNP I group) were missing more than one antibody (anti-Gp41, anti-p55, and anti-p24 in one; anti-p66 and anti-p51 in one).
For serum concentrations of β2M, neopterin, IgG, and IgA, LTNP I group and LTNP II group were not statistically different at each visit. Figure 6 shows the mean values of the four parameters at each visit in each LTNP group. Over the study period, individuals of LTNP I group presented a significant increase of serum concentrations of neopterin (P = .03) and of IgG (P = .006); the increase of serum β2M concentration was almost significant (P = .06). The individuals of LTNP II group presented over the same period a significant increase of serum concentrations of neopterin (P = .004), of β2M (P = .004) and of IgG (P = .012). The elevation of serum IgA concentration was not significant in each group.
Mean values of neopterin, β2M, IgG, and IgA concentrations in each LTNP group over the study period. (•), LTNP I group; (○), LTNP II group.
Mean values of neopterin, β2M, IgG, and IgA concentrations in each LTNP group over the study period. (•), LTNP I group; (○), LTNP II group.
CD8+ T-cell count.The evolution over time of the CD8+ T-cell count in each LTNP group is shown in Fig 1B. A significant increase of CD8+ T-cell count was observed over time in LTNP I group (P < .02) and in LTNP II group (P < .04). At the first visit, the mean CD8+ T-cell count of group I LTNPs and of group II LTNPs was 690 ± 222 per μL and 433 ± 199 per μL, respectively (significant difference, P = .028). The difference of mean CD8+ T-cell count was no longer significant between both LTNP groups after the second visit until the end of the study.
Individualization of True LTNPS
Among the individuals of both LTNP groups, only two (0.8% of the whole cohort) had no positive marker of disease progression over the entire follow-up period; less than 400 VC/mL; p24 Ag negative before or after ICD; no decrease of anti-p24 antibody titer; and normal concentrations of IgG, IgA, β2M, and neopterin. Both belonged to LTNP I group (patients no. 4 and 12). On the last visit, plasma viremia and cellular viremia were negative in both. These two individuals were a 49-year-old homosexual man HIV-infected in 1983 and a 31-year-old woman HIV-infected through heterosexual contacts in 1984.
DISCUSSION
In defining LTNPs on a CD4+ T-cell count higher than 500 per μL over a 10-year period, a distinct subgroup of HIV-infected individuals, characterized by a CD4+ T-cell count less elevated but remaining particularly stable over the same period, could be unrecognized LTNPs. In our study, the patients belonging to the LTNP II group did not significantly differ from the patients of LTNP I group for the main markers studied. The general biological trend of disease progression was the same in both groups. Patients of the LTNP II group may have a CD4+ T-cell count lower than those of the LTNP I group before their HIV infection, but such an assumption is impossible to establish. The only significant biological differences between the two LTNP groups were the serum concentration of anti-p24 and the CD8+ T-cell count. However, though the more elevated concentration of anti-p24 antibody in LTNPs II suggests a milder disease progression in this group, the CD8+ T-cell count was higher in LTNPs I. A more elevated CD8+ T-cell count, when compared with progressors and HIV-uninfected individuals, has been reported in LTNPs.9,16 Indeed, strong CD8+ T-cell responses play an important role in maintaining an asymptomatic state in HIV infection.23
Until now, only transversal studies have been published on the biological parameters of HIV-infected individuals considered as LTNPs. Our longitudinal study indicates that such individuals failed to be virologically and immunologically homogeneous. In the San Francisco City Clinic Cohort,9 5% of HIV-positive individuals had more than 500 CD4+ T-cell per μL after at least 10 years of infection.9 With the same criteria of long-term nonprogression, we observe the same percentage of LTNPs in our cohort (4.8%). However, using criteria enclosing to all markers of disease progression, we found a weaker proportion of LTNPs (<1%). This data suggests that the true LTNPs constitute a smaller percentage of the HIV-infected population than previously estimated. Indeed, certain patients of our LTNP I group became positive for one or more biological predictors during the follow-up period and progressively increased their plasma viral load over time, which indicated a progression towards AIDS.11 12
Interestingly, the antibody response to envelope antigens was not initially at its highest concentration in both LTNP groups, but progressively increased during the follow-up period. A decrease in serum anti-p24 antibody concentration was observed in both groups at the end of the follow-up period through the SC/WB procedure but not through the Abbott assay. The discrepancy between the results of these two assays could be linked to a decrease of affinity of anti-p24 antibody for the Western blot antigen. Furthermore, certain anti-HIV antibodies failed to be detectable over the entire study period in some LTNPs. The explanation of this phenomenon is unknown.
Two individuals of the LTNP I group showed a plasma viral load below the limit of the quantitative assay over the entire follow-up period. Using other procedures of quantitation of HIV RNA copies, such as reverse PCR16 or branched-DNA assay,6 certain authors also identified some LTNPs as having a plasma viral RNA level too low to be detected. In these latter studies, however, the circulating viral load was determined only by a transversal manner, and all biological markers of disease progression were not determined. It is notewhorthy that, in our two patients, the undetectability of the plasma viral load over the study period was associated with the absence of other predictors, whereas in the other LTNPs the detectability of plasma HIV RNA load was always associated with an immunological and/or virological deterioration reflected by biological markers. The two LTNPs of our study showing a plasma viral load below the limit of the quantitative assay over the entire follow-up period probably have the best prognostic for the coming years. Longer follow-up of such patients will establish if they ever develop AIDS or if they represent the tail of a continuous distribution of latency periods of the disease. Indeed, the qualitative HIV RNA assay was positive in the two LTNPs negative for quantitative assay, suggesting that even they present an active and persisting viral replication.
The laboratory measures are consistent with a trend of progression towards AIDS in a large majority of LTNPs, even if they failed to be positive for certain surrogate markers of HIV infection. Such data are in accordance with the hypothesis that the virus replicates actively and progressively in lymphoid tissue during the whole symptomless carrying of the virus in all HIV-infected individuals.1-3
In conclusion, a new pattern of LTNPs can be drawn through stringent criteria based on all known markers of HIV disease progression. Even though this pattern appears to be relatively uncommon in HIV-positive populations, it still deserves continued intensive studies to understand what confers this long-term nonprogression.
Supported in part by the Paris American AIDS Committee (PAAC).
Address reprint requests to Jean-Jacques Lefrère, MD, PhD, Institut National de la Transfusion Sanguine, 53 Blvd Diderot, 75012 Paris, France.

