MAGNETIC RESONANCE (MR) imaging has become preferred over other imaging modalities in evaluating disease in the bone marrow.1 2 It is a noninvasive technique that complements bone marrow aspirations and biopsies by sampling a large volume of bone marrow and by providing information that aids the diagnosis, staging, and follow-up of hematologic malignancies.
The MR imaging appearance of the bone marrow depends on the presence and relative proportions of trabecular bone, fat, and water. Each of these constituents of the bone marrow produces a different MR signal. It is the summation of these signals that creates the final MR image. Because the bone marrow is a dynamic organ that changes continuously from birth through life, the MR appearance of the bone marrow varies with age. The predictable rate and patterns of red (hematopoietic) to yellow (fatty) marrow conversion and the unique characteristics of red and yellow marrow on MR images have allowed for the mapping of their age-related distributions in the skeleton.
Fatty replacement of the functioning hematopoietic marrow begins in the periphery of the appendicular skeleton and proceeds centrally (Fig 1). In the long bones, fatty marrow first appears in the diaphyses and epiphyses and later in the metaphyses.2-4 The adult pattern of red and yellow marrow distribution is reached in the early 20s; hematopoietic marrow remains throughout life in the spine, sternum, ribs, pelvis, skull, calcaneus, and proximal metaphysis of the humerus and femur. In the adult, the involution of active hematopoietic tissue gradually continues. Red to yellow marrow conversion may be diffuse or may occur in the form of isolated or confluent islands of fatty marrow (Fig 2).2,4 In the spine, Ricci et al4 described four distinct patterns of marrow distribution and reported the relative frequency of each pattern in different age groups.
Normal bone marrow in an 8-year-old child. Coronal T1-weighted (TR/TE, 600/11) MR image of the abdomen and pelvis shows persistent red marrow in the spine (arrows). Note bright signal of fatty marrow in the femoral epiphyses and apophyses (long arrows).
Normal bone marrow in an 8-year-old child. Coronal T1-weighted (TR/TE, 600/11) MR image of the abdomen and pelvis shows persistent red marrow in the spine (arrows). Note bright signal of fatty marrow in the femoral epiphyses and apophyses (long arrows).
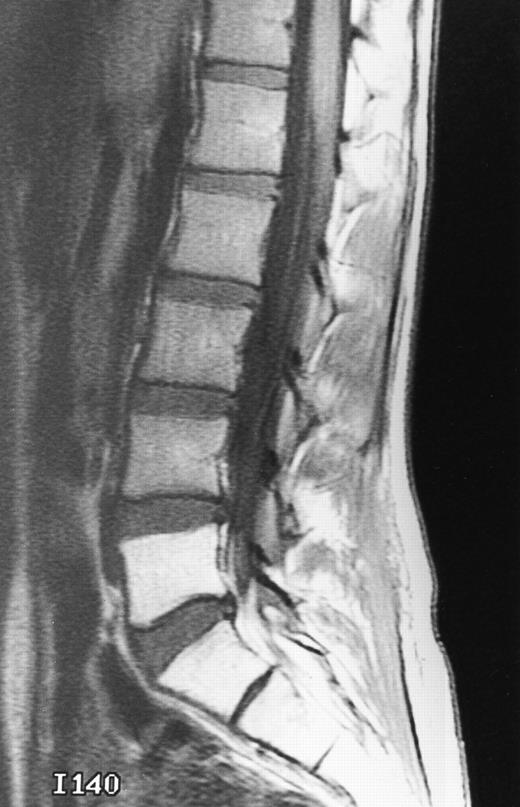
Normal appearance of spinal bone marrow in a 45-year-old woman: T1-weighted (500/11, TR/TE) (A) and T2-weighted, fat-suppressed fast spin echo (4000/96, TR/TE, ET 16) (B) sagittal MR images of the lumbar spine. Note increased signal of the vertebral bodies, relative to the intervertebral discs in (A) and increased deposition of fatty marrow around the basivertebral veins (arrowheads). On the T2-weighted image, normal intervertebral discs are brighter than the vertebral bodies; low signal in the L4-L5 and L5-S1 discs is due to degenerative changes (arrows).
Normal appearance of spinal bone marrow in a 45-year-old woman: T1-weighted (500/11, TR/TE) (A) and T2-weighted, fat-suppressed fast spin echo (4000/96, TR/TE, ET 16) (B) sagittal MR images of the lumbar spine. Note increased signal of the vertebral bodies, relative to the intervertebral discs in (A) and increased deposition of fatty marrow around the basivertebral veins (arrowheads). On the T2-weighted image, normal intervertebral discs are brighter than the vertebral bodies; low signal in the L4-L5 and L5-S1 discs is due to degenerative changes (arrows).
When there is a demand for additional hematopoiesis (stress, chronic anemia, extensive marrow replacement, etc), conversion of yellow to red marrow is initiated.2-7 The process of reconversion progresses in a reverse pattern relative to conversion. It may occur diffusely or focal areas of red marrow may appear in a background of fatty marrow.2 Knowledge of patterns and causes of marrow reconversion is important and may explain an unusual peripheral location of a pathologic process of the red marrow.3
MR IMAGING OF THE NORMAL MARROW
The MR signal depends on three parameters inherent to specific tissues: proton density, T1 relaxation time, and T2 relaxation time. By selecting the appropriate MR pulse sequence, we can enhance one of these tissue properties. Proton density images contribute little to the appearance of the bone marrow because proton densities of various tissues differ little. There are many MR sequences with specific uses in the study of the bone marrow.2 We will briefly discuss those sequences that are more frequently used in MR imaging of the bone marrow. All MR images shown were acquired with a 1.5 T unit.
T1-weighted images.On T1-weighted MR images, tissue contrast is determined primarily by T1 characteristics. Fat has a short T1 relaxation time and is hyperintense (bright) on T1-weighted images. Fatty marrow, because it is composed primarily of fat, has a characteristic bright signal, similar to that of subcutaneous fat (Figs 1 and 2). Water, on the other hand, has a long T1 relaxation time and is hypointense (dark) on T1-weighted images. Tissues rich in free water, such as cerebrospinal fluid, are dark on T1-weighted images. Red marrow is composed of 40% water, 40% fat, and 20% protein. On T1-weighted images, red marrow is considerably darker than fatty marrow and has a signal intensity similar to or slightly higher than muscle (Figs 1 and 2).2 The bright signal of fatty marrow facilitates the detection of marrow lesions, the vast majority of which have a longer T1 relaxation time than fat.2 However, marrow lesions may have similar T1 relaxation times to red marrow, and their detection on a background of hematopoietic marrow may be difficult with T1-weighted MR images alone.
T2-weighted images.Fat has a short T2 relaxation time, which means that, on T2-weighted images, in which T2 characteristics prevail, fat is dark and the signal intensity of fatty marrow decreases (Fig 2). Water has a long T2 relaxation time and is bright on T2-weighted images. The appearance of red marrow on T2-weighted MR images varies slightly.2 It usually shows a small increase in signal, becoming slightly brighter than muscle. The vertebral bodies on T2-weighted images are darker than the intervertebral discs, unless the discs are degenerated (Fig 2).
Fatty marrow is not readily distinguished from red marrow on T2-weighted images.2 However, because most marrow lesions are rich in free water, they are brighter than both red and yellow marrow on T2-weighted images and are easily detected.2 T2-weighted fast spin echo images have replaced conventional T2-weighted spin echo images in most institutions, because they offer comparable image quality at shorter imaging times.8 On T2-weighted fast spin echo images, fat is markedly brighter compared with conventional T2-weighted images; therefore, selective fat suppression is applied to fast spin echo T2-weighted images.
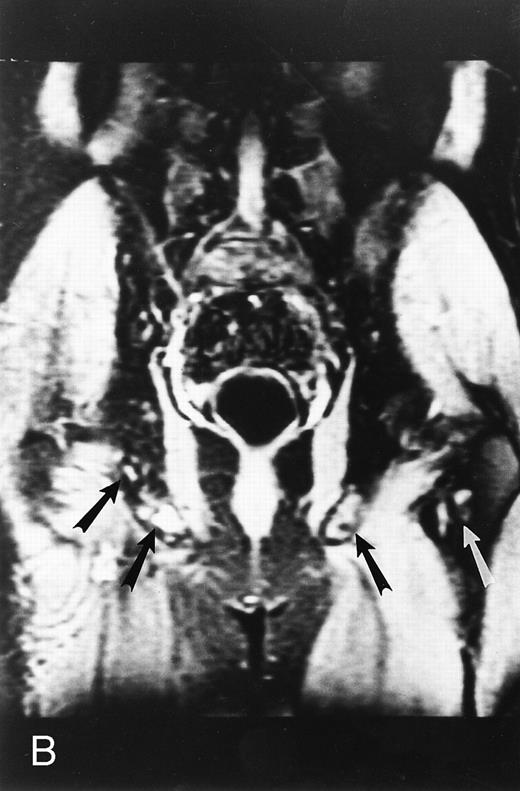
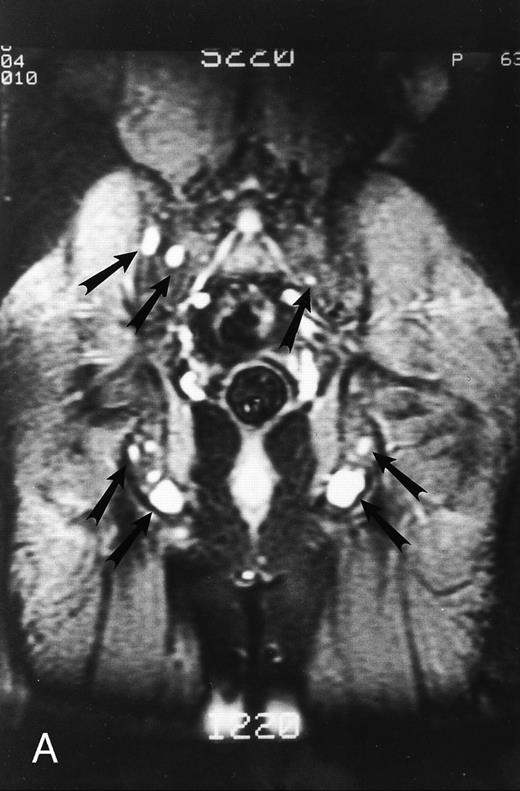
Short inversion-time-inversion-recovery (STIR) images.STIR sequences can be used to eliminate the signal from a selected tissue. In the spine, nulling of the signal of lipid protons allows for better visualization of cellular lesions, which appear bright on a dark background (Fig 3).8,9 STIR images have additive T1 and T2 characteristics, which means that tissues with long T1 and long T2 values will appear brighter on STIR than on T2-weighted spin echo images. Therefore, compared with spin echo T2-weighted images, STIR images provide greater contrast between pathology and uninvolved bone marrow.8,9 Although they have reduced signal-to-noise ratios, they are less prone to motion artifacts because the signal from fat is suppressed.9 STIR images offer equal lesion conspicuity compared with fat-suppressed, T2-weighted sequences, but image acquisition per unit of time is limited with the former.10 11 The chemical shift-selective fat suppression techniques used in fat-suppressed, T2-weighted fast spin echo images may cause field heterogeneity, particularly with large field-of-views. With large field-of-view coronal STIR images, the axial skeleton can be imaged almost entirely and the status of a large volume of the bone marrow can be assessed (Fig 3).
STIR images before and after bone marrow transplantation in a middle-aged man with multiple myeloma and a focal pattern of bone marrow involvement. Pretransplant STIR (2500/20/160, TR/TE/TI) coronal MR image of the pelvis (A) shows multiple bright foci (arrows) in the pelvic bones. Posttransplant STIR (2500/20/160, TR/TE/TI) image (B) shows a decrease in the size and number of the lesions. Courtesy of E.J.C. Angtuaco, MD (University of Arkansas for Medical Sciences, Little Rock, AR).
STIR images before and after bone marrow transplantation in a middle-aged man with multiple myeloma and a focal pattern of bone marrow involvement. Pretransplant STIR (2500/20/160, TR/TE/TI) coronal MR image of the pelvis (A) shows multiple bright foci (arrows) in the pelvic bones. Posttransplant STIR (2500/20/160, TR/TE/TI) image (B) shows a decrease in the size and number of the lesions. Courtesy of E.J.C. Angtuaco, MD (University of Arkansas for Medical Sciences, Little Rock, AR).
Contrast-enhanced T1-weighted images.In the adult, enhancement of normal marrow on MR images acquired after the intravenous administration of a gadolinium chelate is hardly perceptible on visual inspection and is easily differentiated from enhancement associated with marrow lesions (Figs 4 and 5).12,13 Enhanced MR images are particularly useful for the detection of diffuse marrow abnormality that may not be recognized on unenhanced MR images.14 They can also provide information on the status of the leptomeninges during the same examination and should be obtained whenever leptomeningeal disease is suspected. Postcontrast images do increase the cost and the duration of the MR study and should, therefore, be reserved for cases with unclear findings on the precontrast images. Precontrast and postcontrast T1-weighted images must be acquired and viewed with the same imaging parameters. Image subtraction and postcontrast T1-weighted images obtained with fat suppression facilitate the detection of abnormal enhancement.15 It should be noted that, in the developing spine, enhancement of the marrow may be marked because of prominent blood supply, increased marrow cellularity, and an extensive extravascular space that allows contrast to pool.13 In young children, care should be taken to avoid a diagnosis of a pathologic marrow state based solely on enhancement of the spinal marrow on MR images.
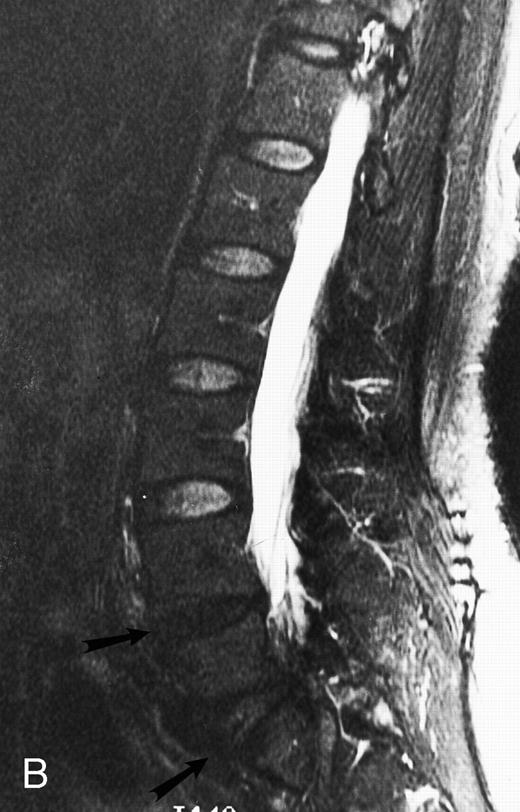
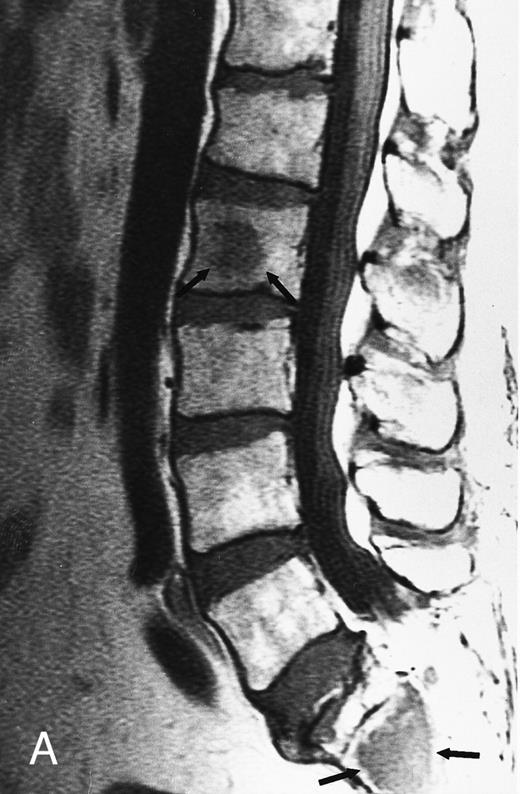
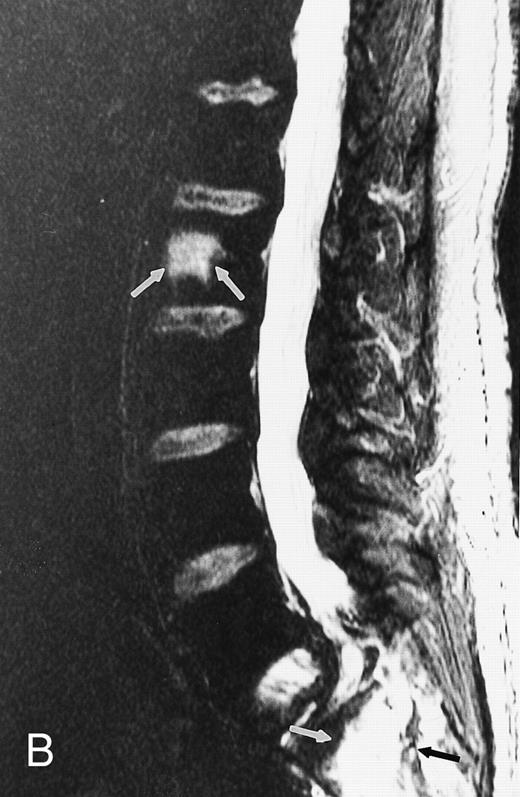
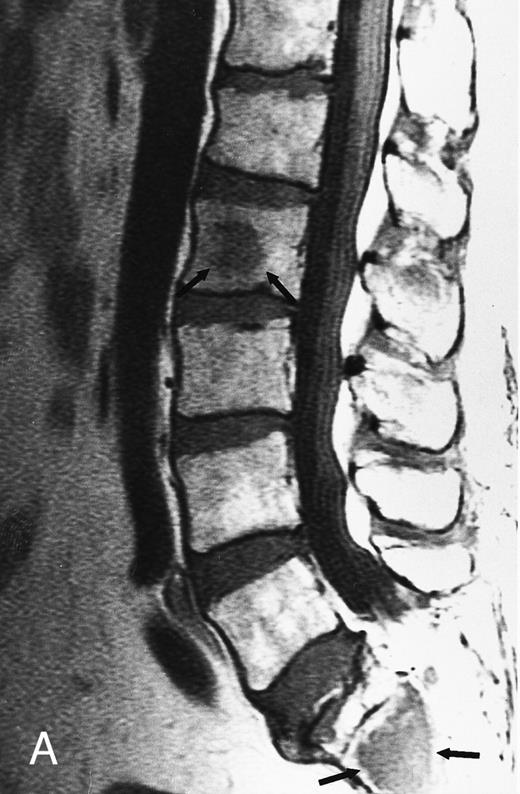
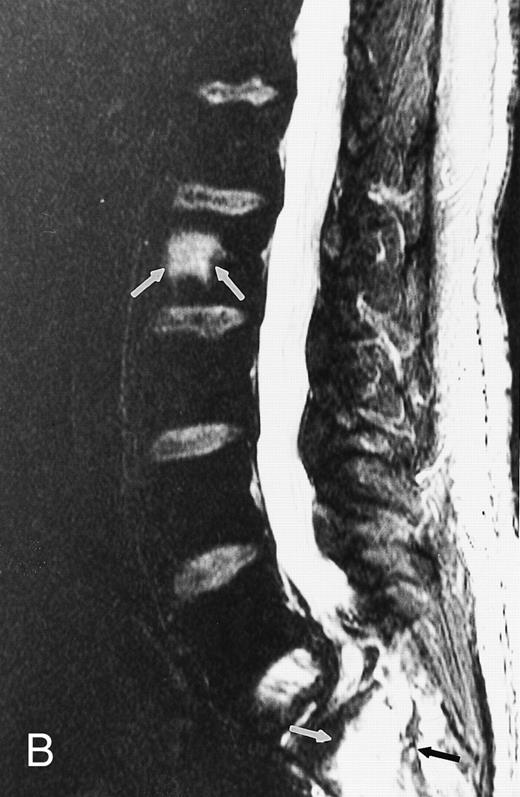
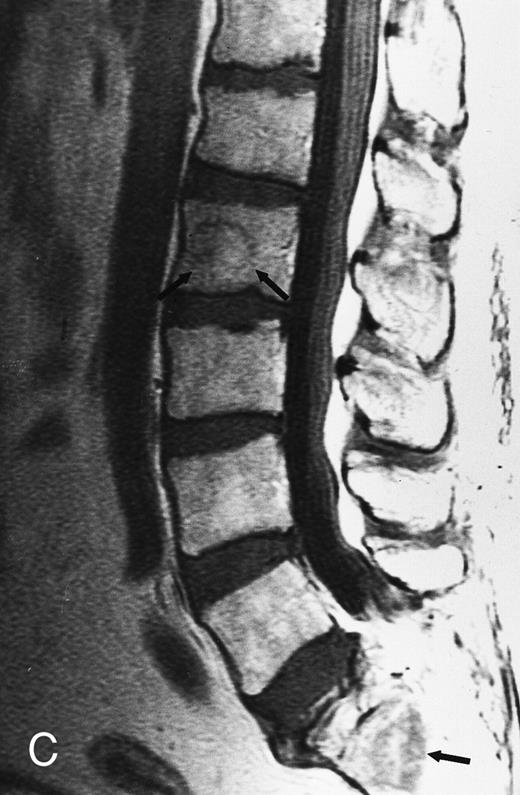
Focal MR pattern of abnormal marrow in a 48-year-old man with multiple myeloma: T1-weighted (500/10, TR/TE) (A), T2-weighted, fat-suppressed fast spin echo (5000/96, TR/TE, ET 16) (B), and enhanced T1-weighted (500/10, TR/TE) (C) sagittal MR images of the lumbar spine. Focal lesions (arrows) in L2 and S1 are dark in (A), bright in (B), and in (C) they enhance and become almost imperceptible from the uninvolved marrow.
Focal MR pattern of abnormal marrow in a 48-year-old man with multiple myeloma: T1-weighted (500/10, TR/TE) (A), T2-weighted, fat-suppressed fast spin echo (5000/96, TR/TE, ET 16) (B), and enhanced T1-weighted (500/10, TR/TE) (C) sagittal MR images of the lumbar spine. Focal lesions (arrows) in L2 and S1 are dark in (A), bright in (B), and in (C) they enhance and become almost imperceptible from the uninvolved marrow.
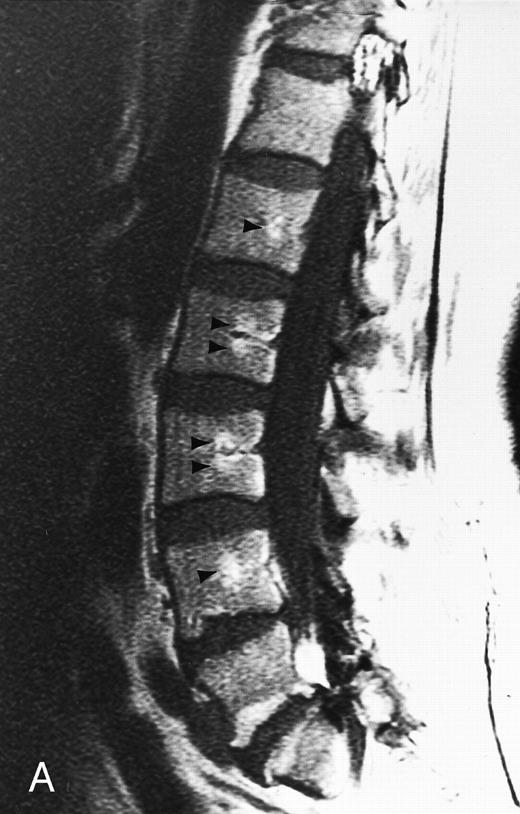
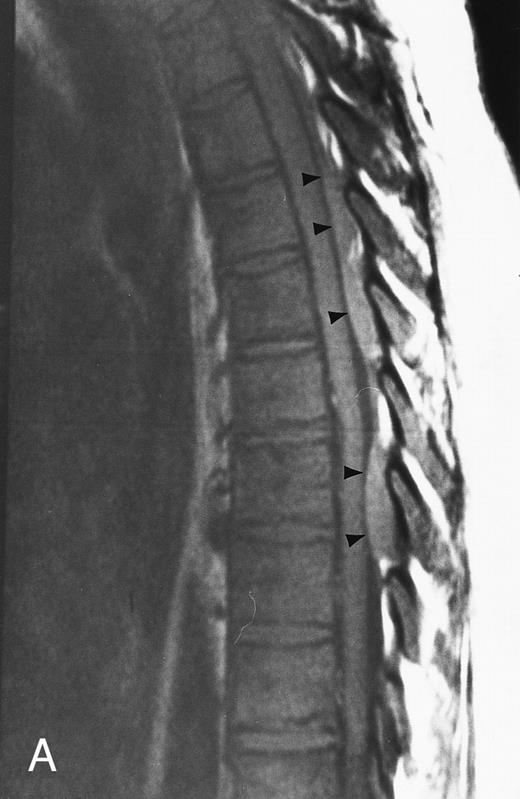
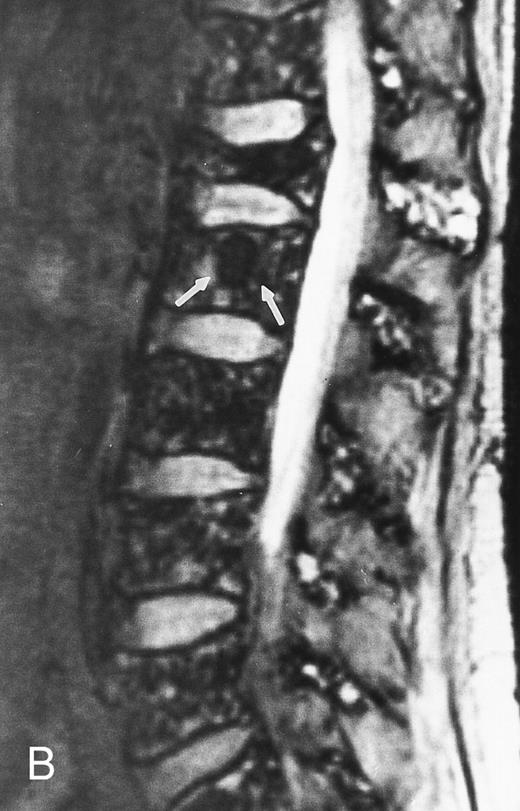
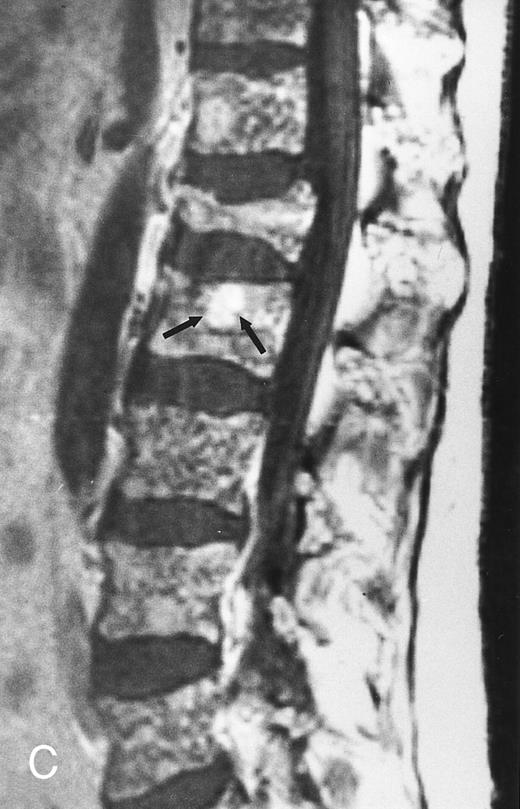
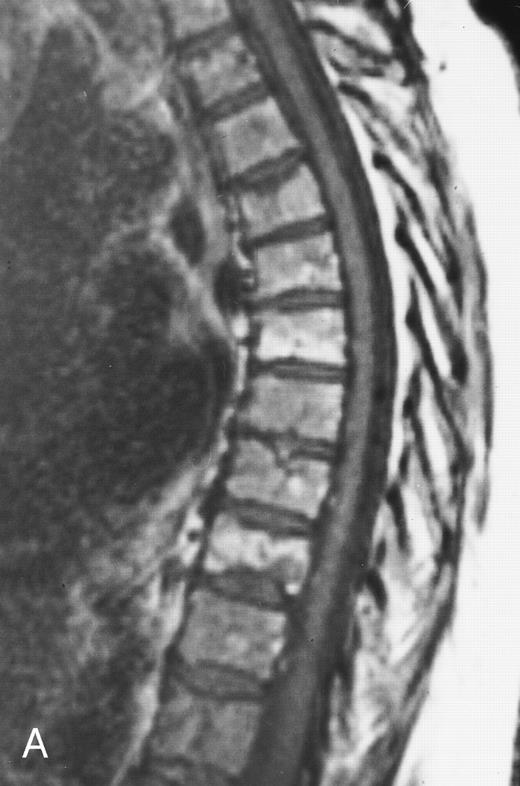
Diffuse MR pattern of abnormal marrow in a 29-year-old man with AML: T1-weighted sagittal (500/10, TR/TE) (A), T2-weighted, fat-suppressed fast spin echo sagittal (5000/96, TR/TE, ET 16) (B), and enhanced T1-weighted sagittal (500/10, TR/TE) (C) MR images of the thoracic spine. The abnormal vertebral bodies in (A) are dark and isointense to the intervertebral discs and in (B) they become bright. In (C), the abnormal marrow enhances and the vertebrae become brighter than the discs. Note extraosseous mass (arrowheads) in the posterior epidural space with preservation of the bony cortex.
Diffuse MR pattern of abnormal marrow in a 29-year-old man with AML: T1-weighted sagittal (500/10, TR/TE) (A), T2-weighted, fat-suppressed fast spin echo sagittal (5000/96, TR/TE, ET 16) (B), and enhanced T1-weighted sagittal (500/10, TR/TE) (C) MR images of the thoracic spine. The abnormal vertebral bodies in (A) are dark and isointense to the intervertebral discs and in (B) they become bright. In (C), the abnormal marrow enhances and the vertebrae become brighter than the discs. Note extraosseous mass (arrowheads) in the posterior epidural space with preservation of the bony cortex.
A standard MR imaging protocol for the bone marrow may include coronal STIR images of the spine and pelvis and sagittal T1-weighted and fat-suppressed, T2-weighted fast spin echo or STIR sagittal images of the spine. Axial and contrast-enhanced T1-weighted images may be acquired as needed.
MR IMAGING OF THE ABNORMAL MARROW
There are three MR patterns of abnormal marrow that reflect different types of histologic infiltration of the bone marrow.2,14 The focal pattern consists of localized areas of abnormal marrow (Fig 4). This pattern is often observed in metastatic disease from solid primary malignancies.2 On T1-weighted images, focal lesions are darker than yellow marrow and slightly darker or isointense to red marrow. On T2-weighted images they are brighter than both red and yellow marrow, and on enhanced T1-weighted images they enhance to various degrees depending on the vascularity of the underlying pathologic process.2,12 STIR and fat-saturation T2-weighted images provide increased contrast between focal lesions and uninvolved marrow.8-11
In the diffuse MR pattern of abnormal marrow, the normal bone marrow is completely replaced by the abnormal process (Fig 5).14 The intervertebral discs appear brighter or isointense to the diseased marrow. This pattern is typical for the acute leukemias. On T1-weighted images, there is a diffuse decrease in the signal intensity of the marrow. In young adults, a diffuse MR pattern may be difficult to differentiate from pure hematopoietic marrow on T1-weighted images. On T2-weighted images of diffuse patterns of marrow involvement, a variable increase in the signal intensity of the abnormal marrow is observed. This increase in signal may be difficult to appreciate because there is no normal marrow for comparison. After the administration of intravenous contrast, the abnormal marrow enhances.14 The intervertebral discs appear darker than the enhanced spine. The presence of enhancement is easily appreciated when direct comparison with the precontrast T1-weighted MR images is made.14
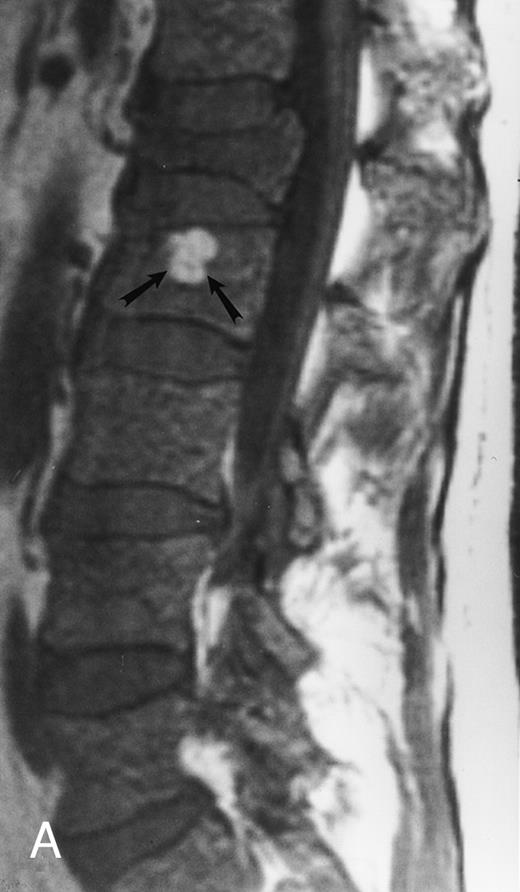
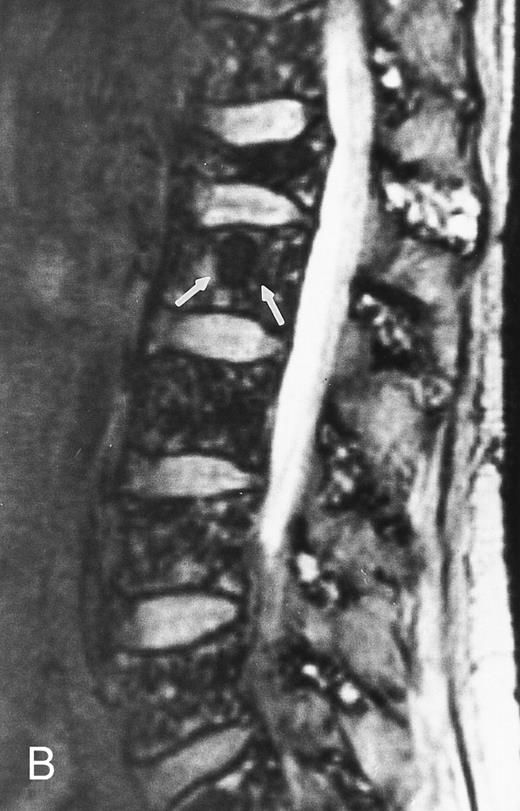
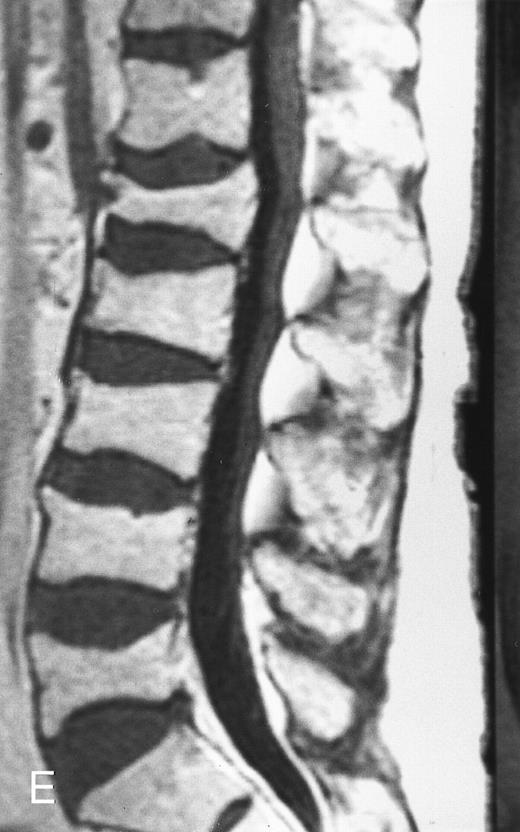
The variegated pattern consists of innumerable small foci of disease on a background of intact marrow (Fig 6).14 The small lesions of the variegated pattern are dark on T1-weighted images and bright on T2-weighted images, and they enhance after the administration of intravenous contrast.
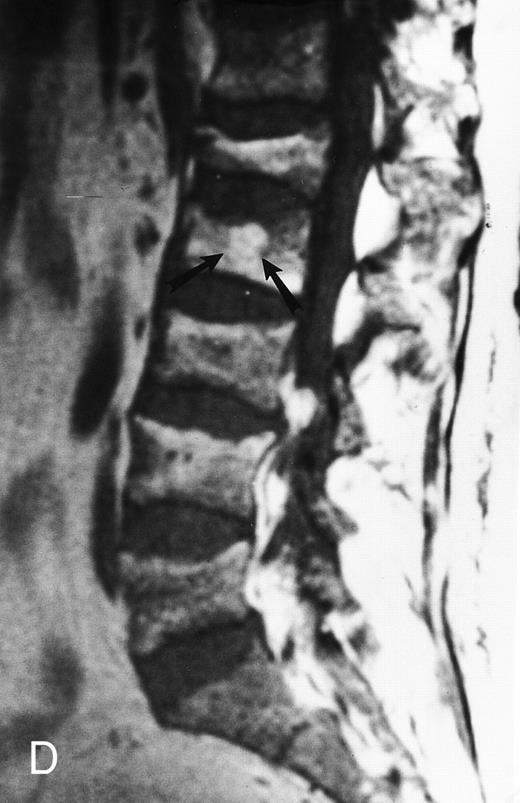
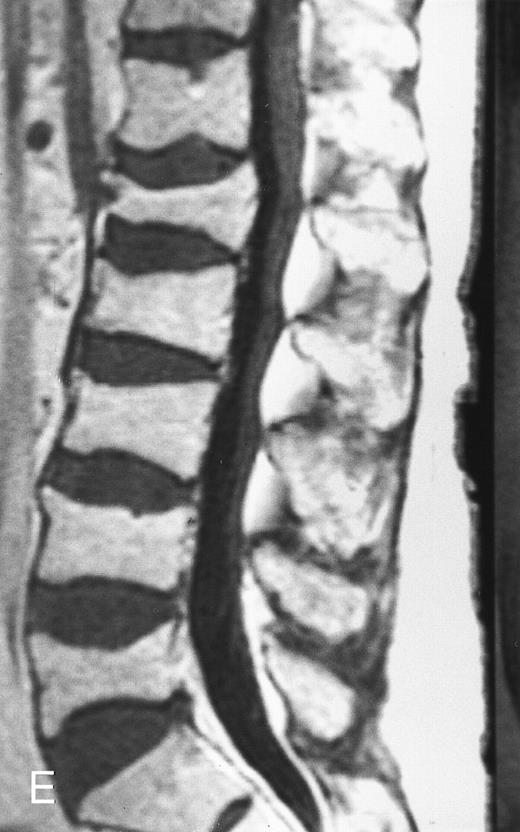
Variegated MR pattern of abnormal marrow in a 45-year-old man with multiple myeloma: T1-weighted (600/20, TR/TE) (A), relatively T2-weighted gradient recalled echo (650/20, TR/TE, flip angle 20°) (B), and enhanced T1-weighted (600/20, TR/TE ) (C) sagittal MR images of the lumbar spine show multiple tiny foci of marrow involvement. Arrows point to island of normal fatty marrow. Sagittal T1-weighted (600/20, TR/TE) MR image 6 months after initiation of chemotherapy (D) shows reappearance of fatty marrow in the spine. Note development of multiple vertebral collapses. T1-weighted MR image 1 year after bone marrow transplantation and total body irradiation (600/20, TR/TE) (E) shows resolution of marrow abnormality and homogeneous bright signal of fatty marrow in the lumbar spine. Note progression of compression fractures. Reprinted with permission from Moulopoulos et al.14,21
Variegated MR pattern of abnormal marrow in a 45-year-old man with multiple myeloma: T1-weighted (600/20, TR/TE) (A), relatively T2-weighted gradient recalled echo (650/20, TR/TE, flip angle 20°) (B), and enhanced T1-weighted (600/20, TR/TE ) (C) sagittal MR images of the lumbar spine show multiple tiny foci of marrow involvement. Arrows point to island of normal fatty marrow. Sagittal T1-weighted (600/20, TR/TE) MR image 6 months after initiation of chemotherapy (D) shows reappearance of fatty marrow in the spine. Note development of multiple vertebral collapses. T1-weighted MR image 1 year after bone marrow transplantation and total body irradiation (600/20, TR/TE) (E) shows resolution of marrow abnormality and homogeneous bright signal of fatty marrow in the lumbar spine. Note progression of compression fractures. Reprinted with permission from Moulopoulos et al.14,21
MR imaging of the bone marrow has been particularly studied in patients with hematologic malignancies. Large field-of-view coronal STIR images of the axial skeleton and T1-weighted and fat-suppressed, T2-weighted fast spin echo, or STIR sagittal images of the spine are recommended for the initial evaluation of the bone marrow. Axial images should be acquired to evaluate the extent of extraosseous masses. Enhanced images may be obtained in selected cases when findings on the first two sequences are unclear. The indications, the findings, and the uses of MR imaging will be discussed separately for the most common hematologic malignancies.
PLASMA CELL DYSCRASIAS
Plasma cell dyscrasias are a heterogeneous group of clinical disorders characterized by the production of a specific Ig molecule that is unique for each patient. The role of MR imaging has been evaluated in each one of these disorders.
Solitary bone plasmacytoma.Approximately 2% of patients with plasma cell dyscrasias have a solitary bone plasmacytoma.16 The diagnosis of solitary bone plasmacytoma requires histologic evidence of plasma cell infiltration at a single bony site, absence of clonal plasma cells at distant bone marrow sites, and a normal bone survey elsewhere. Although definitive radiotherapy with approximately 45 Gy usually eradicates the local disease, the majority of patients who present with solitary bone plasmacytoma will develop multiple myeloma.16-18 Progression to systemic disease in patients with solitary bone plasmacytoma has been attributed to growth of previously occult disease.
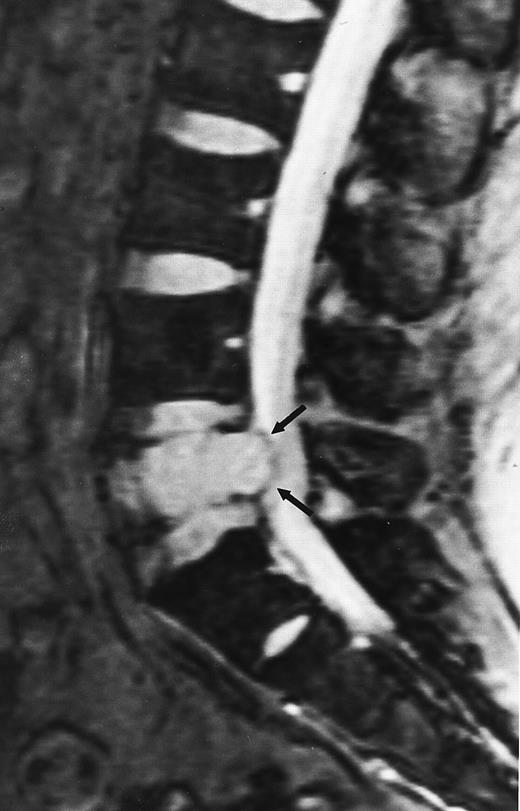
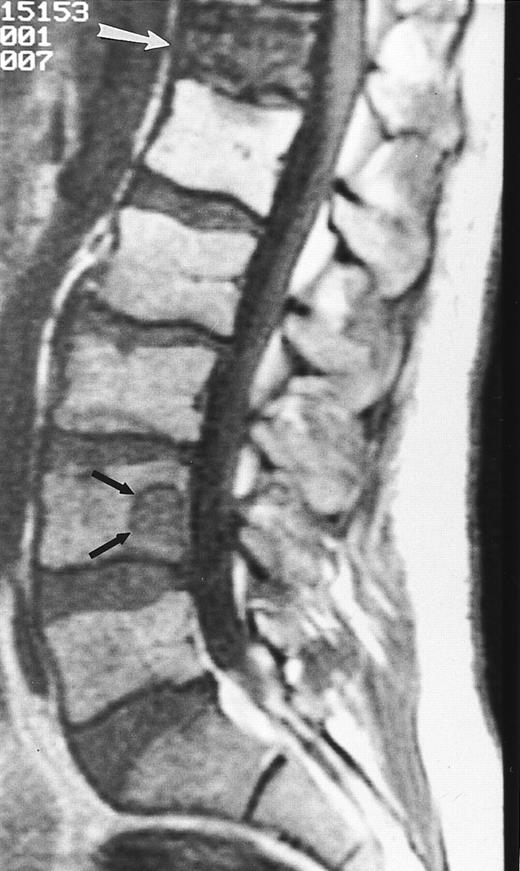
MR imaging, with its superior contrast resolution, is the preferred imaging modality for the initial assessment and for the follow-up of the osseous and extraosseous extent of a solitary bone plasmacytoma (Fig 7). The results of early studies on the role of MR imaging in the initial clinical staging of solitary bone plasmacytoma are promising. One study showed unsuspected lesions on spinal MR images in 4 of 12 patients with the diagnosis of solitary bone plasmacytoma (Fig 8).19 Three of these patients developed systemic disease within 18 months from diagnosis. Another group of investigators reported similar findings in four of six patients with the diagnosis of solitary plasmacytoma of the bone.20 Whether such patients would benefit from early initiation of treatment for multiple myeloma is not known and requires further study. MR imaging should be part of the staging procedures in patients with solitary bone plasmacytoma to better assess the local extent of the tumor and define the radiation portals and to search for other, unanticipated foci of disease. Because of the increased cost of the modality, the study may be limited to the spine, where most lesions occur. T1- and T2-weighted fat-suppressed fast spin echo or STIR sagittal images usually suffice for a screening examination. The addition of coronal large field-of-view images of the axial skeleton may increase the yield of positive exams.
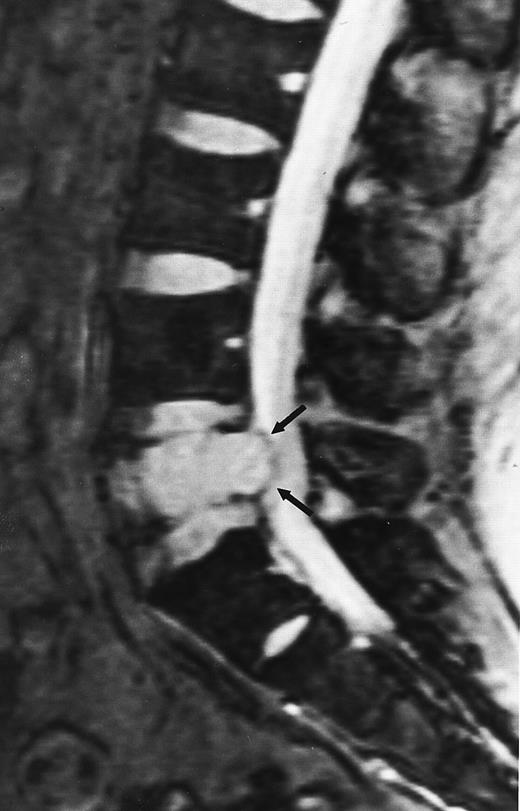
A 38-year-old man with solitary plasmacytoma of L5. Relatively T2-weighted gradient recalled echo (400/21, TR/TE, flip angle 20°) sagittal MR image of the lumbar spine shows bright signal of mass in L5 and extension of tumor into the spinal canal (arrows) with impingement of the thecal sac.
A 38-year-old man with solitary plasmacytoma of L5. Relatively T2-weighted gradient recalled echo (400/21, TR/TE, flip angle 20°) sagittal MR image of the lumbar spine shows bright signal of mass in L5 and extension of tumor into the spinal canal (arrows) with impingement of the thecal sac.
A 38-year-old man with solitary bone plasmacytoma and unsuspected lesions on MR images. Sagittal T1-weighted (600/20, TR/TE) MR image of the spine shows primary tumor in T12 (arrow) and additional focus of disease in L4 (short arrows). Conventional radiographs and CT scans failed to show the lesion in L2. Note characteristic postradiation bright signal in L1.
A 38-year-old man with solitary bone plasmacytoma and unsuspected lesions on MR images. Sagittal T1-weighted (600/20, TR/TE) MR image of the spine shows primary tumor in T12 (arrow) and additional focus of disease in L4 (short arrows). Conventional radiographs and CT scans failed to show the lesion in L2. Note characteristic postradiation bright signal in L1.
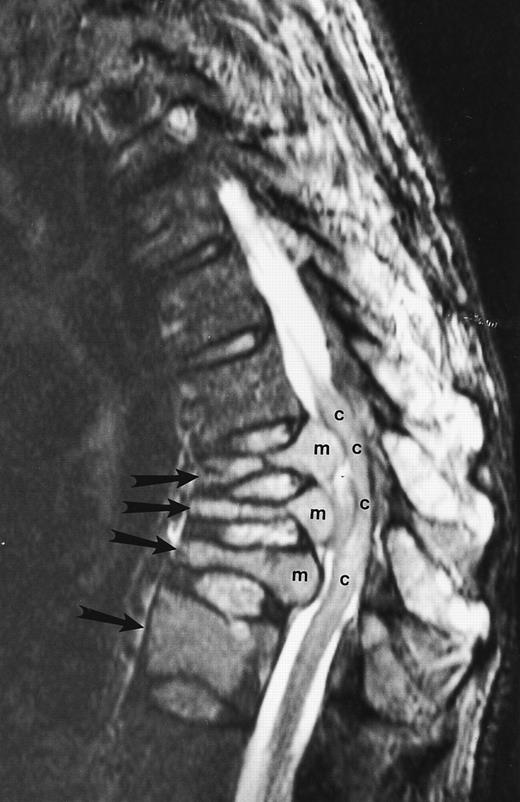
Multiple myeloma.A well-recognized contribution of MR imaging in the management of patients with multiple myeloma is the evaluation of patients with neurologic symptoms. Extraosseous mass from lytic lesions in the spine can enter the spinal canal and compress the spinal cord. Prompt intervention is necessary to prevent permanent neurologic deficits. MR images of the spine can accurately assess the level and the extent of cord compression in less than 5 minutes (Fig 9).
An 82-year-old man with multiple myeloma and cord compression. T2-weighted, fat-suppressed fast spin echo (5000/96, TR/TE, ET16) sagittal MR image of the thoracic spine shows abnormal signal in several compressed vertebral bodies (arrows). The spinal cord (c) is severely compressed by epidural mass (m).
An 82-year-old man with multiple myeloma and cord compression. T2-weighted, fat-suppressed fast spin echo (5000/96, TR/TE, ET16) sagittal MR image of the thoracic spine shows abnormal signal in several compressed vertebral bodies (arrows). The spinal cord (c) is severely compressed by epidural mass (m).
Vertebral compression fractures are often present at diagnosis or develop during the course of multiple myeloma.14,21 Recently, an increased incidence of spinal compression fractures was reported in patients with myeloma and more than 10 focal lesions or diffuse patterns of involvement on bone marrow MR images of the spine.22 Although MR imaging identified patients at high risk for development of spinal collapses, it could not predict the level of spinal collapse.22
The appearance of new or progressive compression fractures during or after treatment for multiple myeloma does not necessarily imply local progression of the disease.21 Resolution of the tumor may cause collapse of the unsupported vertebral body (Fig 6). Differentiation of a malignant from a benign fracture with conventional radiographs or computed tomography (CT) images can be very difficult unless overt signs of malignancy are present. MR imaging is the procedure of choice for the determination of the etiology of vertebral collapses. The MR imaging features of benign and malignant compression fractures are discussed further on.
Lytic bone lesions or demineralization occur at presentation in more than 80% of patients with multiple myeloma. Radiographic bone surveys have been part of the staging system for multiple myeloma for the last 20 years.23 However, it should be recognized that, when a lytic lesion becomes evident on a conventional bone radiograph, more than 50% of bone loss has occured. In a study by Staebler et al,24 55% of patients with focal MR patterns of multiple myeloma and 50% of patients with diffuse MR patterns of multiple myeloma did not have lytic lesions on bone radiographs. The range of abnormal MR studies in patients with multiple myeloma varies from 50% for patients with indolent disease to 100% for patients with symptomatic disease.24-27
All three MR patterns of abnormal marrow have been observed in patients with multiple myeloma (Figs 4, 5, and 6).14,25-29 The focal lesion pattern is more frequently observed than the other two and is more often associated with lytic lesions on bone radiographs.14 It is interesting to note that, in a recent series, only 12 (18%) of 66 focal myelomatous lesions on spinal MR images had corresponding lytic lesions on skeletal surveys.14 The increased incidence of positive bone surveys in patients with focal MR patterns can be attributed to focal growth of dense plasma cell aggregates that produce local bone destruction.
Diffuse marrow involvement occurs in 25% of patients with multiple myeloma.14 This pattern has been associated with lower hemoglobin values and higher percentages of bone marrow plasmacytosis.14 The association of the diffuse MR pattern with more advanced disease supports an earlier report of a shorter survival rate for patients with multiple myeloma and negative bone radiographs.14,30 In that study, Smith et al30 proposed that a more diffuse involvement of the bone marrow may account for the poor prognosis of their patients with negative skeletal surveys. Correlation of the levels and the activity of several cytokines (interleukin-6, interleukin-1α, tumor necrosis factor, etc, which are implicated in the process of bone destruction in myeloma) with the MR patterns of multiple myeloma may help explain the different fashions of spread of the disease. Before the prognostic significance of the MR patterns of marrow involvement in myeloma is established, further studies with a long-term follow-up need to be performed.
Approximately 15% of patients who have multiple myeloma are free of symptoms when diagnosis is made after screening examinations show increased serum protein levels or mild anemia.31 Patients with asymptomatic, low tumor mass myeloma are observed without treatment until there is evidence of disease progression.31 A prospective study with 38 patients with asymptomatic myeloma of low tumor mass and negative skeletal surveys showed that 19 (50%) patients had evidence of marrow involvement on spinal MR images.25 A similar analysis by Vande Berg et al32,33 showed involvement of the bone marrow on MR images in 29% of patients with stage I myeloma and in 19% of 35 patients with monoclonal gammopathy of undetermined significance (MGUS). The same investigators observed 37 patients with MGUS for a mean of 31 months: 4 of 7 patients with abnormal MR studies at diagnosis and none of 30 patients with normal initial MR studies showed evolutive disease at follow-up.33 Abnormalities on MR images and the presence of Bence Jones protein in the urine were the only two parameters predictive of disease progression. Even when the tumor burden is very low, MR imaging may detect occult foci of myelomatous involvement and may predict a more precarious course of the disease.
Analysis of the prognostic significance of a positive MR study in patients with asymptomatic myeloma showed that an abnormal MR study of the spine identified patients with significantly shorter time to disease progression (median, 16 months) when compared with patients with normal MR studies, who progressed at a median of 43 months.31 The prognostic value of an abnormal MR study was found to be independent of the presence or absence of standard adverse prognostic factors for asymptomatic multiple myeloma.31,32 Furthermore, the pattern of marrow involvement on MR images appeared to have a prognostic significance; patients with a diffuse or a focal MR pattern showed a tendency to progress earlier than patients with a variegated pattern.31 Recently, a longitudinal study with 101 patients with asymptomatic myeloma showed that MR imaging of the spine was abnormal in 40% of patients with one adverse feature for progression to symptomatic myeloma and with an intermediate time to disease progression (median, 39 months).34 In this particular group of patients, abnormal MR images helped identify those patients at risk for imminent complications. It seems that early institution of chemotherapy in selected patients with asymptomatic disease may be justified to reduce morbidity among patients with myeloma at high risk for disease progression.
Another application of MR imaging is the assessment of the status of multiple myeloma after the initiation of treatment. Changes in the abnormal marrow after successful treatment differ for each MR pattern and knowledge of these changes is necessary to interpret posttreatment MR images.21,35,36 Our study of 20 patients with multiple myeloma who achieved a complete or partial response to treatment and who had pretreatment and posttreatment MR studies of the spine showed that patterns of complete response included resolution of marrow abnormality or persistent abnormality without enhancement or with peripheral rim enhancement only.21 Conversion of a diffuse to a variegated or focal MR pattern and a decrease in the extent of marrow abnormality with persistent homogeneous enhancement was observed in patients who achieved a partial response.21
In the posttreatment evaluation of patients with multiple myeloma, MR images of the bone marrow may provide important information for patients with equivocal clinical and laboratory findings or for patients with nonsecretory disease.
WALDENSTROM MACROGLOBULINEMIA
Waldenstrom macroglobulinemia is a low-grade lymphoid malignancy characterized by infiltration of the bone marrow, lymph nodes, and spleen by abnormal lymphoplasmacytoid cells.37 We found evidence of marrow involvement on the MR images of 91% of 23 patients with Waldenstrom disease (Fig 10).38 Duhem et al39 found MR abnormalities in all studied patients with macroglobulinemia. In contrast to patients with multiple myeloma, a focal MR pattern was not observed in patients with macroglobulinemia.38 This observation is in keeping with the rarity of lytic bone lesions in this disease. The diffuse and variegated MR patterns in Waldenstrom disease do not differ from those observed in multiple myeloma and reflect a more dispersed spread of the malignant cells in the bone marrow compared with focal MR patterns.
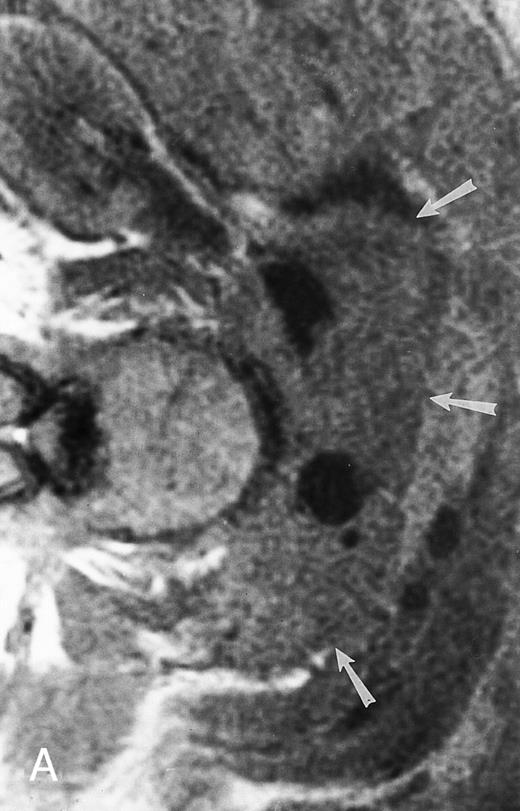
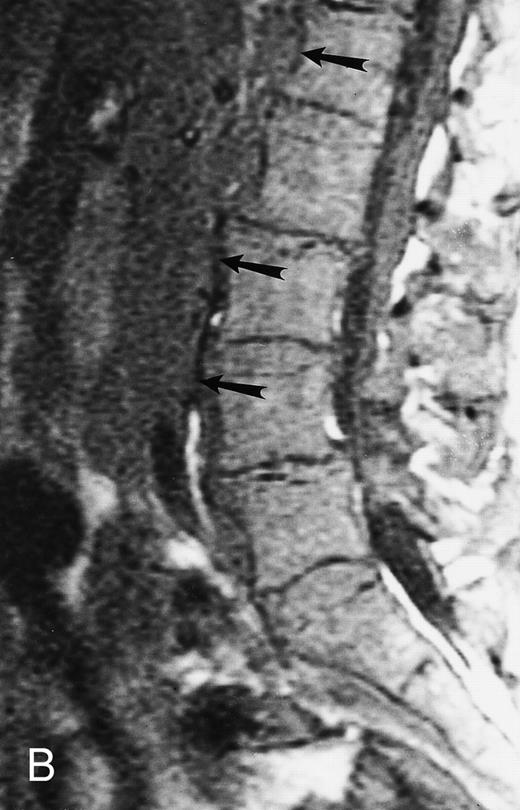
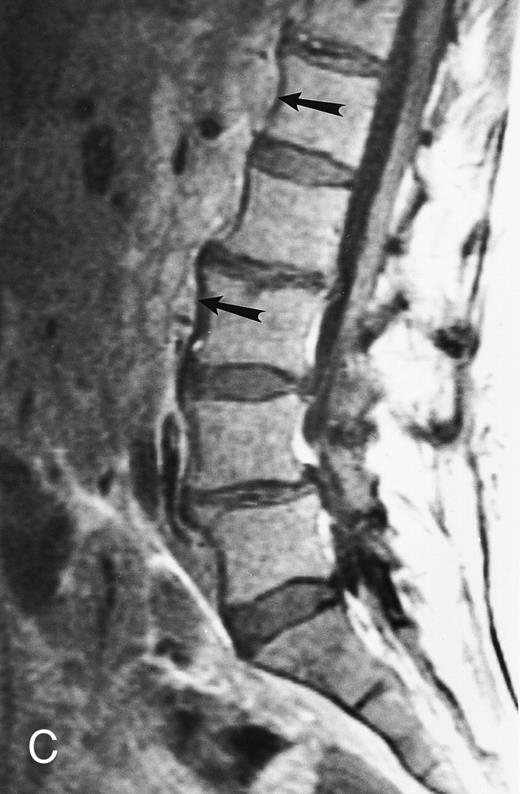
A 75-year-old woman with Waldenstrom macroglobulinemia: T1-weighted (600/20, TR/TE) axial (A) and sagittal T1-weighted (600/20, TR/TE) precontrast (B) and postcontrast (C) MR images of the lumbosacral spine. Note diffuse pattern of marrow infiltration and enlarged retroperitoneal lymph nodes (arrows). The abnormal marrow is isointense to the intervertebral discs on the precontrast image and enhances markedly becoming hyperintense to the discs on the postcontrast image.
A 75-year-old woman with Waldenstrom macroglobulinemia: T1-weighted (600/20, TR/TE) axial (A) and sagittal T1-weighted (600/20, TR/TE) precontrast (B) and postcontrast (C) MR images of the lumbosacral spine. Note diffuse pattern of marrow infiltration and enlarged retroperitoneal lymph nodes (arrows). The abnormal marrow is isointense to the intervertebral discs on the precontrast image and enhances markedly becoming hyperintense to the discs on the postcontrast image.
A statistically significant relationship was shown between grades of contrast uptake by the abnormal marrow on enhanced MR images and values of hemoglobin and lymphoplasmacytoid infiltration indices of the bone marrow.38 Increasing grades of contrast uptake on enhanced MR images correlated with increasing tumor burden. A direct correlation was found between decreased enhancement of the marrow on posttreatment MR images and degree of clinical response.38 The application of quantitative analysis of the involvement of the marrow on MR images to the assessment of response to therapy in patients with macroglobulinemia may be of value in individual problem cases.
LYMPHOPROLIFERATIVE DISORDERS
Infiltration of the bone marrow occurs in 5% to 15% of patients with Hodgkin's disease and in 25% to 40% of patients with non-Hodgkin's lymphoma.40 The diagnosis of bone marrow involvement is established with bone marrow biopsies, which are usually obtained from the posterior superior iliac crest. Sampling errors exist even with bilateral iliac crest biopsies, because only a small volume of the bone marrow is examined.41 A 20% discordance between bilateral iliac crest bone marrow biopsies reflects the patchy nature of bone marrow infiltration that occurs in the lymphomas.41 42 Bone marrow scintigraphy with several radiopharmaceutical agents can show an increase in hematopoiesis or defects at sites of bone marrow infiltrates, but it is limited by poor spatial resolution and lack of specificity.
MR imaging is a noninvasive technique that can assess the status of large volumes of bone marrow. In patients with lymphoma, MR imaging has been shown to be superior to bone marrow scintigraphy in the evaluation of the bone marrow.40,43 Shields et al43 reported positive biopsy results in 10% and positive results with scintigraphy in 29% and with MR images in 39% of 38 patients with Hodgkin's disease. They concluded that MR imaging combined with histologic examination of the bone marrow improves the evaluation of the bone marrow status and the staging of lymphoma.43 Smith et al44 found marrow involvement on the MR images of one third of their patients with lymphoma who had negative bone marrow biopsies. Tsunoda et al45 detected abnormalities in 52% of 56 patients with lymphoma who underwent MR imaging of the femoral marrow. Among patients with negative marrow biopsies (69%), a significantly poorer survival was shown for those patients with abnormal MR studies of the femoral marrow compared with patients with normal MR studies.45 The diagnostic yield of the bone marrow biopsy can be increased if the biopsy site is selected with the aid of MR images. Nevertheless, if marrow involvement is shown on skeletal MR images of patients with lymphoma, a clinical stage IV should be assigned to the patient.40 MR images can also direct harvest procedures for autologous bone marrow transplantation to sites of relatively uninvolved marrow.44
On T1-weighted MR images, lymphomatous involvement of the bone marrow is seen as diffuse, primarily heterogeneous replacement of the marrow and less frequently as focal marrow lesions (Figs 11 and 12).43,46 47 On T2-weighted images, the signal of the abnormal marrow increases, and on T1-weighted images after the intravenous administration of contrast, the abnormal marrow enhances. The MR patterns of lymphomatous involvement of the bone marrow may be indistinguishable from similar patterns in myeloma, leukemia, and other malignant or benign diseases of the bone marrow. MR imaging cannot differentiate between the different histologic subtypes of lymphoma.
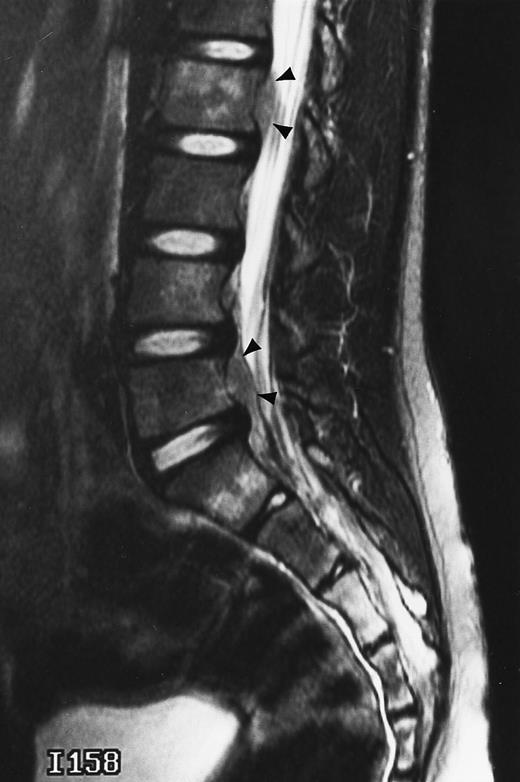
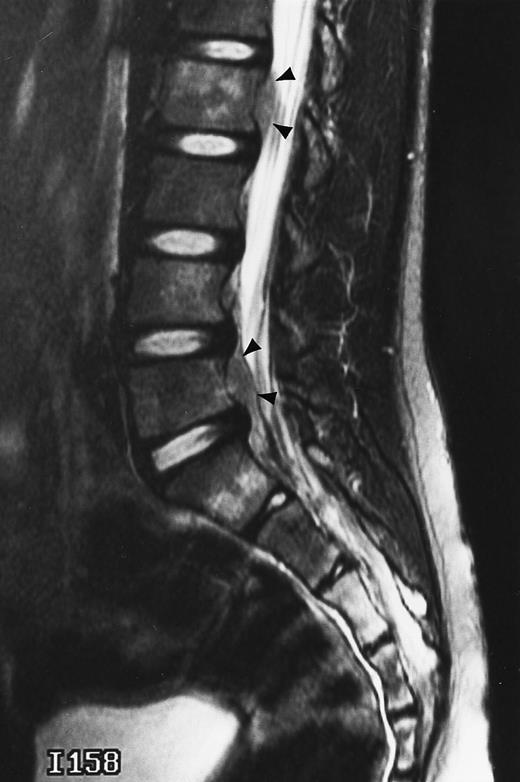
An 8-year-old boy with Burkitt's lymphoma and diffuse marrow involvement. Fat-suppressed, T2-weighted fast spin echo (3000/96, TR/TE) sagittal MR image of the lumbar spine shows heterogeneous signal intensity of the bone marrow and epidural extension of tumor (arrowheads) at the level of L5 and L2, with apparent preservation of the vertebral cortex.
An 8-year-old boy with Burkitt's lymphoma and diffuse marrow involvement. Fat-suppressed, T2-weighted fast spin echo (3000/96, TR/TE) sagittal MR image of the lumbar spine shows heterogeneous signal intensity of the bone marrow and epidural extension of tumor (arrowheads) at the level of L5 and L2, with apparent preservation of the vertebral cortex.
Lymphoma: multifocal bone marrow involvement. Sagittal T1-weighted (500/10, TR/TE) MR image of the lumbar spine shows multiple foci of bone marrow replacement (arrows). This appearance of lymphomatous involvement of the bone marrow is similar to bone metastases. Note extraosseous mass in the presacral space with apparent preservation of the bony cortex and small retroperitoneal lymph node at the level of L2 (arrowheads).
Lymphoma: multifocal bone marrow involvement. Sagittal T1-weighted (500/10, TR/TE) MR image of the lumbar spine shows multiple foci of bone marrow replacement (arrows). This appearance of lymphomatous involvement of the bone marrow is similar to bone metastases. Note extraosseous mass in the presacral space with apparent preservation of the bony cortex and small retroperitoneal lymph node at the level of L2 (arrowheads).
Its superior contrast resolution compared with CT makes MR imaging the modality of choice for the demonstration of soft tissue involvement. We have observed that extraosseous tumor in patients with lymphoma often occurs without obvious destruction of the cortical bone, reflecting the permeative nature of the tumor. MR images may show extensive involvement of the marrow and extraosseous soft tissues, with tumor “wrapped” around an apparently intact bony cortex48 (Figs 11 and 12). On bone radiographs and on CT, the involved bones may appear normal. This characteristic appearance of the extraosseous extent of lymphomatous involvement of the bone marrow is not pathognomonic for this disease and may be observed in other malignancies, particularly those of small cell origin. However, its presence may raise the possibility of lymphoma and direct the appropriate work-up. Caution should be taken to avoid misdiagnosing retroperitoneal lymphadenopathy for bone marrow involvement with extraosseous extension of tumor. Recently, Fenstermacher et al49 reported a 100% accuracy in the diagnosis of primary lymphoma of the bone versus osteosarcoma and Ewing sarcoma when no cortical destruction was detected in the area of bone marrow involvement and soft-tissue mass.
MR imaging has been applied to the posttreatment follow-up of patients with lymphoma. Quantitative MR imaging with serial measurements of T1 relaxation times showed a decrease of the latter in patients who responded to treatment.50,51 Variations in T2 relaxation times were not useful. We should stress here that a prolonged T1 relaxation time reflects increased cellularity, which, in patients with lymphoma, may be due to lymphomatous infiltration, fibrosis, or reactive hypercellular marrow.50 The differential diagnosis of active disease from reactive changes that may occur after treatment for lymphoma, may be difficult. Enhanced MR images of the marrow may help assess the posttreatment appearance of the lymphomas.
THE ACUTE LEUKEMIAS
MR imaging has proved to be very sensitive for depicting changes in the bone marrow in patients with acute leukemia.52-62 The diffuse MR pattern of marrow involvement is typical but not specific for the disease (Fig 5). Histologic examination of the marrow remains essential for the diagnosis and cell phenotyping of the leukemias. In acute leukemias, the evaluation of response to treatment requires serial bone marrow biopsies during the course of therapy. For this reason, investigators have focused on the prospect of MR imaging as a noninvasive means of assessing the posttreatment status of the bone marrow.
Initial reports showed that serial measurements of bulk T1 relaxation times (from both fat and water components of the bone marrow) and serial measurements of fat and water fractions were helpful in differentiating responding from nonresponding patients with acute leukemias.52-62 A decrease in bulk T1 values or an increase in the fat fractions of the marrow after the first week of treatment were found to be in keeping with a favorable response. However, Vande Berg et al,63 in a later, larger study with 29 patients with acute myelogenous leukemia (AML), found that changes in posttreatment bulk T1 measurements did not differ significantly in responding and nonresponding patients during and after the first induction course of treatment. They postulated that ablation of the leukemic cells and regeneration of the marrow are two processes that may occur independently and may both affect bulk T1 values of the marrow. The conclusions of Vande Berg et al63 stress the high sensitivity of MR imaging in depicting abnormalities in the bone marrow and its poor specificity and difficulty in differentiating posttherapy changes from active disease. The same investigators recently reported that, although sequential quantitative MR imaging was not useful in assessing the effect of treatment in patients with AML, it appeared to have value in predicting response in patients with acute lymphoid leukemia (ALL).64 One explanation for the increasing sensitivity of MR images to detect residual disease in patients with ALL compared with patients with AML is based on inherent differences of lymphoid and myeloid cells.65 The longer T1 values of lymphoid cells may enhance the differences in bulk T1 and, thus, facilitate the detection of residual blasts. Quantitative analysis of dynamically enhanced MR images is under investigation and may prove to be useful in the assessment of the status of the bone marrow after treatment, because the degree and rate of contrast uptake depends on the cellularity and vascularity of the marrow. One of the complications of acute leukemia is the development of chloromas or granulocytic sarcomas. The chloromas, which are more frequently associated with AML, occur in 4.7% of patients.65 They are solid tumors composed of granulocyte precursor cells that arise in the bone marrow and spread to the extraosseous space. Extension of these tumors into the spinal canal may cause compression of the spinal cord or the nerve roots (Fig 5). As in lymphomatous involvement of the bone marrow, extraosseous extension of tumor may occur without obvious bone destruction (Fig 5). Changes on conventional radiographs, even when they do occur, are not specific. MR imaging studies can differentiate chloromas from other complications of leukemia, such as osteomyelitis and hematoma. STIR or enhanced T1-weighted MR images facilitate the detection of these tumors, which are usually isointense to the bone marrow on unenhanced T1- and T2-weighted sequences, and should be obtained whenever development of a chloroma is suspected.65-67 On postcontrast MR images, enhancement of the capsule of a forming abscess or enhancement of an inflammed intervertebral disc will aid the differential diagnosis of infection versus relapse of leukemia.
APLASTIC ANEMIA AND MYELODYSPLASTIC SYNDROMES
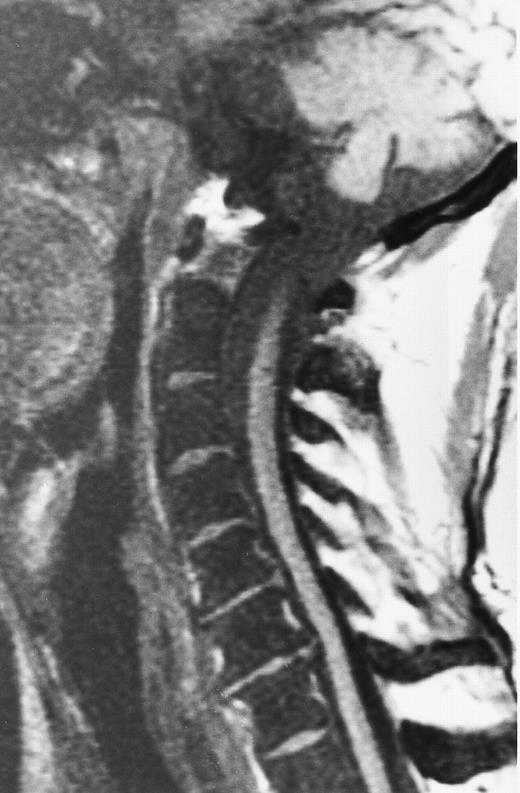
Aplastic anemia has a characteristic appearance on MR images because of the absence of cellular elements and the presence of abundant fatty marrow.68-73 The signal intensity of the aplastic bone marrow on T1- and T2-weighted images approaches that of subcutaneous fat. The aplastic marrow is excessively bright and, in most cases, is easily recognized from normal age-related marrow changes. Takagi et al73 studied nine patients with aplastic anemia with MR images of the femoral marrow. In all patients, on T1-weighted images the femoral marrow was either entirely fatty or predominantly fatty with small hypointense nodules.73 Smith et al72 reported significantly lower T1 values in four patients with severe aplastic anemia who were studied with MR images of the lumbar spine, compared with a control group. However, Olson et al46 cautioned that changes of aplastic anemia may not be distinguished from normal fatty bone marrow at other parts of the skeleton. An overlap of T1 measurements between normal and aplastic marrow was observed in the spines of three patients with aplastic anemia.70 This overlap did not exist when fractions of fat in the bone marrow were calculated with a phase contrast chemical imaging technique.46,69 71 The characteristic fatty appearance of the aplastic marrow may not be observed in the presence of hemosiderosis, because deposition of iron causes a decrease in the signal of the bone marrow on T1- and, particularly on T2-weighted images (Fig 13). Knowledge of the patient's transfusion history is important for the interpretation of the MR findings in patients with aplastic anemia.
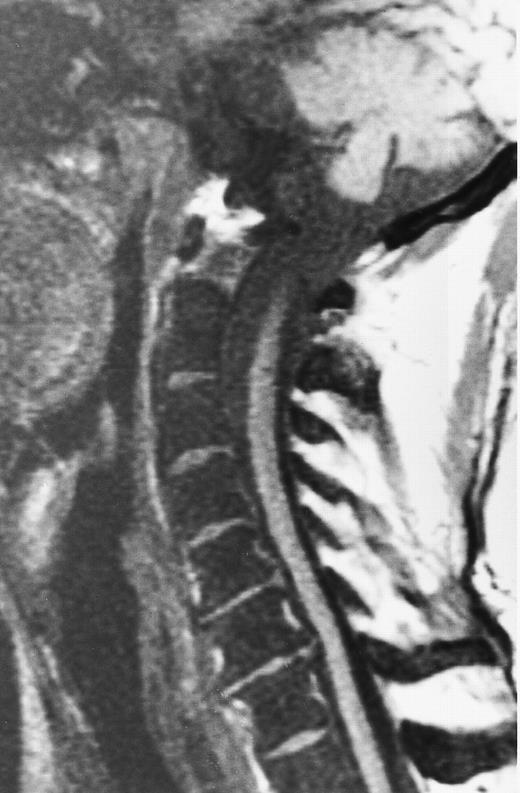
A 51-year-old man with chronic myeloid leukemia and hemosiderosis of the bone marrow due to multiple prior blood transfusions. Sagittal T1-weighted (500/10, TR/TE) MR image of the cervical spine shows marked hypointensity of the bone marrow. Note that the intervertebral discs are hyperintense to the abnormal marrow.
A 51-year-old man with chronic myeloid leukemia and hemosiderosis of the bone marrow due to multiple prior blood transfusions. Sagittal T1-weighted (500/10, TR/TE) MR image of the cervical spine shows marked hypointensity of the bone marrow. Note that the intervertebral discs are hyperintense to the abnormal marrow.
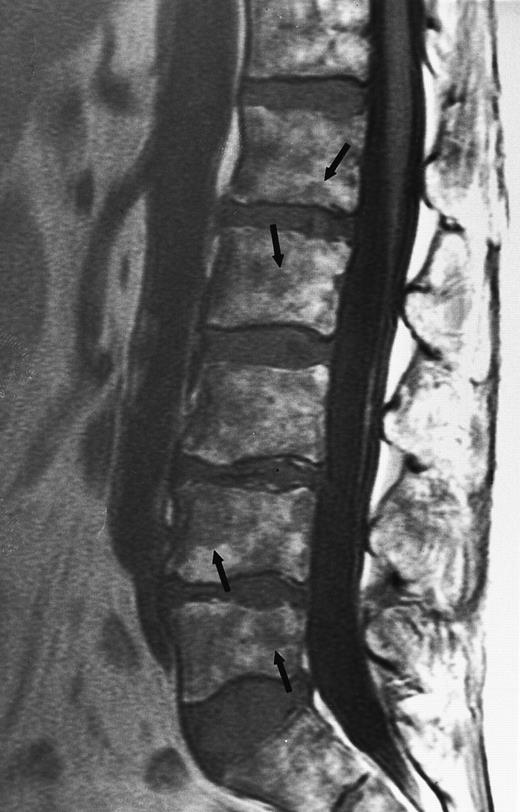
The detection of either focal or diffuse loss of the bright signal of the aplastic marrow, in the absence of hemosiderosis, may provide evidence for clonal disease (Fig 14). Negendak et al74 identified unexpected foci of hypercellular marrow on MR images of the spine in eight patients with a clinical diagnosis of aplastic anemia. Seven of these patients showed adjunctive evidence of myelodysplastic syndrome. Care should be taken to avoid misdiagnosing foci of regenerating hematopoietic marrow for clonal disease in patients with aplastic anemia who respond to treatment. Various MR techniques, including STIR images and contrast-enhanced images, may be used in an attempt to differentiate between the two entities.
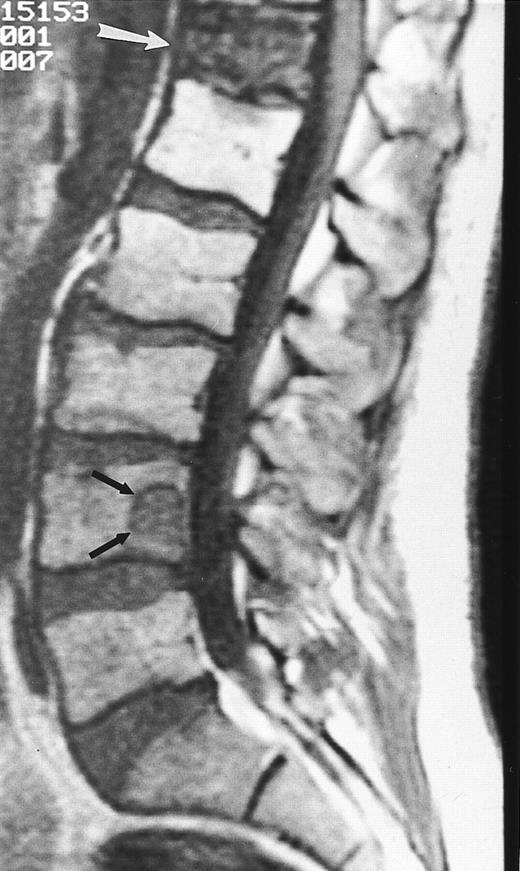
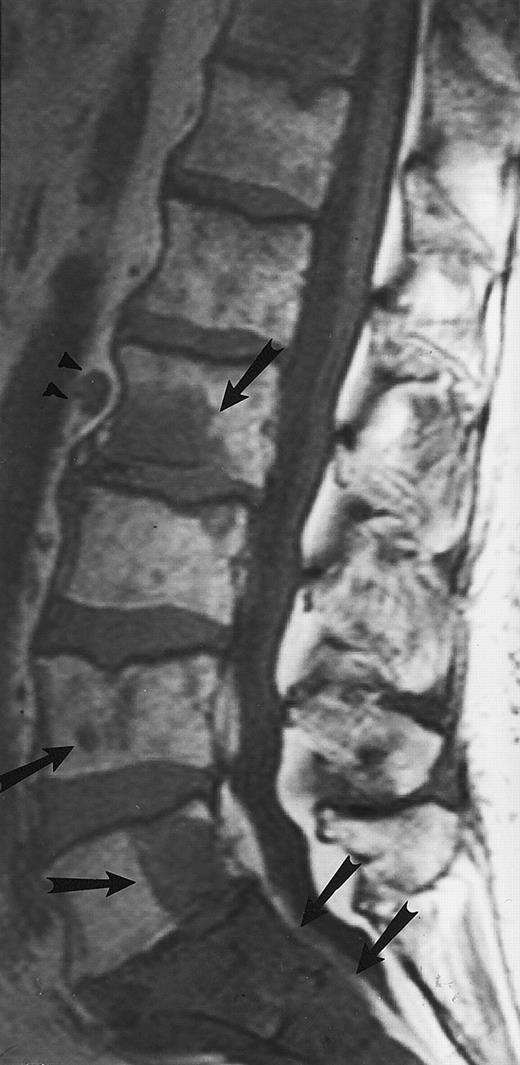
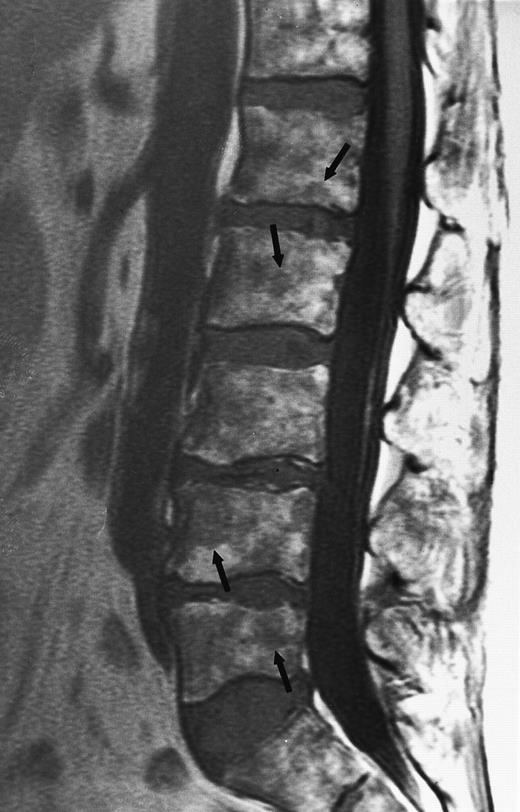
A 78-year-old woman with aplastic anemia and MR evidence of foci of hypercellular marrow. T1-weighted (500/10, TR/TE) sagittal MR image of the lumbar spine shows multiple foci of dark signal (arrows) on a background of bright aplastic marrow. On enhanced MR images (not shown), the lesions enhanced. Bone marrow biopsy showed myelodysplasia.
A 78-year-old woman with aplastic anemia and MR evidence of foci of hypercellular marrow. T1-weighted (500/10, TR/TE) sagittal MR image of the lumbar spine shows multiple foci of dark signal (arrows) on a background of bright aplastic marrow. On enhanced MR images (not shown), the lesions enhanced. Bone marrow biopsy showed myelodysplasia.
The prognosis of patients with myelodysplastic syndromes and the frequency of evolution to acute leukemia varies. In a recent series with 85 patients with myelodysplastic syndromes, Takagi et al73 found that the presence of extensive and uniform abnormality in the femoral marrow, with bright signal on corresponding STIR MR images, identified patients with a worse prognosis. These MR findings occured in 92% of patients with refractory anemia with excess blasts (RAEB) or with RAEB in transformation (RAEB-T), in all patients who developed AML, and in only 17% of patients with refractory anemia (RA) or RA with ring sideroblasts (RARS). The investigators concluded that, in patients with myelodysplastic syndromes, an increase in the extent of marrow abnormality and in its signal intensity on STIR images indicate progression of the disease.73 In this group of disorders of the marrow, MR images, by actually providing information on the volume of the abnormal cells, may complement information obtained from bone marrow biopsies or aspirations. In addition, they can help increase the positive yield of bone marrow biopsies by guiding the marrow sampling procedures to sites of relatively hypercellular marrow.
MISCELLANEOUS MALIGNANT BONE MARROW DISORDERS
Polycythemia vera and myelofibrosis belong to the group of chronic myeloproliferative disorders. In patients with polycythemia vera, the bone marrow of the axial skeleton is diffusely and homogeneously hypointense on T1-weighted MR images and it is indistinguishable from the diffuse marrow abnormality observed in patients with leukemia or myeloma.75 Foci of hypercellular marrow may appear in the peripheral skeleton as well. Kaplan et al75 found that patients with polycythemia vera and nonfatty hypercellular marrow on MR images of the femoral epiphyses and greater trochanters had higher levels of serum lactate dehydrogenase and lower levels of serum cholesterol compared with patients with the same disease but with a normal fatty appearance of the proximal femurs.
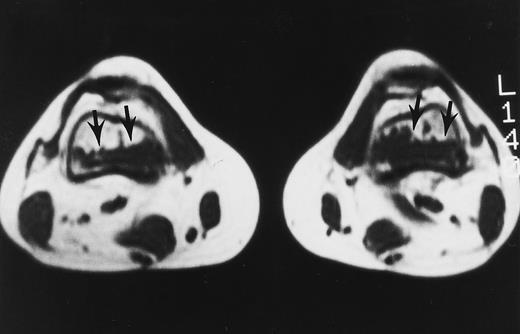
In myelofibrosis, the bone marrow may be hypercellular or depleted of all hematopoietic elements. Fibrotic marrow is visualized as areas of markedly low signal on all MR sequences (Fig 15).74 75 Unless the characteristic appearance of fibrotic marrow is seen, myelofibrosis cannot be distinguished from other hematologic malignancies with MR images alone.
A 32-year-old woman with AML and biopsy-proven fibrosis in the marrow. T1-weighted (500/10, TR/TE) axial MR image of the distal thighs shows foci of fibrosis (arrows) with dark signal. On T2-weighted MR images (not shown), the signal of the lesions did not change.
A 32-year-old woman with AML and biopsy-proven fibrosis in the marrow. T1-weighted (500/10, TR/TE) axial MR image of the distal thighs shows foci of fibrosis (arrows) with dark signal. On T2-weighted MR images (not shown), the signal of the lesions did not change.
POSTTHERAPY CHANGES
The changes that occur in the bone marrow after chemotherapy for leukemia are known from histologic studies.76 In the first week of treatment with chemotherapy, the marrow becomes very hypocellular with edema and dilated vascular sinuses. T1-weighted MR images of posttherapy necrosis of the marrow show a decrease in the signal of the bone marrow. On T2-weighted images, the marrow becomes bright, reflecting an increase in water content. After the first week, unilocular adipocytes (structured fat) produced from multilocular fat cells appear in the marrow. Subsequently, hematopoietic cells gather close to these areas of structured fat. From this time on, the marrow gradually becomes brighter, reflecting the increase in fat. Any deviation from this sequence of changes may suggest failure of response to treatment or relapse of the disease. The administration of hematopoietic growth factors may delay the fatty transformation of the bone marrow or may cause reconversion of fatty to hematopoietic marrow and simulate persistent or relapsing disease (Fig 16).77
A 28-year-old man treated with 8 courses of neoadjuvant chemotherapy and granulocyte-macrophage colony-stimulating factor for Ewing sarcoma of the right ischium. T1-weighted coronal MR image shows dark signal in the diaphyses of both femoral bones in keeping with reactivation of red marrow in the peripheral skeleton.
A 28-year-old man treated with 8 courses of neoadjuvant chemotherapy and granulocyte-macrophage colony-stimulating factor for Ewing sarcoma of the right ischium. T1-weighted coronal MR image shows dark signal in the diaphyses of both femoral bones in keeping with reactivation of red marrow in the peripheral skeleton.
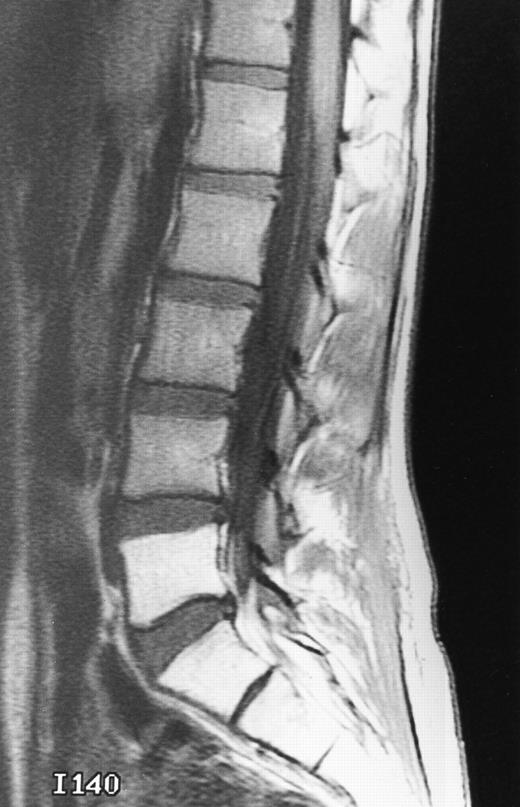
Radiation therapy kills the hematopoietic cells in the marrow and destroys the vascular sinusoids. Several investigators have studied the changes that occur in the irradiated bone marrow with MR images.78-81 T1-weighted MR images immediately after the initiation of radiotherapy show a decrease in the signal intensity of the bone marrow because of necrosis and edema of the marrow. STIR images are more sensitive in depicting early postradiation changes in the marrow.80 Increased signal intensity of the irradiated vertebral marrow was seen in 9 of 10 patients, with a peak incidence 9 days after initiation of radiotherapy.80 STIR MR images may detect the effect of radiotherapy within a few hours or days of treatment.80 About 2 weeks later, the signal intensity of the bone marrow gradually increases on T1-weighted MR images. The bright marrow is sharply limited to the radiation portals and is produced by the migration of fatty cells from adjacent nonirradiated areas (Fig 17). On STIR images, the signal intensity of the radiated marrow gradually decreases. Fatty replacement of the bone marrow is first seen around the basivertebral vein at the center of the vertebral body.80 The characteristic bright appearance of the irradiated spine is nonreversible for doses equal to or higher than 30 to 40 Gy, because destruction of the vascular sinusoids does not permit the migration of hematopoietic cells into the radiation field.79 For doses less than 30 Gy, regeneration of the marrow may occur 1 year after radiation therapy.78,81 82
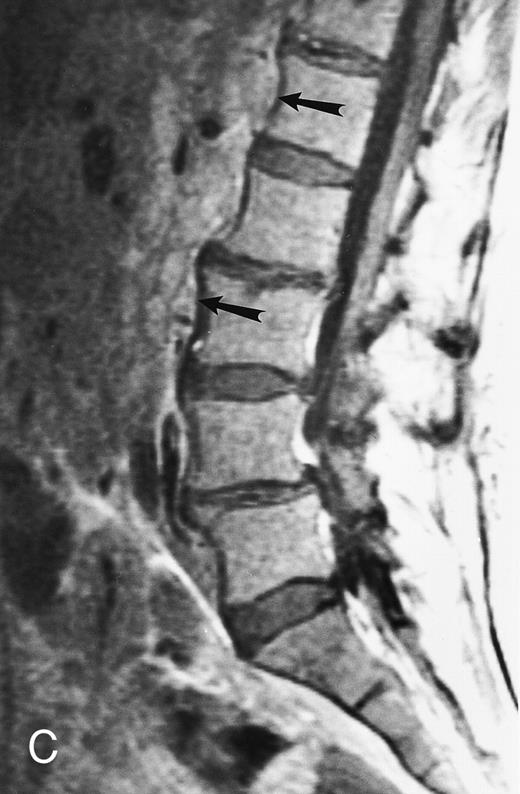
Postradiotherapy changes of the marrow in a 30-year-old man with metastatic nasopharyngeal carcinoma to the lumbar spine. T1-weighted (500/10, TR/TE) sagittal MR image shows bright signal in the radiated sacrum and L5 sharply delineated from marrow outside the radiation portals.
Postradiotherapy changes of the marrow in a 30-year-old man with metastatic nasopharyngeal carcinoma to the lumbar spine. T1-weighted (500/10, TR/TE) sagittal MR image shows bright signal in the radiated sacrum and L5 sharply delineated from marrow outside the radiation portals.
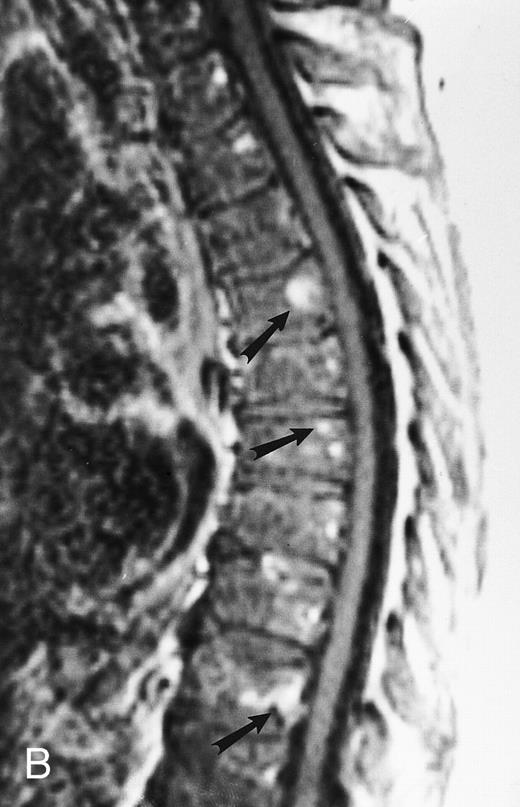
Before evaluating the posttherapy changes that are seen on MR images of the bone marrow, it is necessary to be familiar with the changes that occur in each MR pattern of abnormal marrow after successful treatment. The abnormalities seen on the pretreatment T1-weighted MR images may not resolve even in complete responders.21,35 It is their morphologic characteristics that change and, in particular, their behavior after the intravenous administration of contrast, because, on T2-weighted and STIR images, persistent bright signal after treatment may be observed with nonresponding tumor, marrow edema, and regenerating hematopoietic marrow (Fig 18).83 A lesion that was enhancing intensely and homogeneously before treatment and ceases to enhance or demonstrates a peripheral rim of enhancement after treatment is in keeping with a treated, inactive lesion. Enhanced MR images may be helpful in the differentiation of regenerating hematopoietic marrow from relapse of the disease. Because fibrotic changes that may develop in the bone marrow after treatment may enhance, dynamically enhanced MR images, obtained within 30 seconds from the intravenous injection of contrast, were tried detect early, arterial enhancement associated with tumor vessels.35 Dynamic images showing early enhancement (arterial phase) and early washout of contrast suggest the presence of residual tumor cells, whereas delayed and more prolonged patterns of enhancement suggest reactive changes. Dynamic MR imaging studies in patients with osteosarcoma and Ewing sarcoma showed that an interval of less than 6 seconds between arterial and tumoral enhancement correlated with the presence of residual viable tumor.84 Erlemann et al85 claim that dynamic MR imaging is superior to skeletal scintigraphy with an accuracy of 85.7% in assessing response of osteosarcoma and Ewing sarcoma to preoperative chemotherapy. Further studies are needed to evaluate the efficacy of dynamic MR imaging in the detection of minimal residual disease or early relapse in patients with hematologic malignancies.
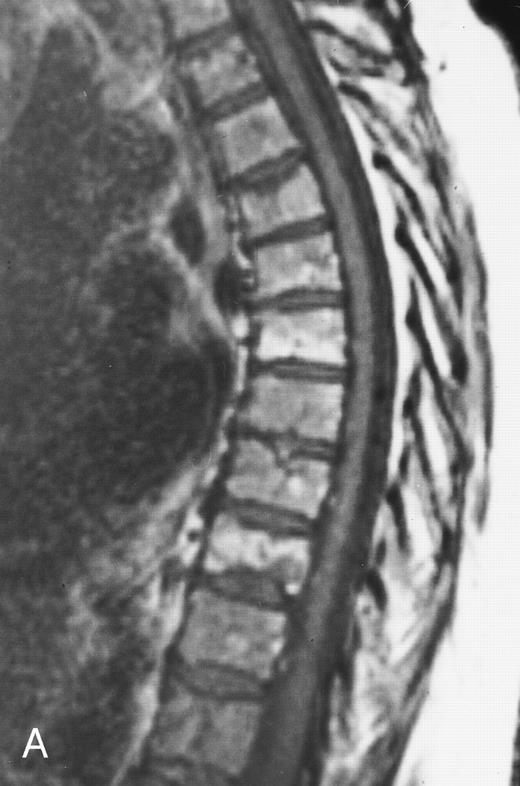
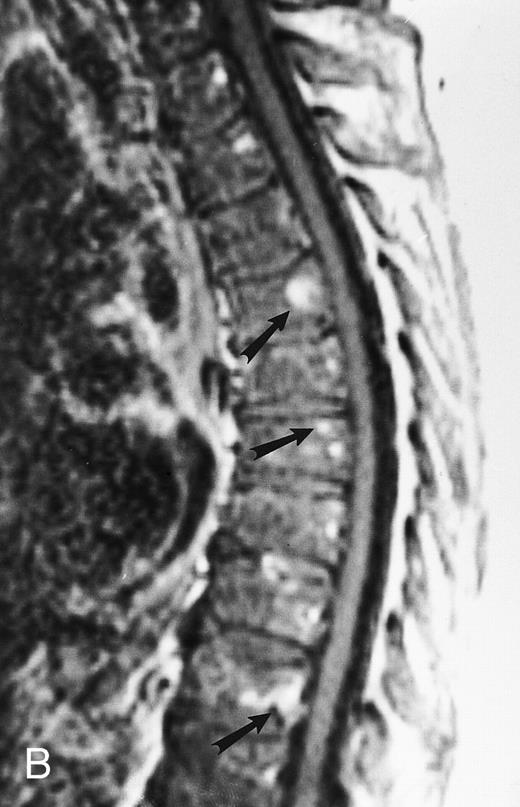
Enhanced sagittal T1-weighted (500/10, TR/TE) MR images of the thoracic spine in a 56-year-old woman with multiple myeloma before (A) and after (B) partial response to treatment with chemotherapy. In (A), there is diffuse enhancement of the abnormal bone marrow. In (B), only a few foci of enhancing marrow indicating persistent tumor are seen (arrows). The remainder of the bone marrow does not enhance in keeping with the presence of hematopoietic marrow, fibrosis, or both. Without enhanced images, the dark appearance of the marrow in (B) could be attributed to persistent tumor.
Enhanced sagittal T1-weighted (500/10, TR/TE) MR images of the thoracic spine in a 56-year-old woman with multiple myeloma before (A) and after (B) partial response to treatment with chemotherapy. In (A), there is diffuse enhancement of the abnormal bone marrow. In (B), only a few foci of enhancing marrow indicating persistent tumor are seen (arrows). The remainder of the bone marrow does not enhance in keeping with the presence of hematopoietic marrow, fibrosis, or both. Without enhanced images, the dark appearance of the marrow in (B) could be attributed to persistent tumor.
COMPRESSION FRACTURES
In a patient who is being treated for a hematologic malignancy, the development of a spinal compression fracture presents the clinician with a serious diagnostic problem. During or after therapy, resolution of the tumor mass that had replaced the bony substrate and was supporting the vertebral cortex may cause collapse of the vertebra (Fig 6). Thirty-five new or progressive compression fractures were discovered on posttreatment MR images of 29 patients with multiple myeloma in remission.21 However, collapse may be due to progressive replacement of the vertebral body by uncontrolled tumor (Fig 9). Conventional radiographs and CT are not usually helpful in determining the etiology of the fracture, if obvious signs of malignancy are not present. On MR images, edema and hemorrhage of the marrow in a recent fracture of benign etiology may mimic findings of a fracture of malignant etiology.
There have been several attempts to determine the etiology of vertebral collapses with MR images.86-89 We recently studied the MR images of 98 vertebral collapses (51 malignant and 47 osteoporotic or posttraumatic).88 Abnormality involving the entire vertebral body, an epidural mass or a bulging contour of the vertebra, extension of the abnormality to the pedicles, and a cervical or lumbosacral location were findings more frequently associated with malignant fractures (P < .01). The accuracy of MR imaging in the diagnosis of a benign or malignant compression fracture approached 94% when this constellation of MR criteria was applied.88 In their study of 93 acute vertebral body collapses with MR images, Cuenod et al89 reported similar findings and showed that the presence of an epidural mass and inhomogeneous enhancement of the affected vertebra after the administration of intravenous contrast are highly (100%) specific signs for malignant fractures. MR imaging is today the procedure of choice for the evaluation of the cause of a vertebral body collapse. In cases with equivocal MR findings, a repeat study in 4 weeks should provide the answer: resolution of the changes will be seen in a benign fracture, whereas the changes will persist or progress in a malignant one.
MR IMAGING IN BONE MARROW TRANSPLANTATION
Bone marrow transplantation has been used for the treatment of hematologic and solid malignancies since the middle of the 1950s. Patients who undergo bone marrow transplantation are assessed with serial bone marrow biopsies and aspirations. Because MR images provide a noninvasive means of assessing large volumes of the bone marrow, they were applied to the evaluation of the posttransplant patient (Figs 3 and 19). The interpretation of MR images of the bone marrow in the posttransplant patient requires knowledge of the sequence of changes that occur in the marrow after transplantation.
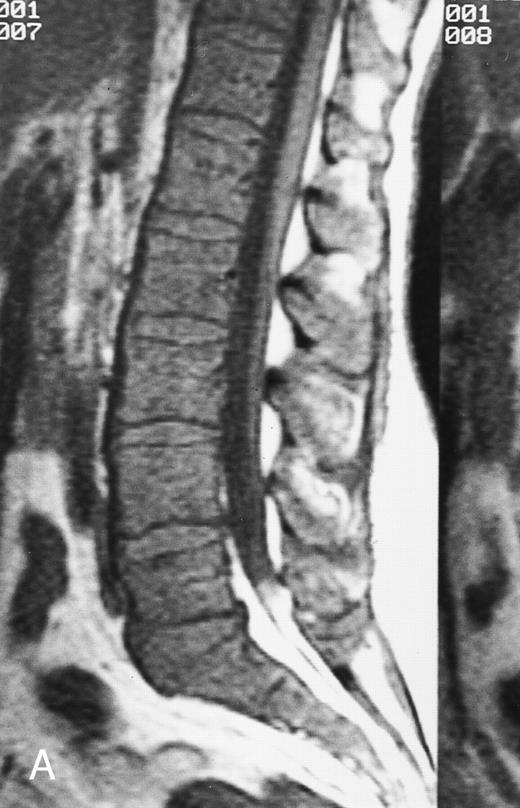
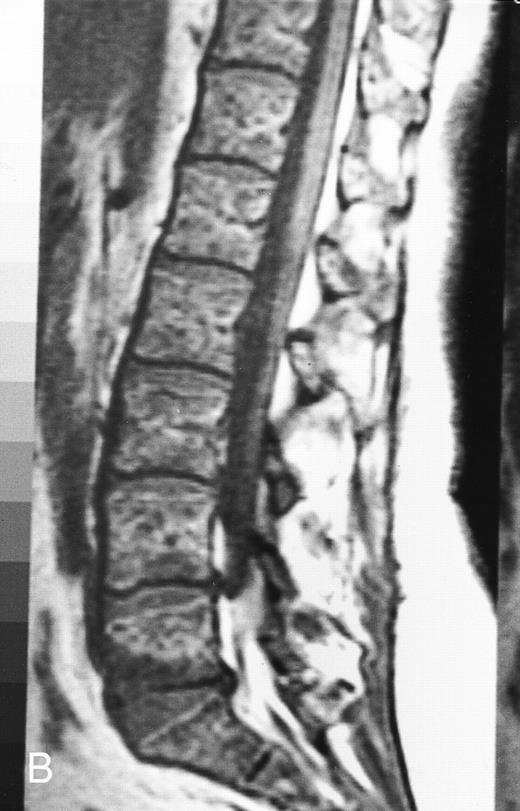
T1-weighted (500/11, TR/TE) sagittal MR images of the lumbosacral spine in a 45-year-old woman before (A) and 40 days after (B) bone marrow transplantation for multiple myeloma. There is a diffuse MR pattern of marrow involvement in (A) (bone marrow plasma cells, 50%; monoclonal protein, 6.0 g/dL). On the posttreatment image, there is definite reinstitution of fatty marrow in the spine and, in particular, around the basivertebral veins, in keeping with partial response to treatment (bone marrow plasma cells, 0.5%; monoclonal protein, 1.6 g/dL).
T1-weighted (500/11, TR/TE) sagittal MR images of the lumbosacral spine in a 45-year-old woman before (A) and 40 days after (B) bone marrow transplantation for multiple myeloma. There is a diffuse MR pattern of marrow involvement in (A) (bone marrow plasma cells, 50%; monoclonal protein, 6.0 g/dL). On the posttreatment image, there is definite reinstitution of fatty marrow in the spine and, in particular, around the basivertebral veins, in keeping with partial response to treatment (bone marrow plasma cells, 0.5%; monoclonal protein, 1.6 g/dL).
During the first posttransplantation days, marrow necrosis is seen as a decrease in the signal intensity of the marrow on T1-weighted images and as increased brightness on T2-weighted images. Within 3 months from bone marrow transplantation, a characteristic band pattern appears on T1-weighted MR images of the spine.90 This band pattern consists of a peripheral zone of dark signal and a central zone of bright signal. At histologic examination, the peripheral zone corresponded to repopulating hematopoietic marrow and the central zone to marrow fat.90 Stevens et al90 observed the band pattern in all but 1 of 15 patients within 90 days after bone marrow transplantation and up to a follow-up of 14 months. In 1 patient with relapse of disease, the band pattern evolved to a more homogeneous appearance of the marrow. In our experience, the band pattern gradually evolves into a homogeneous appearance of the marrow after successful bone marrow transplantation.
MR imaging of the bone marrow has been used in the selection of the bone marrow harvest site in candidates for autologous bone marrow transplantation. MR imaging can identify disease in the marrow in patients with known hematologic malignancies and negative bilateral iliac crest bone marrow biopsies.40,44,47,91 Negendak and Soulen91 found that 32% of 50 patients with lymphoma who were eligible for bone marrow transplantation had abnormal MR studies. Forty-four percent of these patients relapsed at a median time of 9.5 months after autologous bone marrow transplantation, whereas 49% of patients with negative MR studies relapsed at a median time of 14.6 months.91 These data suggest that relapse of the disease after bone marrow transplantation may not be due to reinfusion of malignant cells in the marrow but to failure to eradicate the malignant cells before harvesting the marrow. MR imaging of the marrow is a useful adjunct to bone marrow biopsy for patients who are candidates for bone marrow transplantation and, in particular, for patients with lymphoma, a disease with a well-known patchy mode of infiltration of the bone marrow.
Today, peripheral blood stem cell transplantation is the preferred technique for bone marrow transplantation. Patients who undergo stem cell transplantation are followed by monitoring peripheral blood cell counts. In a recent report on patients who underwent bone marrow MR imaging before and after blood stem cell transplantation, high signal was observed on STIR images during the period of marrow aplasia and during marrow reconstitution.83 Extracellular edema may be difficult to differentiate from increased cellularity on T1- and T2-weighted MR images alone. Quantitative techniques and contrast-enhanced MR sequences are being studied in an attempt to introduce a noninvasive means of directly assessing the cellular population of the marrow. Results on the role of molecular markers for monitoring changes that occur in the marrow are promising, but, so far, there are no publications comparing their merits relative to those of bone marrow MR imaging.92
CONCLUSIONS
MR imaging has become an important noninvasive tool that can provide the clinician with important information for the diagnosis, staging, and monitoring of therapy in patients with hematologic malignancies.
(1) By assessing a large volume of bone marrow noninvasively and relatively quickly, MR imaging studies can designate foci of marrow involvement in diseases with focal patterns of marrow infiltration and, thus, can increase the rate of successful bone marrow biopsies.
(2) Serial MR imaging studies after initiation of therapy may obviate the need for some of the required bone marrow biopsies and may help explain the source of histologic findings.
(3) MR imaging can help determine the etiology of spinal compression fractures in patients with hematologic malignancies.
(4) It can accurately depict the level and extent of extraosseous mass and identify sites of impending cord compression.
(5) It can assist the selection of eligible patients for autologous bone marrow transplantation.
(6) By directly visualizing the marrow and demonstrating changes that occur within it at different time points, in patients with various disorders who receive different treatment regimens and respond in different ways, MR imaging may, perhaps, in the future, help us understand more of the pathogenesis and evolution of the hematologic malignancies.
ACKNOWLEDGMENT
The authors thank Dr B. vande Berg for providing us with unpublished data and Dr H.I. Libshitz for critically reviewing an early draft of the manuscript.
Address reprint requests to Lia A. Moulopoulos, MD, Department of Radiology, Areteion Hospital, 76 Vas. Sophias Ave, 11528 Athens, Greece.


