Abstract
The correlation of persistent tumor necrosis factor-α (TNF-α) activation with disease progression in patients infected with human immunodeficiency virus type 1 (HIV-1), suggests a role for TNF-α in the pathogenesis of HIV-1 infection. In the present study, we examined by flow cytometry the expression of membrane-bound (m) components of the TNF system in 33 HIV-1–infected patients and 12 healthy controls. While peripheral blood mononuclear cells (PBMC) from asymptomatic and symptomatic non-acquired immune deficiency syndrome (AIDS) patients showed a significantly increased percentage of mTNF-α+ and mTNF receptor (TNFR)+ cells compared with controls, this was not found in the AIDS group. Compared with healthy controls, AIDS patients had a significantly decreased percentage of both monocytes and lymphocytes expressing p75-TNFR. PBMC from AIDS patients showed a higher p75-TNFR mRNA level and a higher spontaneous release of soluble p75-TNFR than healthy individuals, suggesting enhanced cell surface turnover of this TNFR. The low expression of TNFRs on both lymphocytes and monocytes in the AIDS group was associated with high numbers of HIV-1 RNA copies in plasma, low numbers of CD4+ lymphocytes, and high serum levels of soluble TNFRs. AIDS patients had a decreased percentage of CD8+ lymphocytes expressing TNFRs compared with healthy controls. In contrast, these patients, as well as symptomatic non-AIDS patients, had an increased percentage of TNF-α+ and TNFRs+ cells among remaining CD4+ lymphocytes. The pattern of abnormalities seen in AIDS patients suggests a role for persistent activation of the TNF system in the accelerated CD4+ lymphocyte destruction, the enhanced HIV-1 replication, and the markedly impaired antimicrobial defense in advanced HIV-1-related disease.
INFECTION WITH human immunodeficiency virus type 1 (HIV-1) causes a cellular immunodeficiency with a progressive depletion of CD4+ lymphocytes as the immunologic hallmark.1 HIV-1 replication is clearly linked to CD4+ cell destruction,1-3 but the mechanisms responsible are not completely understood. The development of immunodeficiency in HIV-1–infected patients is accompanied by a persistent immune activation manifested as increased expression of activation markers on monocytes/macrophages and T lymphocytes, increased serum levels of neopterin and β2-microglobulin, and as hyperactivity of B cells.1,2,4 A distinctive feature of this sustained immune activation is increased release of proinflammatory cytokines, in particular, enhanced release of tumor necrosis factor-α (TNF-α), which may play an important pathogenic role in HIV-1 infection.1,2,5 We and others have demonstrated a clear association between disease progression and activation of the TNF system in vivo in HIV-1–infected individuals.6,7 Furthermore, persistent TNF-α activation may enhance HIV-1 replication through activation of the NF-κB transcriptional factor,5 and may contribute to development of certain clinical manifestations (eg, encephalopathy and cachexia) in HIV-1–infected patients.5 Recent observations also suggest that TNF-α activation may play a pathogenic role through the induction of increased apoptosis of T lymphocytes during HIV-1 infection,8 thus contributing to the CD4+ cell destruction in this disease.
TNF-α exists as two distinct species: one membrane-bound (mTNF-α) and one soluble form (sTNF-α).9,10 sTNF-α is derived by proteolytic cleavage of mTNF-α, and both forms have been shown to be bioactive.9 The action of both mTNF-α and sTNF-α is mediated through the binding to specific cell surface receptors, p55- and p75-TNF receptors (TNFRs).9,10 It has been claimed that most biologic responses of TNF-α such as induction of cell death and cytokine production, are mediated by the p55-TNFR and that p75-TNFR may further enhance some of these cellular responses through ligand passing mechanisms.9-11 However, recent studies have shown that p75-TNFR also directly mediates distinct cellular responses such as proliferation of T and B cells, activation of NF-κB, and induction of cytotoxicity.12-15 Similar to mTNF, the extracellular domains of both TNFRs may be released from cells in forms that retain the ability to bind TNF.16,17 These sTNFRs may block various biological effects induced by TNF-α,16,17 but also stabilizing and even augmenting effects on TNF-α activities have been reported.18
The level of expression of the mTNFRs on various cells is probably essential for the action of TNF-α. Furthermore, mTNF-α can mediate important biologic activities through direct cell-to-cell contact with target cells expressing TNFRs.13,19-21 There are few studies examining the expression of the membrane-bound components of the TNF system during HIV-1 infection,19,22 23 and to our knowledge, there are no reports on these TNF components in patients with advanced clinical and immunologic disease. Thus, to better understand the role of the TNF system in the pathogenesis of HIV-1 infection, we examined the expression of the membrane-bound components of the TNF system on different subsets of peripheral blood mononuclear cells (PBMC) from patients in different clinical and immunologic stages of HIV-1 infection.
MATERIALS AND METHODS
Patients and controls.Thirty-three HIV-1-seropositive patients were included in the study (25 men and 8 women; median age, 36 years; range, 27 to 52 years). Clinically, 12 patients were classified as asymptomatic HIV-1–infected patients (Center for Disease Control and Prevention [CDC] group A), 11 patients as symptomatic non-AIDS HIV-1–infected patients (CDC group B), and 10 as AIDS patients (CDC group C).24 Some immunologic data of the patient group are given in Table 1. Patients with ongoing acute infection or acute exacerbation of chronic, opportunistic infection at the time of blood collection (2 months before to 1 week after) were not included in the study. Two patients were under treatment for cytomegalovirus retinitis and one patient received antibiotics for disseminated infection with Mycobacterium avium complex, but all three were in stable clinical condition. At the time of the study, 11 patients received zidovudine, but none of these had initiated therapy or changed dosage regimen during the last 6 months.
Controls in the study were 12 healthy, volunteer, HIV-1-seronegative blood donors (nine men and three women; median age, 33 years; range, 25 to 50 years).
Blood sampling protocol.For serum sampling, blood was drawn into sterile pyrogen-free vacuum blood collection tubes without any additives (Becton Dickinson, San Jose, CA). Tubes were immediately immersed in melting ice, allowed to clot for less than 1 hour before centrifugation (600g for 10 minutes, and stored at −80°C in multiple aliquots until analysis. Samples were frozen and thawed only once.
Isolation and cryopreservation of cells.PBMC were obtained from heparinized blood by Isopaque-Ficoll (Lymphoprep; Nycomed Pharma AS, Oslo, Norway) gradient centrifugation within 45 minutes as previously described.25 Mononuclear cells were washed twice in Hanks' balanced salt solution (GIBCO, Paisley, UK), and thereafter immediately cryopreserved and stored in liquid nitrogen for up to 8 months as described in detail elsewhere.26,27 The cell viability of thawed cells exceeded 98% as determined by acridine orange (Sigma Chemical Co, St Louis, MO) and ethidium bromide (Sigma) staining.25 The endotoxin content in all solutions used for storing and handling of cells was less than 10 pg/mL (limulus amebocyte test).
Cell culture.For determination of soluble p75-TNFR release from PBMC in vitro, freshly isolated PBMC (3 × 10⁶/mL) were suspended in RPMI 1640 (GIBCO) with 2 mmol/l L-glutamine and 25 mmol/L HEPES buffer (GIBCO) supplemented with 10% pooled heat-inactivated AB+ serum, and incubated in flat-bottomed, 96-well trays (Costar, Cambridge, MA; 200 μL/well) without any stimulants. Cell-free supernatants were harvested after 20 hours and stored at −80°C until analysis.
Flow cytometry.After thawing, 5 × 10⁵ PBMC were preincubated in phosphate-buffered saline (PBS; Sigma) with 5% mouse serum (Sigma), 5% human AB+ serum, 2% bovine serum albumin (BSA; Calbiochem, La Jolla, CA) and 0.1% sodium azide for 10 minutes, then washed twice in PBS with 2% BSA and 0.1% sodium azide (washing buffer). The cells were incubated with the biotinylated monoclonal antibodies (MoAbs) htr-9, 3H5, and 6H11 used for detection of p55-TNFR, p75-TNFR, and mTNF-α, respectively28-30 or isotype matched controls (Becton Dickinson) at 4°C for 20 minutes. Fluorescence staining of the bound biotinylated MoAb was performed by adding streptavidine-phycoerythrin conjugate (Southern Biotechnology, Birmingham, AL). Thereafter, the cells were washed twice in washing buffer and finally resuspended in PBS with 1% paraformaldehyde. In two-color flow cytometry, fluorescein isothiocyanate (FITC)-labeled anti-CD4 (Leu 3a, Becton Dickinson) or anti-CD8 (Leu-2a, Becton Dickinson) was added. The cells were analyzed on a FACScan (Becton Dickinson) with CELLQuest software (Becton Dickinson). Positive staining was defined in relation to fluorescence of cells stained with isotype control MoAbs. The boundaries between stained and unstained population were set using the isotype control setting such that less than 5% of the event in the control tube was scored as positive. Monocytes and lymphocytes were gated according to forward and side scatter. List mode files of 15,000 cells were collected for each sample.
Dot blot analyses of RNA.Total cellular RNA was isolated from PBMC by the guanidine isothiocyanate-phenol-chloroform method,31 and RNA was blotted onto nylon membranes (Hybond N, Amersham Int, Little Chalfont, UK). Prehybridization, hybridization, and autoradiography were performed as previously described.32,33 Polymerase chain reaction (PCR) products from human monocytes were used for detection of p75 TNFR (403 bp, position 219-621).34 The probe for the glyceraldehyde-phosphate dehydrogenase (GADPH) gene was obtained from American Tissue Culture Collection (Rockville, MD). The relative sensitivity of the autoradiographs was quantified using scanning densitometry (Shimadzu, Kyoto, Japan). When comparing mRNA levels between HIV-1–infected patients and healthy controls, a quantitative estimate of the p75-TNFR mRNA was attempted by comparing with mRNA level for the GAPDH gene.
Enzyme immunoassay (EIA) for detection of TNF-α and sTNFRs.The sTNFRs, p55- and p75-TNFR, were analyzed by immunoassays described by Liabakk et al.30 Immunoplates were coated with the MoAbs, IV4E and 3H5, recognizing non-TNF-binding sites of p55- and p75-TNFR, respectively. Recombinant human p55- and p75-TNFR (provided by Dr H. Loetscher, F. Hoffmann-La Roche, Basel, Switzerland) served as standards. Concentration of immunoreactive TNF-α was quantified by EIA (Medgenix, Fleurus, Belgium) as previously described.6 This EIA detects free as well as TNF-α bound to its soluble receptors.6
Quantification of HIV RNA copy numbers in plasma.HIV RNA levels were measured in EDTA plasma by quantitative reverse PCR (Amplicor HIV Monitor, Roche Diagnostic Systems, Branchburg, NJ) according to the manufacturer's instructions. The limit of detection was 400 copies/mL plasma.
Quantification of lymphocyte subsets in PB.The numbers of CD4+ and CD8+ lymphocytes in PB were determined by immunomagnetic quantification, which has been shown to agree well with flow cytometry.35
Statistical analysis.For comparison of two groups of individuals, the Mann-Whitney U test was used. When more than two groups were compared, the Kruskal-Wallis test was used. If a significant difference was found, Fisher's least significant differences were computed on the ranks to determine differences between each pair of groups. Coefficients of correlation (r ) were calculated by the Spearman rank test. Data are given as medians and 25th to 75th percentiles, if not otherwise stated. P values are two-sided and considered significant when P < .05.
RESULTS
Expression of mTNF-α and TNFRs on PBMC.To better understand the role of the different components of TNF system in HIV-1 infection, we examined the expression of the membrane-bound components of the TNF system on PBMC from HIV-1–infected patients and healthy controls by flow cytometry. Among PBMC from HIV-1–infected patients in CDC group A and B, we found a marked increase in the percentage of cells expressing mTNF-α (≈550% increase in CDC group A), as well as both types of mTNFRs (≈150% and 250% increase in CDC group B, p55- and p75-TNFR, respectively) compared with PBMC from noninfected healthy individuals (Table 2). In patients from CDC group A and B, the median percentage of mTNF-α+ PBMC was approximately the same (Table 2). In contrast, the highest percentage of p75-TNFR+ and p55-TNFR+ PBMC was found among patients in CDC group B, with the most pronounced increase in membrane-bound p75-TNFR expression (Table 2).
In contrast to findings in CDC group A and B, CDC group C had significantly lower percentages of mTNF-α+, p55-TNFR+, and p75-TNFR+ PBMC compared with other HIV-1–infected patients (Table 2). In fact, even compared with healthy controls, AIDS patients had decreased percentage of mTNFR+ PBMC and particularly of PBMC expressing p75-TNFR (≈60% decrease, Table 2).
Expression of mTNF-α and TNFRs on lymphocytes and monocytes.Because both lymphocytes and monocytes express mTNF-α and mTNFRs,9 10 we further examined whether the expression of the membrane-bound components of the TNF system differed between lymphocytes and monocytes in HIV-1 infection in vivo. In general, the flow cytometry assessment of TNF-α+, p55-TNFR+, and p75-TNFR+ monocytes and lymphocytes gave comparable results with the analyses of PBMC, with high percentages of positive cells in CDC group A and B and lower percentages of positive cells in CDC group C (Table 3). Indeed, patients in CDC group C had significantly decreased percentage of p75-TNFR+ monocytes, as well as lymphocytes, even compared with healthy controls (≈70% and 50% decrease; monocytes and lymphocytes, respectively; Table 3).
However, separate determination of mTNF-α+ and mTNFR+ monocytes and lymphocytes showed one particularly interesting pattern. In patients from CDC group C, we found a reduction (≈80%) in the percentage of p55-TNFR+ lymphocytes compared with controls, while the percentage of positive monocytes was ≈30% higher than in controls (Table 3). Thus, while the ratio of membrane-bound p55-TNFR+/p75-TNFR+ lymphocytes was similar in HIV-1–infected patients and healthy individuals (≈0.3 to 0.4), this ratio was significantly increased among monocytes in all clinical groups of HIV-1–infected patients compared with monocytes from healthy controls with the highest ratio in CDC group C (≈0.4, 0.8, 1.4, and 1.8; p55-TNFR+/p75-TNFR+ ratio in controls and patients from CDC group A, B, and C, respectively; data not shown).
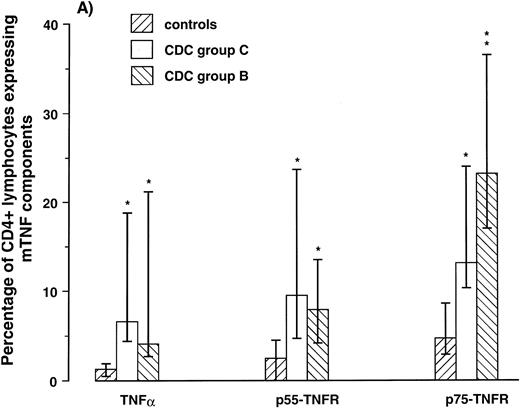
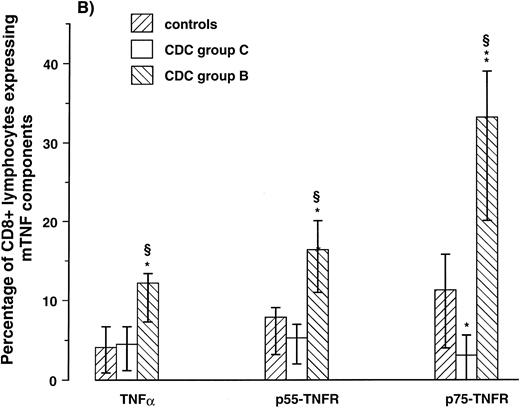
Expression of mTNF-α and TNFRs on CD4+ and CD8+ lymphocytes. To examine if the membrane-bound components of the TNF system were expressed differently on different lymphocyte subpopulations, we next determined by two-color flow cytometry the percentage of CD4+ and CD8+ lymphocytes coexpressing mTNF-α, p55-TNFR, p75-TNFR in 10 HIV-1–infected patients (five in CDC group B and five in CDC group C) and seven healthy controls. All patients in CDC group C had CD4+ lymphocyte counts < 50 × 106/L and all patients in CDC group B had CD4+ lymphocyte counts of 50 to 199 × 106/L. Comparable with the high expression on lymphocytes as a whole, the percentage of CD4+ and CD8+ lymphocytes from patients in CDC group B expressing both mTNF-α and mTNFRs was significantly elevated compared with controls (Fig 1). Furthermore, comparable with the low expression on lymphocytes as a whole, patients in CDC group C had low percentage of CD8+ lymphocytes expressing these membrane-bound components of the TNF system (Fig 1). However, in contrast to the CD8+ lymphocytes, patients in CDC group C had significantly elevated percentage of CD4+ lymphocytes expressing mTNFRs, as well as mTNF-α compared with healthy controls (≈300%, 200% and 400% increase, p55-TNFR, p75-TNFR, and TNF-α, respectively; Fig 1). Thus, both patients in CDC group B, with markedly increased percentage of lymphocytes expressing the membrane-bound components of the TNF system, and patients in CDC group C, with downregulated expression of these components on lymphocytes as a whole, are characterized by significantly increased expression of mTNF-α and mTNFRs among remaining CD4+ lymphocytes compared with CD4+ lymphocytes from healthy controls.
Percentage of CD4+ (A) and CD8+ lymphocytes (B) expressing membrane-bound (m)TNF-α and mTNFRs (p55- and p75-TNFR) were analyzed by flow cytometry in five symptomatic non-AIDS HIV-1–infected patients (CDC group B), five AIDS patients (CDC group C), and seven healthy controls. *P < .05 versus controls, **P < .01 versus controls, and ρP < .05 versus CDC group C. Data are given as medians and 25th to 75th percentiles.
Percentage of CD4+ (A) and CD8+ lymphocytes (B) expressing membrane-bound (m)TNF-α and mTNFRs (p55- and p75-TNFR) were analyzed by flow cytometry in five symptomatic non-AIDS HIV-1–infected patients (CDC group B), five AIDS patients (CDC group C), and seven healthy controls. *P < .05 versus controls, **P < .01 versus controls, and ρP < .05 versus CDC group C. Data are given as medians and 25th to 75th percentiles.
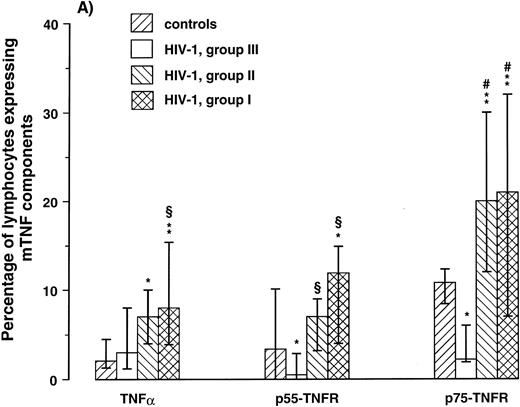
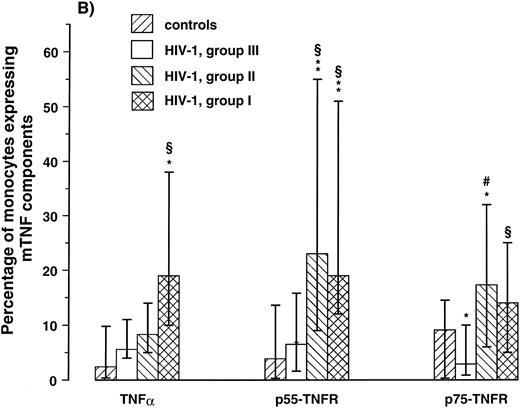
Expression of mTNF-α and TNFR on lymphocytes and monocytes in relation to the degree of immunodeficiency.A progressive decline in numbers of CD4+ lymphocytes in PB is the immunologic hallmark of HIV-1 infection. To relate the expression of the membrane-bound TNF components on lymphocytes and monocytes to the degree of immunodeficiency, patients were classified in three groups according to their CD4+ lymphocyte counts as follows: I, CD4+ lymphocyte counts > 199 × 106/L, (n = 11); II, CD4+ lymphocyte counts of 50 to 199 × 106/L, (n = 12); and III, CD4+ lymphocyte counts < 50 × 106/L, (n = 10). The cut-off points 200 and 50 × 106/L enabled us to divide the study group into three separate groups with approximately equal numbers of patients, but more importantly, these CD4+ levels probably delineate important stages of immunologic and clinical disease progression in HIV-1 infection.24,36 37 As can be seen in Fig 2, both patients in groups I and II had significantly higher percentage of both lymphocytes and monocytes expressing mTNF-α and TNFRs compared with healthy controls. In contrast, patients in group III had decreased expression of these membrane-bound components of the TNF system with significantly decreased percentage of p75-TNFR+ lymphocytes and monocytes even compared with healthy controls (Fig 2). Thus, while earlier immunologic and clinical stages of HIV-1 infection are characterized by increased expression of mTNF-α and TNFRs on lymphocytes and monocytes, the decline in numbers of CD4+ lymphocytes along with disease progression appears to be associated with a reduction in the percentage of these cells expressing the membrane-bound components of the TNF system.
Percentage of lymphocytes (A) and monocytes (B) expressing membrane-bound (m)TNFα and mTNFRs (p55- and p75-TNFR) were analyzed by flow cytometry in three different immunologic subgroups of HIV-1–infected patients and 12 healthy controls. The patients were classified in three groups according to their CD4+ lymphocyte counts as follows: I, CD4+ lymphocyte counts < 199 × 106/L, (n = 11); II, CD4+ lymphocyte counts of 50 to 199 × 106/L, (n = 12); III, CD4+ lymphocyte counts < 50 × 106/L, (n = 10). *P < .05 versus controls, **P < .01 versus controls, ρP < .05 versus CDC group C, #P < .01 versus CDC group C. Data are given as medians and 25th to 75th percentiles.
Percentage of lymphocytes (A) and monocytes (B) expressing membrane-bound (m)TNFα and mTNFRs (p55- and p75-TNFR) were analyzed by flow cytometry in three different immunologic subgroups of HIV-1–infected patients and 12 healthy controls. The patients were classified in three groups according to their CD4+ lymphocyte counts as follows: I, CD4+ lymphocyte counts < 199 × 106/L, (n = 11); II, CD4+ lymphocyte counts of 50 to 199 × 106/L, (n = 12); III, CD4+ lymphocyte counts < 50 × 106/L, (n = 10). *P < .05 versus controls, **P < .01 versus controls, ρP < .05 versus CDC group C, #P < .01 versus CDC group C. Data are given as medians and 25th to 75th percentiles.
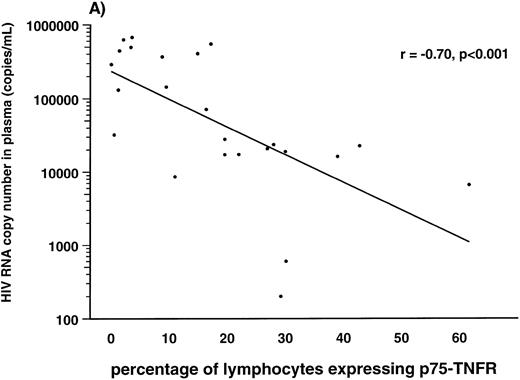
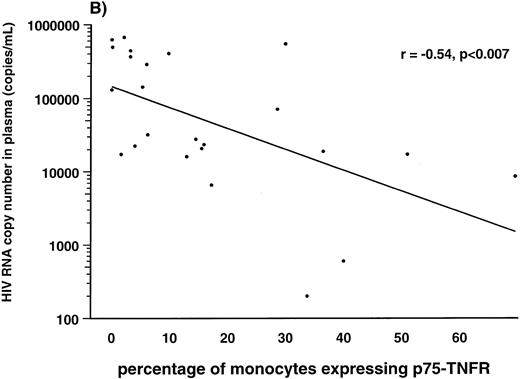
Correlations between HIV-1 viral load in plasma and soluble and membrane-bound components of the TNF system.Several lines of evidence suggest a strong association between the high number of HIV-1 RNA copies in plasma and disease progression in HIV-1–infected individuals.38 39 Therefore, we examined the correlation between number of HIV-1 RNA copies in plasma and the different TNF parameters in 24 of the HIV-1–infected patients. First, we found a strong positive correlation between serum levels of soluble p75-TNFR and HIV-1 RNA copy numbers (r = .69, P < .001). In addition, serum levels of soluble p55-TNFR (r = .46, P < .02), but not serum levels of TNF-α (r = .35, P > .05), were also significantly correlated with plasma HIV-1 RNA copy numbers. In contrast to the positive correlation with levels of sTNFRs, we found a negative correlation between percentage of both monocytes and lymphocytes expressing membrane-bound p75-TNFR and HIV-1 load in plasma (r = −.70, P < .001 and r = −.54, P < .007, lymphocytes and monocytes, respectively; Fig 3). Also the percentage of lymphocytes and monocytes expressing p55-TNFR tended to be negatively correlated with viral load, although the correlations did not reach statistical significance (data not shown). Finally, the percentage of TNF-α+ monocytes, but not TNF-α+ lymphocytes (data not shown), was also significantly, negatively correlated with viral load (r = −.41, P < .05). Thus, it appears that among the TNF parameters, serum levels of soluble p75-TNFR and expression of membrane-bound p75-TNFR on monocytes, as well as lymphocytes, are most strongly correlated with viral load in plasma of HIV-1–infected patients.
Correlation between percentage of lymphocytes (A) and monocytes (B) expressing membrane-bound p75-TNFR as measured by flow cytometry and HIV-RNA copies/mL in plasma in 24 HIV-1–infected patients.
Correlation between percentage of lymphocytes (A) and monocytes (B) expressing membrane-bound p75-TNFR as measured by flow cytometry and HIV-RNA copies/mL in plasma in 24 HIV-1–infected patients.
Correlations between levels of membrane-bound and soluble components of the TNF system in HIV-1–infected patients.As previously reported,6 7 and as can be seen in Table 1, HIV-1–infected patients have significantly higher serum levels of TNF-α and both types of sTNFRs than healthy controls, with the highest levels in CDC group C. When examining the correlations between the serum levels of soluble TNF components and the percentage of TNF-α+, p55-TNFR+, and p75-TNFR+ PBMC in HIV-1–infected patients, we observed a significant negative correlation between the levels of the soluble TNF components and the expression of the membrane-bound counterpart (r = −.58, P < .001; r = −.40, P < .03, and r = −.60, P < .001; TNF-α, p55- and p75-TNFR, respectively). Similar patterns of correlations between soluble and membrane-bound TNF components were also found when the expression of the membrane-bound components were analyzed separately for lymphocytes and monocytes (data not shown). Thus, the HIV-1–infected patients with the most advanced clinical and immunologic disease and the highest viral load in plasma are characterized by high serum levels of TNF-α and sTNFRs and low expression of the corresponding membrane-bound component of the TNF system on lymphocytes and monocytes compared with other HIV-1–seropositive patients.
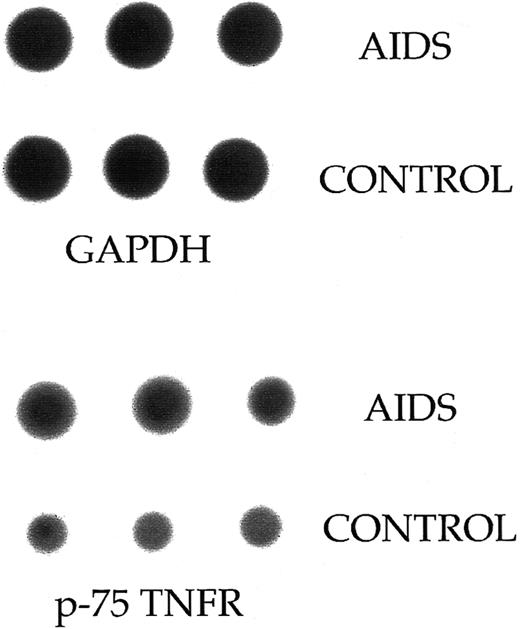
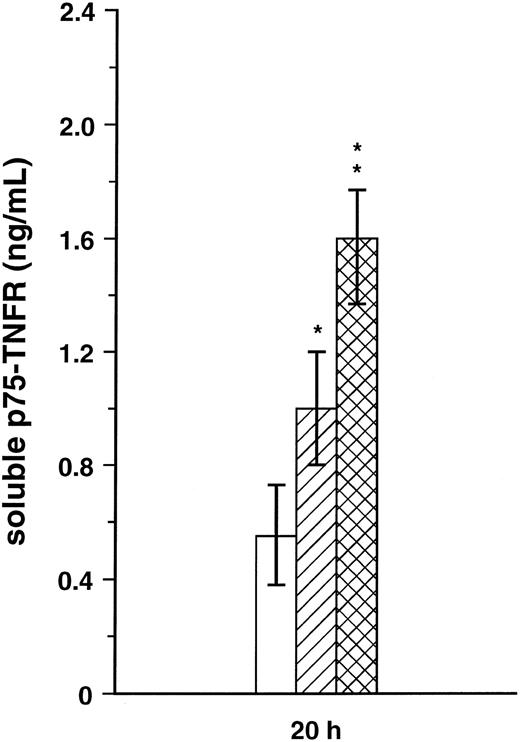
Release of soluble p75-TNFR in PBMC supernatant.The significant inverse correlation in HIV-1–infected patients between proportion of p75-TNFR+ PBMC and serum levels of soluble p75-TNFR might suggest that the reduced p75-TNFR expression reflects increased cell surface turnover of this TNFR. To further elucidate this question, we first analyzed the mRNA level for p75-TNFR in PBMC from three patients in CDC group C and three healthy controls. Although PBMC from these patients had lower surface expression of p75-TNFR, patient cells had higher mRNA levels for this TNFR than PBMC from healthy controls (∼70% increase, Fig 4). Furthermore, we analyzed the spontaneous release of soluble p75-TNFR from PBMC after 20 hours in culture in four patients from CDC group B, four patients from CDC group C, and five healthy controls. Interestingly, both patients in CDC group B with high percentage of p75-TNFR+ PBMC and patients in CDC group C with low percentage of p75-TNFR+ PBMC, had significantly elevated concentration of soluble p75-TNFR in PBMC supernatants compared with healthy controls, with the highest levels in the CDC group C (∼70% and 185% higher levels than in controls, CDC group B and C, respectively; Fig 5). Thus, low percentage of p75-TNFR+ PBMC and high serum levels of soluble p75-TNFR in patients from CDC group C are accompanied by increased mRNA p75-TNFR levels, as well as enhanced spontaneous release of soluble p75-TNFR, from PBMC in these patients.
Dot blot analysis of mRNA levels for p75-TNFR in freshly isolated PBMC from three AIDS patients and three healthy controls. When comparing mRNA levels between HIV-1–infected patients and healthy controls, a quantitative estimate of the p75-TNFR mRNA was attempted by comparing with mRNA level for the GAPDH gene.
Dot blot analysis of mRNA levels for p75-TNFR in freshly isolated PBMC from three AIDS patients and three healthy controls. When comparing mRNA levels between HIV-1–infected patients and healthy controls, a quantitative estimate of the p75-TNFR mRNA was attempted by comparing with mRNA level for the GAPDH gene.
Spontaneous release of soluble p75-TNFR was analyzed in cell-free PBMC (3 × 10⁶ cells/mL) supernatants after 20 hours (h) in four symptomatic non-AIDS patients (▨, CDC group B), four AIDS patients (, CDC group C), and five healthy controls (□). *P < .05 versus controls, **P < .05 versus both controls and CDC group B.
Spontaneous release of soluble p75-TNFR was analyzed in cell-free PBMC (3 × 10⁶ cells/mL) supernatants after 20 hours (h) in four symptomatic non-AIDS patients (▨, CDC group B), four AIDS patients (, CDC group C), and five healthy controls (□). *P < .05 versus controls, **P < .05 versus both controls and CDC group B.
DISCUSSION
The presence of persistent and inappropriate TNF activation in HIV-1 infection and the correlation with serum levels of TNF-α and sTNFRs with disease progression in HIV-1–infected patients, suggest a central role for the TNF system in the immunopathogenesis of HIV-1 infection.2,5 6 However, the interpretation of the pathogenic role of the TNF system in HIV-1 infection cannot be exclusively based on the levels of soluble TNF components, but requires a knowledge of the expression of their membrane-bound counterparts on various cells. Therefore, to achieve more insight into the pathogenic role of TNF activation in HIV-1 infection, it is of importance to obtain a more precise knowledge regarding the regulation of the different components of the TNF system, especially the membrane-bound components, in different stages of this disease.
The present study shows for the first time in HIV-1–infected patients that the proportions of PBMC, as well as lymphocytes and monocytes, expressing mTNFα and mTNFRs show significant variations in relation to disease stage, viral load, numbers of CD4+ lymphocytes in peripheral blood, and parameters of immune activation in vivo. Thus, while patients in earlier stages, CDC group A and B with only a moderate decrease in numbers of CD4+ lymphocytes, are characterized by increased percentages of both lymphocytes and monocytes expressing mTNFα and mTNFRs compared with healthy controls, this was not found in the AIDS group. In fact, AIDS patients with markedly decreased numbers of CD4+ lymphocytes showed a significantly decreased percentage of both lymphocytes and monocytes expressing membrane-bound p75-TNFR even compared with healthy individuals.
In contrast to the membrane-bound TNF components, circulating levels of soluble TNF components among HIV-1–infected patients show a gradual increase with disease stage with the highest levels in the AIDS group. This might suggest enhanced shedding of sTNFRs from PBMC in HIV-1 infection, and indeed, the present study shows significantly elevated spontaneous release of soluble p75-TNFR from PBMC in vitro in both AIDS patients and other HIV-1–infected patients. However, while PBMC from symptomatic non-AIDS patients were characterized by a moderately enhanced release of soluble p75-TNFR together with an increased percentage of cells expressing p75-TNFR, PBMC from AIDS patients showed a markedly enhanced release of soluble p75-TNFR together with a decreased percentage p75-TNFR+ cells. This, together with increased p75-TNFR mRNA levels in PBMC from AIDS patients, strongly suggests that decreased expression of membrane-bound p75-TNFR on PBMC in these patients reflects increased intracellular production and enhanced cell surface turnover rather than decreased synthesis of this TNFR. Several factors have been found to induce the release of sTNF-α and sTNFRs from PBMC concomitant with downregulation of their membrane-bound counterparts both in vitro and in vivo.40-43 Some of these factors may also be operative in advanced HIV-1 disease, eg, persistent antigen stimulation associated with opportunistic infections or HIV-1 itself, as well as increased interleukin-10 (IL-10) activity.1 44
In contrast to the low percentage of both monocytes, lymphocytes as a whole and CD8+ lymphocytes expressing mTNFRs and mTNF-α in the AIDS group, the latter patients had increased percentage of CD4+ lymphocytes coexpressing mTNF-α, p55-TNFR, and p75-TNFR among remaining CD4+ cells. Of considerable interest in relation to these findings is the suggestion that HIV-1 infection can enhance the expression of mTNFRs in CD4+ lymphocytes and thereby increase TNF-α–induced enhancement of its own replication.45 Furthermore, the elevated expression of mTNFRs on CD4+ lymphocytes from AIDS patients in combination with increased soluble TNFα concentrations, might play an important role in the induction of increased apoptosis found in CD4+ lymphocytes from these patients.8 Thus, both the positive feedback of TNF-induced replication of HIV-1 in remaining CD4+, cells as well as TNF-related apoptosis of these cells might play an important pathogenic role in the enhanced HIV-1 replication and accelerated CD4+ lymphocyte destruction seen in advanced HIV-1–related disease. Furthermore, our findings showing reduced percentage of CD8+ lymphocytes expressing mTNF-α and mTNFRs in AIDS patients may possibly be of importance for the impaired antiviral activity in advanced HIV-1 disease.4
A striking observation in the present study was the markedly decreased percentage of monocytes expressing membrane-bound p75-TNFR in AIDS patients. Interestingly, recent studies have suggested that mTNF-α on CD4+ lymphocytes, rather than sTNFα, through interaction with membrane-bound p75-TNFR on monocytes, may play an important role in killing of intracellular microbes,21 and this interaction seems also to have an important influence on the cellular response to stimulation of p55-TNFR by sTNF-α.13 Thus, the observed decrease of p75-TNFR+ monocytes, combined with our findings of decreased percentage of CD8+ lymphocytes from AIDS patients expressing mTNF-α and mTNFRs,46 may contribute to the impaired killing of Mycobacterium avium complex and other intracellular pathogens in patients with advanced HIV-1–related disease despite enhanced immune activation manifested by very high levels of sTNF-α in serum.47
Furthermore, although AIDS patients had decreased percentage of p75-TNFR+ monocytes compared with healthy controls, these patients had a small increase in the percentage of p55-TNFR+ monocytes, resulting in a striking discrepancy in ratio of membrane-bound p55-TNFR+/p75-TNFR+ monocytes between AIDS patients and healthy individuals. This altered ratio of the two TNFRs on monocyte surface might also contribute to the monocyte dysfunction observed in these patients.4,13,25 Especially, stimulation of p75-TNFR may lead to other effects on HIV-1 replication than p55-TNFR stimulation. A recent study has suggested that stimulation of p75-TNFR on monocytes may negatively modulate enhanced HIV-1 replication mediated by p55-TNFR stimulation.48 Thus, the marked downregulation of p75-TNFR together with increased ratio of p55-TNFR+/p75-TNFR+ monocytes in AIDS patients may possibly contribute to enhanced HIV-1 replication in this cell subpopulation in advanced clinical and immunologic disease.49
Although all the mTNF parameters examined showed reduced expression on monocytes and lymphocytes in AIDS patients compared with other HIV-1–infected patients, only p75-TNFR expression showed a significant negative correlation with HIV-1 RNA copy numbers in plasma. In addition, as recently reported by others,50 increased serum levels of soluble p75-TNFR were also significantly correlated with high numbers of HIV-1 RNA copies in plasma. Taken together, our findings indicate that among TNF parameters, p75-TNFR, soluble as well as membrane-bound, may be useful prognostic markers in HIV-1 infection which could possibly be used for monitoring effects of both antiviral and immune modulating therapy in HIV-1–infected patients.
The results of the present study show the complexity of HIV-1–induced modulation of the TNF system depending on the degree of immunodeficiency, HIV-1 replication, and clinical stage of disease. Furthermore, the markedly decreased proportion of mTNFRs+ monocytes and CD8+ lymphocytes in AIDS patients, together with the increased proportion of CD4+ lymphocytes coexpressing both mTNFRs and mTNF-α in this patient group, might be of importance for the accelerated CD4+ lymphocyte destruction, the enhanced HIV-1 replication, and the markedly impaired microbicidal capacity seen in advanced HIV-1–related disease.
ACKNOWLEDGMENT
We thank Bodil Lunden and Lisbeth Wikeby for excellent technical assistance.
Supported by the Norwegian Cancer Society, the Research Council of Norway, Anders Jahre's Foundation, Medinnova Foundation, and Odd Kåre Rabben's Memorial Fund for AIDS Research (Oslo, Norway).
Address reprint requests to Stig S. Frøland, MD, PhD, Section of Clinical Immunology and Infectious Diseases, Medical Department A, The National Hospital, Rikshospitalet, N-0027 Oslo, Norway.

