Abstract
The Wilms' tumor gene, WT1, encodes a transcription factor of the Cys2-His2 zinc finger type. The functional significance of WT1 expression in leukemias, in addition to tissues and cell lines of hematopoietic origin, has not been determined. Using the murine myeloblastic leukemia cell line M1 as a model for macrophage differentiation, expression of WT1 is shown to be activated in M1 cells 24 hours after differentiation induction by leukemia inhibitory factor (LIF). Upregulation ofWT1 in these cells is associated with cellular differentiation, coinciding with expression of the monocyte/macrophage marker c-fms, and the appearance of mature cells. WT1 isoforms lacking the KTS insert are unable to be ectopically expressed in M1 cells. Stable expression of the WT1 isoforms containing the KTS insert leads to spontaneous differentiation of the M1 myeloblasts through the monocytic differentiation pathway. These cells express c-fms,in addition to the myeloid-specific cell surface marker Mac-1. Exposure of these cells to LIF results in the rapid onset of terminal macrophage differentiation, accompanied by apoptotic cell death. These results show that the WT1 gene is an important regulator of M1 cell monocytic differentiation in vitro, and suggests a potential role for this gene in the molecular control of hematopoiesis.
THE WILMS' TUMOR suppressor gene,WT1, encodes a member of the Cys2-His2zinc finger (ZF) family of transcription factors. WT1 possesses two characteristics which indicate a role in the regulation of gene transcription—four consecutive ZF DNA-binding domains at its carboxyl terminus, and a proline- and glutamine-rich transregulatory domain at its amino terminus.1 Other members of this group include the mitogen-inducible early growth response (EGR) proteins, such as EGR1,2,3 which shares approximately 60% homology at the amino acid level with WT1 within the ZF region.4
Two alternative splicing events within the WT1 gene lead to the production of four distinct isoforms of WT1.5 Alternative splice I (ASI) results in either the presence or absence of 51 bp (corresponding to exon 5 and encoding 17 amino acids) inserted between the transregulatory and ZF regions. Alternative splice II (ASII) results in either the presence or absence of 9 bp, encoding three amino acids (KTS), inserted between the third and fourth ZF DNA-binding domains. Splicing of exon 5 is thought to modulate the strength of DNA-binding and/or transcriptional activity of +KTS isoforms,6,7 while splicing within the ZF domain confers sequence-specificity of DNA binding. In vitro studies have shown that isoforms which lack the KTS insert bind an EGR1-like consensus motif (5′-GNGNGGGNG-3′),8 and primarily act as repressors of gene transcription from a number of promoters which contain this sequence, such as the platelet-derived growth factor-A (PDGF-A), macrophage colony-stimulating factor (M-CSF), retinoic acid receptor-α (RAR-α), bcl-2, and c-mycpromoters.9-14 WT1 isoforms containing the KTS insert do not bind the EGR1-like motif, but recognize other sequences whose biological significance is yet to be characterized.15 In addition, sequences have been defined to which both ±KTS forms of WT1 show affinity; however, their function is also unclear.16,17 A role for WT1 outside the control of gene transcription has been proposed with the discovery of an RNA recognition motif (RRM) within its amino terminus,18 and the observation that +KTS forms of WT1 may associate with components of the mRNA splicing machinery within the nucleus.19 20
First implicated in the development of Wilms' tumor,21,22an embryonal malignancy of the kidney,23 the WT1gene has been found to play a vital role in the control of cellular proliferation and/or differentiation within the genitourinary system. WT1 is expressed in the early metanephric stem cells, and increases upon cellular condensation around the ureteric bud and induction of differentiation into epithelial structures, with expression eventually confined to the podocyte layer of the glomeruli.24 Mice null for WT1 exhibit a complete abrogation in normal kidney development.25
The expression of WT1 in cells of hematopoietic origin has led to speculation that this gene may also play a role in the molecular control of proliferation and/or differentiation within blood cell development. WT1 is expressed in the spleen and thymus,1,26 in addition to CD34+ hematopoietic stem and progenitor cells (HSCs; HPCs),27 and leukemic cell lines primarily of myeloid origin.28 Expression ofWT1 in the leukemic cell lines HL60 and K562 is downregulated upon induction of differentiation,29,30 and, in the case of K562 cells, antisense WT1 oligonucleotides have been shown to inhibit proliferation and induce apoptosis.31WT1is also expressed in phenotypically immature myeloid leukemias, such as acute myeloid leukemia (AML) and blast crisis of chronic myeloid leukemia (CML-BC).32 Genetic analysis has revealed the mutation rate of WT1 in AMLs to be 15%, with all mutations predicted to lead to truncation and subsequent disruption of the ZF DNA-binding domain.33 Expression or mutation of WT1in acute leukemia appears to be an indicator of minimal residual disease (MRD) and poor prognosis,27,33-35 with a recent study suggesting that WT1 is expressed in leukemic cells at a level ten times higher than that found in normal hematopoietic cells.36
Leukemic cell lines provide useful model systems in which to dissect the molecular mechanisms responsible for inducing hematopoietic cell differentiation, and how blocks in these signals lead to disease onset. The myeloblastic leukemia cell line M1 was generated from a spontaneous leukemia which arose within the SL strain of mice37 and can be induced to undergo terminal macrophage differentiation, coupled to growth arrest and apoptosis of mature cells,38 by leukemia inhibitory factor (LIF), interleukin-6 (IL-6), or oncostatin M (OsM).39-41 In this study, we have examined the function of the WT1 gene in the molecular control of M1 cell macrophage differentiation. Our results suggest that the WT1 gene has an important capacity to regulate monocytic differentiation within these cells, and provides further evidence of a putative role for this gene in normal hematopoietic cell differentiation, especially within the myelomonocytic lineage.
MATERIALS AND METHODS
Cells and cell culture.
The murine myeloblastic leukemia cell line M1 was maintained in Dulbecco's modified Eagle's medium (DMEM; GIBCO-BRL, Grand Island, NY) supplemented with 10% fetal calf serum (FCS) (QIMR, Brisbane, Australia), and kept at 37°C in a humidified atmosphere with 10% CO2. Viable cell numbers were determined by eosin dye exclusion upon counting in a hemocytometer. Recombinant murine LIF (a gift from AMRAD Biotech, Melbourne, Australia) was titrated on M1 cells for optimal differentiation-inducing properties, and added to experimental cultures at a concentration of 1 ng/mL. Time-course analyses in the presence or absence of LIF were performed by seeding cells at a density of 0.1 to 1 × 10⁵ cells/mL, except in cultures for RNA or DNA extraction in which initial cell concentrations were adjusted to give less than or equal to 1 × 10⁶cells/mL at the time of extraction. Clonogenic potential following exposure to LIF was assessed by colony formation in soft agar. After thorough washing, 200 cells in 1 mL of Iscove's modified Dulbecco's medium (IMDM; GIBCO-BRL) supplemented with 10% FCS (HyClone Laboratories, Inc, Logan, UT) and 0.3% Bacto-Agar (DIFCO Laboratories, Detroit, MI) were plated in 35-mm Petri dishes in the absence of further stimuli, and kept at 37°C in a humidified atmosphere with 5% CO2. Colony formation (>50 cells) was scored after 7 days, and the number of clonogenic cells in the original culture was calculated based on the proportion of cells used in the colony assay.
Vector construction.
The 1.5-kb Sau3AI cDNA fragments encoding the four individual murine WT1 isoforms were excised from the respective pCMV3-WT1 vectors (obtained from Dr Jerry Pelletier, Montreal, Canada) and inserted separately into the BamHI site of the retroviral vector pHEDMP1, enabling constitutive expression of the WT1 splice forms from the Moloney murine leukemia virus (MMLV) 5′-long terminal repeat (LTR). This retroviral vector is a derivative of pHEDMo (obtained from Dr Suzanne Cory, Melbourne, Australia),42and was constructed by the exchange of the Cla I/EcoRI MMLV 3′-LTR fragment of pHEDMo with the equivalent fragment from the murine myeloproliferative sarcoma virus (MPSV) 3′-LTR obtained from pMPZen.43 A control vector containing the 1.3-kbBglII/BamHI cDNA fragment of the neomycin-resistance gene, excised from pBR-neo, in place of WT1 was also constructed. All vectors were purified on CsCl2 gradients, and sequenced (as described below) to verify their identity and ensure that translation start and stop codons were intact.
Mammalian cell transfection.
M1 cells were electroporated using a BioRad Gene Pulser (BioRad, Hercules, CA). Briefly, 1 × 10⁷ M1 cells were resuspended in 0.8 mL of DMEM, and transfected at 280 V, 960 μF with 20 μg of each pHEDMP1.WT1 vector combined with 2 μg of pSV2Neo (10:1 wt/wt ratio, respectively), or 10 μg of pHEDMP1.Neo alone as a control. All vectors were linearized with EcoRI before electroporation. Geneticin-resistant populations of transfected cells were selected on 400 μg/mL active G418 (GIBCO-BRL), and subsequently maintained at a concentration of 200 μg/mL active G418. M1 cells transfected with the individual WT1 splice forms were designated (with reference to ASI and ASII, respectively): M1.WT1.1 (+/+); M1.WT1.2 (−/+); M1.WT1.3 (+/−); and, M1.WT1.4 (−/−). M1 cells transfected with the neomycin-resistance gene were designated M1.Neo. Integration of the transgene in M1 cells was detected by Southern blotting, and expression of the WT1 transgene determined by both Northern and Western blotting, as described below.
Assay for differentiation.
Morphological differentiation of M1 cells was determined by counting 200 cells on Leishman's-stained cytospin preparations. The degree of differentiation was enumerated based on the proportion of immature blast cells to cells at intermediate monocyte and mature macrophage stages.
Assay for chromosomal DNA fragmentation.
The onset of apoptosis in experimental cultures was determined by assessing the degree of chromosomal DNA fragmentation within cells isolated at specific timepoints. Cells (1 × 10⁶) were resuspended in 0.5% sodium dodecyl sulfate (SDS), 10 mmol/L EDTA, 50 mmol/L Tris-HCl, pH 8.0; and treated with 200 μg/mL proteinase K (Merck, Darmstadt, Germany) for 1 hour at 50°C. Lysates were further treated for 1 hour at 50°C with 150 μg/mL RNAase A (Sigma Chemical Co, St Louis, MO), followed by electrophoresis on a 2% agarose gel in 0.5× TBE (1× TBE is 89 mmol/L Tris-borate, 2 mmol/L EDTA, pH 8.0) buffer.
DNA probes.
Probes for Southern and Northern blotting were prepared by restriction enzyme digestion followed by purification on agarose gels. The 960-bpDrd I cDNA fragment of murine WT1 was used to detect expression of the WT1 transgene. Expression of the murine monocyte/macrophage marker c-fms was detected using the 1.5-kb cDNA BstXI cDNA fragment. Equal loading and quality of RNA samples on Northern blots was monitored by probing with the 638-bpTaq I cDNA fragment of murine β-actin. High specific-activity probes were generated by random priming using Amersham's Megaprime DNA labelling system and [α-32P]-dCTP (Amersham, Arlington Heights, IL).
Genomic DNA extraction, Southern blotting, and hybridization.
Cells for DNA extraction (1 to 5 × 10⁷) were resuspended in 0.5% SDS, 1 mmol/L EDTA, 100 mmol/L Tris-HCl, pH 8.0, containing 250 μg/mL proteinase K (Merck), and left overnight at 65°C. DNA was purified by chloroform extraction and ethanol precipitation. After digestion with appropriate restriction enzymes, 10 μg of DNA was electrophoresed on a 0.8% agarose gel in 1× TBE buffer and transferred onto Hybond-N membrane (Amersham) using standard techniques. Filters were prehybridized in 5× SSPE (1× SSPE is 150 mmol/L sodium chloride, 10 mmol/L sodium phosphate, 1 mmol/L EDTA, pH 7.4), 5× Denhardt's solution, 1% SDS, 10 mmol/L sodium pyrophosphate, 100 μg/mL denatured sheared salmon sperm DNA at 65°C for 5 hours. Denatured probe was added to the filters and hybridization allowed to proceed overnight at 65°C, followed by washing under stringent conditions to 0.5× SSPE, 0.1% SDS at 65°C. Filters were exposed to X-OMAT AR film (Eastman Kodak, Rochester, NY) using intensifying screens at −70°C.
RNA extraction, Northern blotting, and hybridization.
Total RNA was extracted from 0.5 to 1 × 10⁸ cells, or tissue samples, using guanidinium isothiocyanate, and purified by ultracentrifugation through a CsCl2 cushion.44Equal amounts (5 μg) of total RNA were run on a 1.2% agarose-400 mmol/L formaldehyde gel in 1× MOPS (20 mmol/L 3-(N-morpholino)propane-sulfonic acid, 5 mmol/L sodium acetate, 1 mmol/L EDTA, pH 7.0) buffer, and transferred to Hybond-N membrane (Amersham) using standard techniques. Filters were prehybridized and hybridized as described for Southern blotting, but were washed to a stringency of 1× SSPE, 0.1% SDS at 65°C. Filters were autoradiographed as previously described.
Protein extraction, Western blotting, and hybridization.
Cells for protein extraction (1 to 5 × 10⁷) were lysed in radioimmunoprecipitation assay (RIPA) buffer (0.1% SDS, 1% sodium deoxycholate, 1% Triton X-100 (Sigma Chemical Co), 150 mmol/L NaCl, 1 mmol/L EDTA, 10 mmol/L Tris-HCl, pH 7.4) containing 100 μg/mL phenylmethylsulfonyl fluoride (PMSF), 2 μg/mL leupeptin, and 2 μg/mL aprotinin (Sigma Chemical Co) as protease inhibitors. Equivalent amounts (20 μg) of protein lysate were separated on an SDS-10% polyacrylamide gel, and transferred to Hybond-ECL membrane (Amersham). An identical gel was stained with Coomassie Brilliant Blue R-250 (BioRad) to confirm samples were loaded equally. Cellular expression of murine WT1 was detected using the cross-species WT (C-19) rabbit anti-human-WT1 IgG antibody (Santa Cruz Biotechnology, Inc, Santa Cruz, CA), in combination with Amersham's donkey anti-rabbit–IgG whole antibody conjugated to horseradish peroxidase, as part of the enhanced chemiluminescence (ECL) Western blotting analysis system (Amersham). Filters were exposed to BIOMAX MR film (Eastman Kodak).
Reverse transcriptase-polymerase chain reaction (RT-PCR).
Total RNA (2 μg) was heat denatured at 70°C for 5 minutes, then reverse transcribed in 1× Perkin-Elmer GeneAmp PCR Buffer II (Roche, Branchburg, NJ) supplemented with 4.5 mmol/L MgCl2, 1 mmol/L dithiothreitol, 500 μmol/L of each deoxynucleoside triphosphate (dNTP), 10 μg/mL random hexamers, and 0.4 U of Inhibit-ACE (5 Prime → 3 Prime, Inc, Boulder, CO) using 80 U of MMLV reverse transcriptase (GIBCO-BRL) in a final volume of 40 μL. Samples were incubated at 37°C for 2 hours. Aliquots (2 μL) of cDNA were then used as template for subsequent PCR amplifications. PCR of murine WT1 was performed in 1× Perkin-Elmer GeneAmp PCR Buffer II supplemented with 1.5 mmol/L MgCl2, 2.5% formamide, 250 μmol/L of each dNTP, and 40 pmol of each primer using 1.25 U of Perkin-Elmer AmpliTaq DNA polymerase (Roche) in a final volume of 40 μL. WT1 primers used in this study were directed to the ZF region of the gene, and consisted of a 5′ primer 5′-CCCAGGCTGCAATAAGAGATA-3′ (exon 7) and a 3′ primer 5′-ATGTTGTGATGGCGGACCAAT-3′ (exon 10). WT1 PCR was performed with an annealing temperature (AT) of 57°C for 25 cycles. The PCR product was agarose gel purified and sequenced (described below) to verify its identity. Amplification of the murine monocyte/macrophage marker c-fms was carried out in 1× Perkin-Elmer GeneAmp PCR Buffer II supplemented with 1.5 mmol/L MgCl2, 250 μmol/L of each dNTP, and 10 pmol of each primer using 1 U of Perkin-Elmer AmpliTaq DNA polymerase in a final volume of 25 μL. Primers used to detect c-fms consisted of a 5′ primer 5′-CTTGCAGGAGGTGTCTGTGG-3′ and a 3′ primer 5′-TTCTGACTCAGGACTTCAGGG-3′, and PCR was performed with an AT of 61°C for 28 cycles. The amount and quality of cDNA added to the PCR was monitored by amplification of murine β-actin using the same conditions as for c-fms except MgCl2 was added to a final concentration of 2.36 mmol/L. Primers used to detect β-actin consisted of a 5′ primer 5′-GACATGGAGAAGATCTGGCA-3′ and a 3′ primer 5′-GGTCTTTACGGATGTCAA-CG-3′, and PCR was performed with an AT of 60°C for 20 cycles. All products (5 μL) were run on 1.5% agarose gels in 1 × TAE (40 mmol/L Tris-acetate, 2 mmol/L EDTA, pH 8.5) buffer.
Flow cytometric analysis.
Expression of the cell surface marker Mac-1 was determined by immunolabeling followed by flow cytometric analysis. Cells (1 × 10⁶) were resuspended in 50 μL of phosphate-buffered saline supplemented with 5% FCS (QIMR) (PBS/FCS) and incubated with 50 μg/mL murine IgG (Sigma Chemical Co) for 5 minutes on ice to block nonspecific Ig binding at Fc-γ receptor sites. After washing in PBS/FCS, cells were incubated for 15 minutes on ice with the biotinylated M1/70.15.11.5 monoclonal antibody which is specific for the murine myeloid-specific marker Mac-1 present on monocytes and macrophages. Cells were washed as before, and Mac-1–stained cells further incubated with streptavidin-FITC conjugate (Progen Industries Ltd, Brisbane, Australia) for 15 minutes on ice. After final washing in PBS/FCS, cells were resuspended in 200 μL of the same buffer containing 2 μg/mL propidium iodide (PI). Control cells were stained with secondary conjugate or PI alone. Samples were gated on live cells (as determined by forward light-scattering properties and lack of PI staining) and analyzed for cell-surface marker expression by examining 1 × 10⁴ events on a FACScan or FACS Vantage (Becton Dickinson, San Jose, CA).
DNA sequencing.
All DNA sequencing reactions were performed using the ABI PRISM Dye Terminator Cycle Sequencing Ready Reaction Kit, followed by analysis on an ABI PRISM DNA Sequencer Model 377, according to the manufacturer's instructions (Applied Biosystems, Inc, Foster City, CA). Sequencing of inserts cloned into the retroviral vector pHEDMP1 was performed using primers directed to the vector, and consisted of a 5′ primer 5′-ACGTGAAGGCTGCCGACC-3′ and a 3′ primer 5′-AGCCTGGACCACTGATATCC-3′.WT1 PCR products were sequenced with the primers used in the original PCR as described above. Sequence comparisons were performed using FastA default parameters45 within GCG (Genetics Computer Group, Madison, WI).
RESULTS
Expression of WT1 is upregulated during LIF-induced macrophage differentiation of M1 cells.
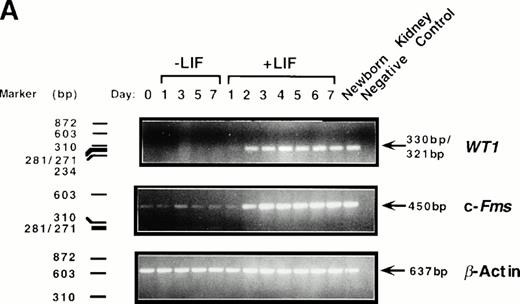
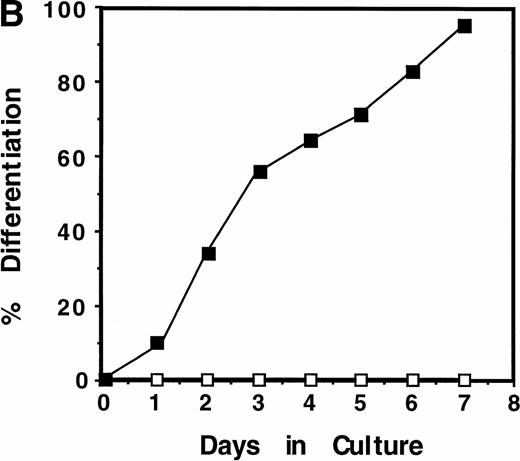
To determine whether levels of WT1 expression changed during M1 cell macrophage differentiation, cells were cultured in the presence or absence of LIF and total RNA isolated at various timepoints. RT-PCR analysis using primers directed to the ZF region of WT1 showed that WT1 mRNA was undetectable in undifferentiated parental M1 cells after 25 cycles of PCR amplification (Fig1A). However, expression of WT1 was upregulated during M1 cell differentiation induced by LIF, with a 330-bp/321-bp PCR product evident after 24 hours of LIF exposure and reaching maximal levels after 48 hours. This PCR product corresponds to ±ASII WT1 transcripts, encoding both ±KTS isoforms of WT1, which migrate as a single band on a 1.5% agarose gel. High levels ofWT1 expression continued until the final timepoint (7 days), and the level of WT1 expressed in differentiating M1 cells was comparable to that seen in RNA taken from the kidney of a newborn (1-day-old) mouse.
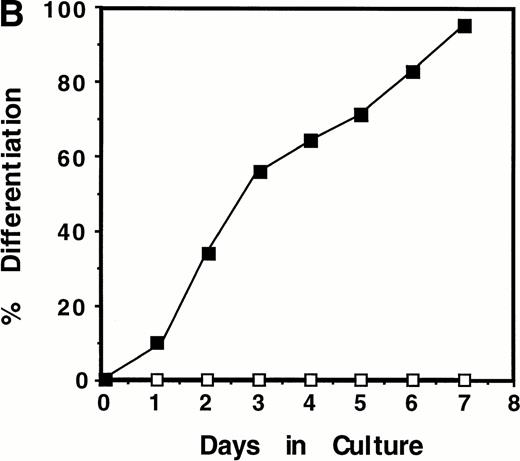
Induction of WT1 expression during LIF-induced macrophage differentiation of M1 cells. M1 cells were cultured in the presence or absence of LIF (1 ng/mL) for the indicated timepoints and assessed for: (A) expression of WT1,c-fms, and β-actin as determined by RT-PCR analysis of total RNA extracted from the cells (or from newborn murine kidney as a positive control), with the size and position of the ◊X174/HaeIII molecular weight markers indicated to the left of the gels; and (B) morphological differentiation as determined by Leishman's staining of cytospin preparations of the cells and scoring the proportion of blast cells to cells at intermediate monocytic and mature macrophage stages. (▪), M1 +LIF; (□), M1−LIF.
Induction of WT1 expression during LIF-induced macrophage differentiation of M1 cells. M1 cells were cultured in the presence or absence of LIF (1 ng/mL) for the indicated timepoints and assessed for: (A) expression of WT1,c-fms, and β-actin as determined by RT-PCR analysis of total RNA extracted from the cells (or from newborn murine kidney as a positive control), with the size and position of the ◊X174/HaeIII molecular weight markers indicated to the left of the gels; and (B) morphological differentiation as determined by Leishman's staining of cytospin preparations of the cells and scoring the proportion of blast cells to cells at intermediate monocytic and mature macrophage stages. (▪), M1 +LIF; (□), M1−LIF.
Upregulation of WT1 in M1 cells exposed to LIF was associated with cellular differentiation as expression of this gene was coregulated with that of the monocyte/macrophage marker c-fms,the receptor for M-CSF (Fig 1A). After 28 cycles of amplification, c-fms expression in M1 cells, visualized as a 450-bp PCR product following electrophoresis, was induced from basal levels after 48 hours exposure to LIF. WT1 expression during LIF-induced differentiation of M1 cells also coincided with the appearance of cells of differentiated morphology (Fig 1B).
As the WT1 primers used in this study were directed to the ZF region of the gene, and ZFs are conserved motifs in numerous transcription factors, the PCR product obtained from the WT1PCR was gel purified and sequenced to verify its identity. Sequence comparison using FastA45 showed this product to be 100% homologous to the murine WT1 ± ASII ZF domain (data not shown).
Constitutive ectopic expression of WT1 +KTS isoforms in M1 cells induces spontaneous monocytic differentiation.
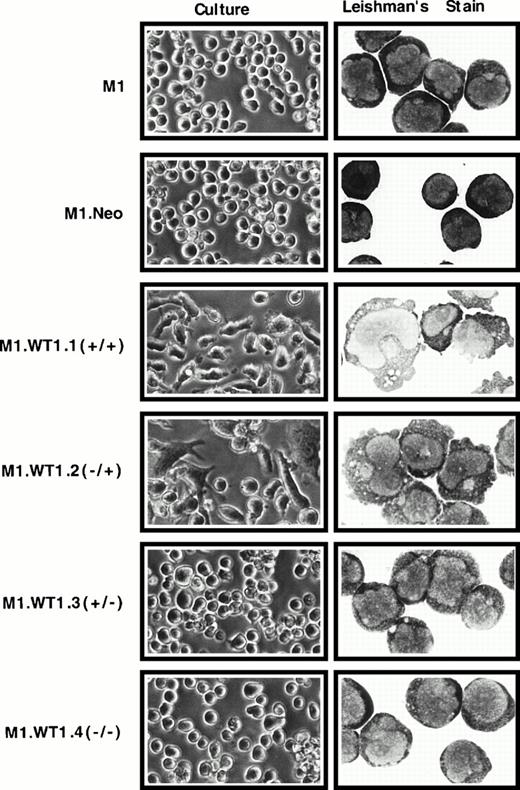
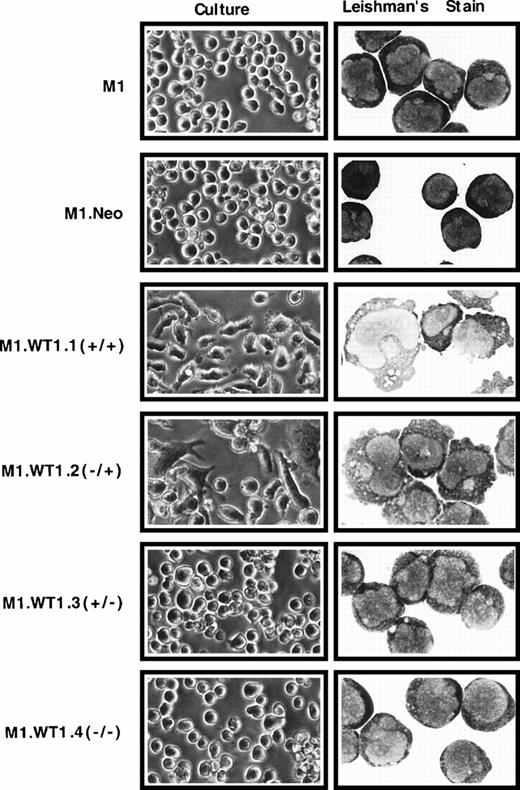
To ascertain whether the observed upregulation of WT1 during M1 cell differentiation induced by LIF was causally related to the differentiated phenotype of M1 cells, stable cell lines expressing each of the four individual isoforms of WT1 were established. WT1constructs were cotransfected with pSV2Neo, and the control neomycin vector transfected alone, into M1 cells, and G418-resistant pools of cells were obtained for each construct. Control M1.Neo cells were identical to the parental M1 cell line in culture. Upon Leishman's staining of cytospin preparations M1.Neo cells exhibited the typical blast morphology of M1 cells, with round, central nuclei with prominent nucleoli and a high nuclear:cytoplasmic ratio (Fig2). However, both M1.WT1.1 (+/+) and M1.WT1.2 (−/+) cells (transfected with transcripts which contain the ASII insert encoding the +KTS isoforms of WT1) spontaneously exhibited a mixed morphology in culture, consisting of nonadherent cells, in addition to adherent cell types possessing a flattened, elongated phenotype (Fig 2). Microscopic examination of M1.WT1.1 (+/+) and M1.WT1.2 (−/+) cells following Leishman's staining showed they had been induced to differentiate to various stages along the monocytic differentiation pathway, giving rise to a heterogeneous population of blast, intermediate, and mature monocytic stages (Fig 2). Mature stages displayed irregularly shaped nuclei, a reduced nuclear:cytoplasmic ratio, vacuolation and reduced basophilia of the cytoplasm, and blebbing of the cytoplasmic membrane. However, in contrast to parental M1 cells induced for terminal macrophage differentiation by LIF, these cells did not undergo terminal differentiation and could be passaged indefinitely as a persistent cell line in culture. Despite the obvious changes in M1 cells transfected with transcripts encoding the +KTS isoforms of WT1, it was noted that the G418-resistant pools of M1.WT1.3 (+/−) and M1.WT1.4 (−/−) cells (transfected with transcripts which lack the ASII insert encoding KTS) displayed little phenotypic change. Both of these populations more closely resembled parental and control cells in culture, and upon morphological staining (Fig 2). Enumeration of the proportion of cell types within each population is given in Table 1.
Induction of spontaneous monocytic differentiation in M1 cells transfected with WT1 +KTS isoforms. M1 cells stably transfected with retroviral vectors containing cDNAs encoding individual WT1 isoforms were compared with parental cells or control M1.Neo cells generated by transfection with a retroviral vector encoding neomycin-resistance. Differences in morphology were examined in culture (original magnification ×200) and by Leishman's staining of cytospin preparations (original magnification ×800).
Induction of spontaneous monocytic differentiation in M1 cells transfected with WT1 +KTS isoforms. M1 cells stably transfected with retroviral vectors containing cDNAs encoding individual WT1 isoforms were compared with parental cells or control M1.Neo cells generated by transfection with a retroviral vector encoding neomycin-resistance. Differences in morphology were examined in culture (original magnification ×200) and by Leishman's staining of cytospin preparations (original magnification ×800).
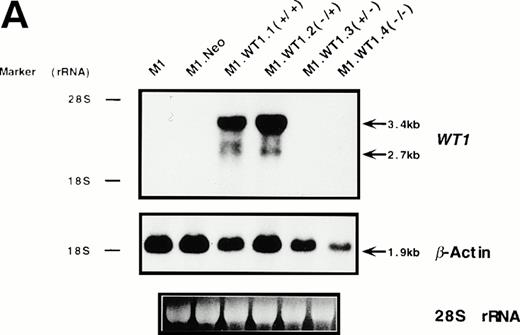
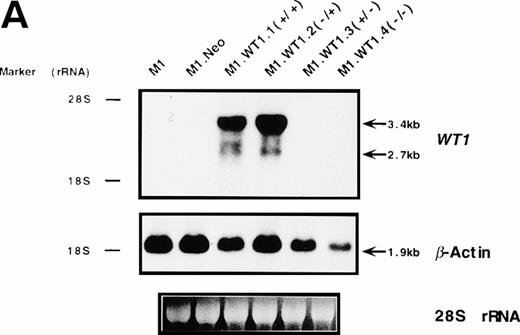
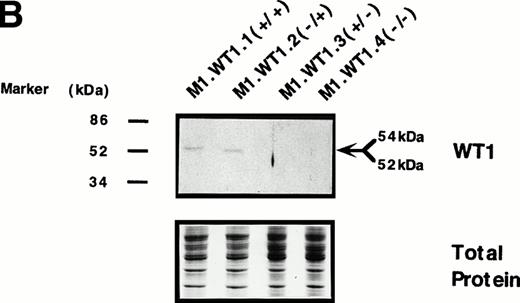
To determine whether the observed differences in phenotype between cells transfected with either the +ASII or −ASII splice forms could be attributed to differences in the levels of expression of theWT1 transgenes introduced into the cells, Northern analysis of RNA from the various populations was performed. Parental and control (M1.Neo) cells did not exhibit detectable levels of endogenousWT1 (Fig 3A). High levels of stable ectopic expression of the WT1 transgene in M1.WT1.1 (+/+) and M1.WT1.2 (−/+) cells were observed, with the genomic and subgenomic retroviral transcripts migrating at approximately 3.4 kb and 2.7 kb, respectively (Fig 3A). In contrast, barely detectable levels of exogenous WT1 expression were evident in M1 cells transfected with the WT1.3 (+/− ) and WT1.4 (−/−) splice forms (Fig 3A), with faint transcripts only appearing after a longer exposure of the autoradiograph (data not shown), despite Southern analysis showing that these cells did contain the WT1 transgenes (data not shown). Differences in RNA expression between ±ASII populations also corresponded to differences in the amount of ±KTS WT1 isoforms being translated in these cells. Western analysis confirmed that M1.WT1.1 (+/+) and M1.WT1.2 (−/+) cells were producing WT1 +KTS proteins of approximately 54 kD and 52 kD, respectively, corresponding to the presence or absence of the 17 amino acids encoded by the alternatively spliced exon 5 (±ASI), whereas M1.WT1.3 (+/−) and M1.WT1.4 (−/−) cells did not express detectable levels of WT1 −KTS isoforms (Fig 3B). Repeated experiments transfecting M1 cells with the WT1.3 (+/−) and WT1.4 (−/−) splice forms failed to generate high-level stable expressors of these isoforms in vitro.This indicated that the transgenes which lacked the ASII insert encoding KTS were unable to be stably expressed in M1 cells to the same levels as those which contained the ASII insert and, combined with an observed fivefold decrease in transfection efficiency for these transcripts (data not shown), suggests that high levels of expression of WT1.3 (+/−) and WT1.4 (−/−) transcripts may be detrimental to M1 cells. However, these results confirmed that the spontaneous induction of monocytic differentiation observed in M1.WT1.1 (+/+) and M1.WT1.2 (−/+) cells could indeed be attributed to the expression of WT1 +KTS isoforms in these cells, and these populations were chosen for further characterization.
Stable ectopic expression of WT1 +KTS isoforms, but not −KTS isoforms, in M1 cells. (A) Northern blotting of total RNA followed by hybridization with probes to WT1 and β-actin, with the 28S rRNA band shown below to illustrate equal loading of the samples on the gel, and the position of the 28S and 18S rRNA bands indicated to the left of the autoradiographs. (B) Western blotting of protein lysates followed by hybridization with an antibody specific for WT1, with an identical gel stained for total protein shown below to illustrate equal loading of the samples, and the size and position of the protein molecular weight markers indicated to the left of the autoradiograph.
Stable ectopic expression of WT1 +KTS isoforms, but not −KTS isoforms, in M1 cells. (A) Northern blotting of total RNA followed by hybridization with probes to WT1 and β-actin, with the 28S rRNA band shown below to illustrate equal loading of the samples on the gel, and the position of the 28S and 18S rRNA bands indicated to the left of the autoradiographs. (B) Western blotting of protein lysates followed by hybridization with an antibody specific for WT1, with an identical gel stained for total protein shown below to illustrate equal loading of the samples, and the size and position of the protein molecular weight markers indicated to the left of the autoradiograph.
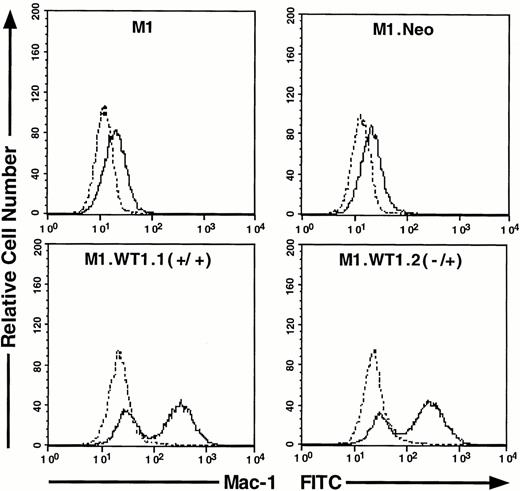
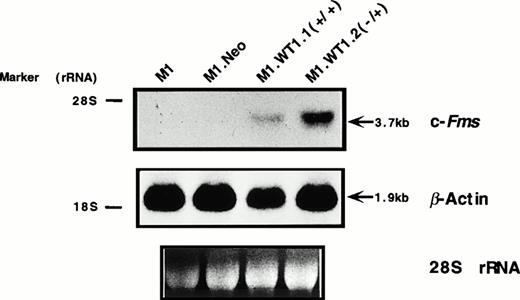
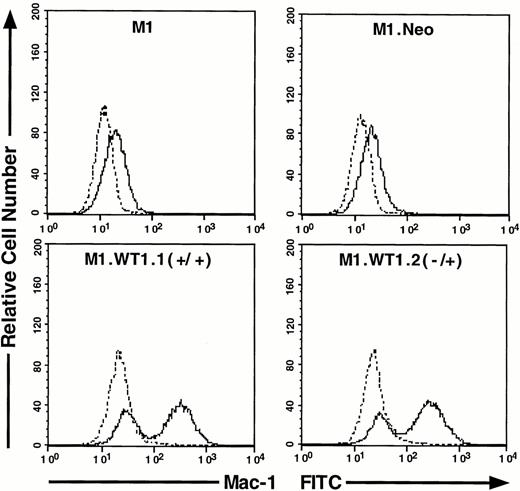
As M1.WT1.1 (+/+) and M1.WT1.2 (−/+) cells appeared to be morphologically more mature than parental M1 or control M1.Neo cells, they were evaluated for expression of cell surface myelomonocytic markers. Expression of c-fms mRNA was not detectable by Northern analysis in parental M1 or control M1.Neo cells (Fig4A). However, the 3.7-kb transcript for c-fms was expressed in RNA from M1.WT1.1 (+/+) and M1.WT1.2 (−/+) cells (Fig 4A), agreeing with the earlier finding suggesting that WT1 and c-fms are coregulated during M1 cell macrophage differentiation (Fig 1A). Flow cytometric analysis using an antibody specific for the Mac-1 complex (or C3bi receptor) showed that while M1 and M1.Neo cells were negative for cell-surface expression of this marker, 61% of M1.WT1.1 (+/+) cells and 68% of M1.WT1.2 (−/+) cells now stained positive for Mac-1. These results demonstrated that M1.WT1 +KTS cells, in addition to exhibiting morphological characteristics of monocytic differentiation, displayed a number of markers used to delineate the program of monocyte/macrophage differentiation in M1 cells.
Expression of c-fms and Mac-1 cell surface myelomonocytic markers in M1.WT1 +KTS cells. (A) Northern blotting of total RNA followed by hybridization with probes to c-fms and β-actin, with the 28S rRNA band shown below to illustrate equal loading of the samples on the gel, and the position of the 28S and 18S rRNA bands indicated to the left of the autoradiographs. (B) Flow cytometric analysis using a biotinylated antibody specific for Mac-1 followed by fluorescent detection with a streptavidin-FITC secondary conjugate, with control cells stained with secondary conjugate alone. (- - -), Control; (—), Mac-1.
Expression of c-fms and Mac-1 cell surface myelomonocytic markers in M1.WT1 +KTS cells. (A) Northern blotting of total RNA followed by hybridization with probes to c-fms and β-actin, with the 28S rRNA band shown below to illustrate equal loading of the samples on the gel, and the position of the 28S and 18S rRNA bands indicated to the left of the autoradiographs. (B) Flow cytometric analysis using a biotinylated antibody specific for Mac-1 followed by fluorescent detection with a streptavidin-FITC secondary conjugate, with control cells stained with secondary conjugate alone. (- - -), Control; (—), Mac-1.
Exposure of M1.WT1 +KTS cells to LIF induces the rapid onset of terminal macrophage differentiation accompanied by apoptotic cell death.
As M1.WT1 +KTS cells were phenotypically more mature than M1 or M1.Neo cells, their response upon exposure to LIF compared with parental and control cells was investigated. Cells were cultured in the presence or absence of LIF and isolated at the indicated timepoints. Cultures were assessed for cellular proliferation (determined by counting viable cell numbers), clonogenic potential (determined by agar colony formation in the absence of LIF), and differentiation (determined by Leishman's staining of cytospin preparations). Compared with untreated cells, upon exposure to LIF M1 and M1.Neo cells underwent a limited phase of proliferation (Fig 5A) coupled to a gradual loss in the ability to form colonies in soft agar (Fig 5B). Loss of clonogenicity in these cells could be attributed to an increase in their differentiative state over the 5-day period (Fig 5C). In the absence of LIF, M1.WT1.1 (+/+) and M1.WT1.2 (−/+) cells proliferated at a similar rate to parental M1 and control M1.Neo cells (Fig 5A). However, treatment of these cells with LIF resulted in an immediate suppression of proliferation, and a reduction in cell viability in these cultures. Few clonogenic cells could be detected from these cultures after 24 hours of exposure to LIF (Fig 5B). Examination of Leishman-stained cytospin preparations showed that inhibition of proliferation and colony formation in M1.WT1.1 (+/+) and M1.WT1.2 (−/+) cells after exposure to LIF was coupled to the induction of terminal macrophage differentiation of these cells. Starting from a basal level of containing approximately 60% differentiated cell types prior to LIF treatment, the proportion of differentiated cells within these cultures rose to almost 95% after 24 hours of exposure (Fig 5C).
Exposure of M1.WT1 +KTS cells to LIF results in the rapid suppression of proliferation and clonogenicity associated with the induction of terminal macrophage differentiation. M1 cell populations were cultured in the presence or absence of LIF (1 ng/mL) for the indicated timepoints and assessed for: (A) cellular proliferation as determined by counting viable cell numbers on eosin dye exclusion; (B) clonogenic potential as determined by colony formation in soft agar in the absence of LIF; and (C) differentiation as determined by Leishman's staining of cytospin preparations and scoring the proportion of blast cells to cells at intermediate monocytic and mature macrophage stages. (▪), M1 +LIF; (□), M1 −LIF; (▴), M1.Neo +LIF; (▵), M1.Neo −LIF; (⧫), M1.WT1.1 (+/+) +LIF; (◊), M1.WT1.1 (+/+) −LIF; (•), M1.WT1.2 (−/+) +LIF; (○), M1.WT1.2 (−/+) −LIF.
Exposure of M1.WT1 +KTS cells to LIF results in the rapid suppression of proliferation and clonogenicity associated with the induction of terminal macrophage differentiation. M1 cell populations were cultured in the presence or absence of LIF (1 ng/mL) for the indicated timepoints and assessed for: (A) cellular proliferation as determined by counting viable cell numbers on eosin dye exclusion; (B) clonogenic potential as determined by colony formation in soft agar in the absence of LIF; and (C) differentiation as determined by Leishman's staining of cytospin preparations and scoring the proportion of blast cells to cells at intermediate monocytic and mature macrophage stages. (▪), M1 +LIF; (□), M1 −LIF; (▴), M1.Neo +LIF; (▵), M1.Neo −LIF; (⧫), M1.WT1.1 (+/+) +LIF; (◊), M1.WT1.1 (+/+) −LIF; (•), M1.WT1.2 (−/+) +LIF; (○), M1.WT1.2 (−/+) −LIF.
After terminal macrophage differentiation of M1 cells induced by LIF or IL-6, mature cells undergo programmed cell death, or apoptosis, indicated by the onset of chromosomal DNA fragmentation.38As M1.WT1 +KTS cells exposed to LIF exhibited a decrease in cell viability, cultures were examined for the initiation of chromosomal DNA fragmentation suggestive of apoptosis. Electrophoresis of DNA from M1.WT1.2 (−/+) cells exposed to LIF showed that DNA fragmentation was induced in these cells 3 days after culture initiation (Fig6). M1.WT1.2 (−/+) cells left untreated, and parental M1 cells untreated or exposed to LIF, for the same period of time did not exhibit DNA fragmentation (Fig 6). The results obtained for M1.WT1.1 (+/+) cells were identical to those which were obtained for M1.WT1.2 (−/+) cells, and control M1.Neo cells mimicked parental M1 cells (data not shown).
Exposure of M1.WT1 +KTS cells to LIF results in the rapid onset of apoptotic cell death. M1 cell populations were cultured in the presence or absence of LIF (1 ng/mL) for the indicated timepoints and assessed for chromosomal DNA fragmentation by electrophoresis of the extracted DNA on 2% agarose gels, with the size and position of the ◊X174/HaeIII molecular weight markers indicated to the left of the gels.
Exposure of M1.WT1 +KTS cells to LIF results in the rapid onset of apoptotic cell death. M1 cell populations were cultured in the presence or absence of LIF (1 ng/mL) for the indicated timepoints and assessed for chromosomal DNA fragmentation by electrophoresis of the extracted DNA on 2% agarose gels, with the size and position of the ◊X174/HaeIII molecular weight markers indicated to the left of the gels.
DISCUSSION
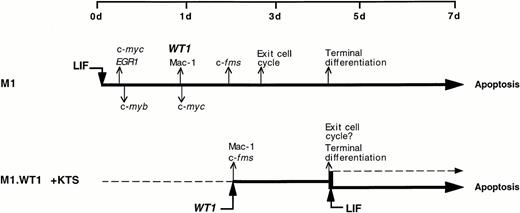
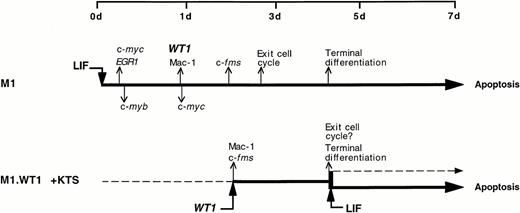
This investigation provides evidence that the Wilms' tumor suppressor gene, WT1, is a key mediator in the molecular control of monocyte/macrophage differentiation in the murine myeloblastic leukemia cell line M1. Although parental M1 cells do not express detectable levels of WT1, LIF-induced macrophage differentiation of these cells leads to the activation of WT1 expression after 24 hours, and coincides with the upregulation of the monocyte/macrophage marker c-fms and the appearance of mature cells (Fig 1). The notion that WT1 was playing a role in directing macrophage differentiation within M1 cells was examined by ectopically expressing WT1 isoforms in M1 cells. WT1 isoforms which lacked the KTS insert could not be stably expressed in M1 cells (Fig 3). However, stable ectopic expression was achieved with the +KTS isoforms of WT1, and resulted in the spontaneous differentiation of M1 blasts along the monocytic lineage. This gave rise to steady-state mixed populations of cells, comprised of blasts, promonocytes, and monocytes (Fig 2 and Table 1), which exhibited de novo expression of the myelomonocytic markers c-fms and Mac-1 (Fig 4). Exposure of M1.WT1 +KTS cells to LIF resulted in the rapid onset of terminal macrophage differentiation (Fig 5), which was followed by apoptotic cell death (Fig 6). The process of LIF-induced terminal differentiation, growth suppression and cell death in M1.WT1 +KTS cells was accomplished within 3 days, as opposed to 7 days for parental M1 cells exposed to LIF. This short-circuiting of the program of M1 cell differentiation within M1.WT1 cells most likely represents the completion of the normal LIF-induced pathway of macrophage differentiation spontaneously initiated in these cells by the stable expression of WT1 +KTS isoforms (Fig 7).
A schematic representation of the program of LIF-induced M1 cell differentiation (adapted and reprinted with permission from Selvakumaran et al)38 compared with that of M1.WT1 +KTS cells, showing the upregulation or downregulation of key genes involved in the cascade of events which mediate terminal differentiation associated with growth suppression and induction of apoptosis.
A schematic representation of the program of LIF-induced M1 cell differentiation (adapted and reprinted with permission from Selvakumaran et al)38 compared with that of M1.WT1 +KTS cells, showing the upregulation or downregulation of key genes involved in the cascade of events which mediate terminal differentiation associated with growth suppression and induction of apoptosis.
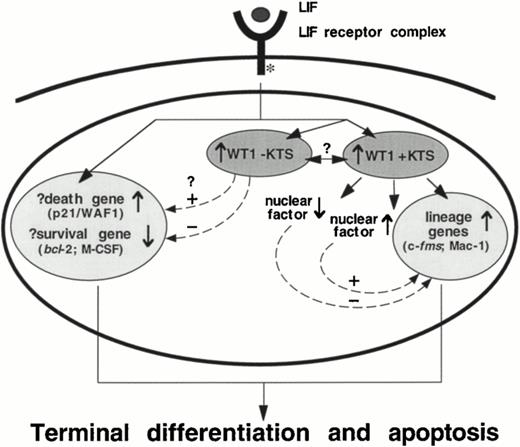
This study suggests that although WT1 +KTS isoforms are able to induce monocytic differentiation within M1 cells, a second signal evoked by LIF is required to complete the program of terminal macrophage differentiation initiated by WT1 expression in these cells. Therefore, in addition to the implications concerning the role of WT1 in directing monocytic differentiation, the results of this study have also revealed aspects of the signaling pathway which stems from the LIF receptor complex. M1.WT1 +KTS cells provide a model which illustrates that the monocytic differentiation program is a multi-step process that can be arrested at intermediate stages, and uncoupled from terminal differentiation normally associated with growth suppression and cell death. This implies that divergent signaling pathways within M1 cells are responsible for eliciting the separate responses induced by LIF (Fig 8). One pathway involves the +KTS isoforms of WT1 and the direct, or indirect, regulation of monocyte/macrophage lineage-specific genes. The second pathway appears to be responsible for the regulation of genes involved in the molecular control of cell-cycle arrest and induction of cell death. The combined cellular responses elicited by both of these pathways—differentiation, growth suppression, and apoptosis—therefore fulfil the complete program of terminal macrophage differentiation induced within M1 cells by LIF (Fig 8).
A schematic representation of events in the M1 cell nucleus which stem from the LIF receptor complex, highlighting the involvement of WT1 +KTS isoforms in the direct, or indirect, regulation of lineage-specific genes, and the suggestion of a separate LIF-induced pathway of programmed cell death. The role of WT1 −KTS isoforms in this pathway, and the potential for interactions between ±KTS isoforms of WT1, is unclear.
A schematic representation of events in the M1 cell nucleus which stem from the LIF receptor complex, highlighting the involvement of WT1 +KTS isoforms in the direct, or indirect, regulation of lineage-specific genes, and the suggestion of a separate LIF-induced pathway of programmed cell death. The role of WT1 −KTS isoforms in this pathway, and the potential for interactions between ±KTS isoforms of WT1, is unclear.
However, the data contained in this report indicate that WT1 may play a role in both pathways. The observation that endogenous WT1 −KTS isoforms are also upregulated during LIF-induced M1 cell differentiation (Fig 1), combined with their potential to regulate genes involved in both cell survival (repressing bcl-2 and M-CSF expression) and cell death (activating p21/WAF1 expression),14,12,46 suggests that these isoforms may mediate the progression toward growth suppression and cell death in M1.WT1 +KTS cells (Fig 8). The inability to establish cell lines that stably express high levels of −KTS isoforms, as described in this report for M1 cells but observed in additional cell lines by other investigators,47-49 suggests that these isoforms exert potent growth suppressive effects. Recent work by Murata et al,50 using an IPTG-inducible expression system in which expression of the WT1.3 (+/−) transcript induces cell-cycle arrest and apoptotic cell death in M1 cells, also supports this concept. Therefore, the apparent dissociation of the differentiation and growth suppression pathways in M1.WT1 +KTS cells may at least in part be due to the requirement for both ±KTS isoforms to act cooperatively to induce the complete program of M1 cell differentiation—a requirement that is only fulfilled in +KTS cells upon upregulation of endogenous −KTS isoforms of WT1 by exposure to LIF.
This investigation has demonstrated a number of key observations: (1) expression of WT1 is upregulated during LIF-induced M1 cell macrophage differentiation; (2) +KTS isoforms of WT1 have the potential to direct lineage-specific gene expression and induce monocytic differentiation in M1 cells; (3) exposure of M1.WT1 +KTS cells to LIF induces rapid growth suppression and cell death, possibly through the upregulation of endogenous −KTS WT1 isoforms; and (4) ±KTS isoforms of WT1 have distinct roles in mediating differential effects within M1 cells during induction of macrophage differentiation by LIF. The role of WT1 expression in normal HSC and HPC populations within the bone marrow,27 and how disruption of its function may lead to the onset of leukemia, is not yet understood. The demonstration of distinct biological actions of ±KTS isoforms in M1 cells, namely induction of either differentiation or cell death, may identify new approaches in the understanding of how WT1 may contribute leukemogenesis.
The abolition of WT1's transregulatory properties through mutation and truncation of the ZF DNA-binding domain has the capacity to severely disrupt normal hematopoiesis.33 The potential for ±KTS isoforms of WT1 to induce cellular differentiation coupled with growth suppression would be lost, leading to the uncontrolled proliferation and persistence of leukemic blasts, and may explain why these leukemias behave in a more aggressive fashion.33 Overexpression ofWT1 in HSCs may be another mechanism by which these cells become leukemic,36 although it has yet to be determined whether certain isoforms of WT1 are preferentially affected.WT1 splice form expression, at least at an mRNA level, appears highly conserved throughout a number of normal tissues studied5; therefore, an imbalance in the expression of WT1 isoforms in these cells could conceivably have important implications for normal development. The ability of WT1 to self-associate,51,52 combined with the observation that +KTS WT1 isoforms are able to modulate the subcellular localization and activity of −KTS isoforms (despite both isoforms localizing to distinct regions within the nucleus),19 20 highlights this as an area for further investigation. The use of cell lines, such as M1, which can be induced for single-lineage differentiation and programmed cell death may provide useful model systems with which to dissect the function of individual WT1 isoforms in the molecular control of hematopoiesis.
ACKNOWLEDGMENT
The authors thank Dr Jerry Pelletier who provided the murineWT1 cDNA splice forms; Dr Suzanne Cory for providing the retroviral expression vector pHEDMo; Drs Elizabeth Algar, Melissa Little, and Doug Hilton for helpful discussion; and Shan Li Liu for expert technical assistance.
Submitted September 18, 1997; accepted November 10, 1997.
Supported by the Leukaemia Foundation of Queensland, the Queensland Cancer Fund, and the University of Queensland, Brisbane, Australia. S.I.S. was a Queensland Cancer Fund John Earnshaw Scholar. D.W. was a post-doctoral fellow of the University of Queensland.
Address reprint requests to Shirley I. Smith, Queensland Institute of Medical Research, Post Office, Royal Brisbane Hospital, Herston Rd, Herston, Queensland, 4029, Australia.
The publication costs of this article were defrayed in part by page charge payment. This article must therefore be hereby marked “advertisement” in accordance with 18 U.S.C. section 1734 solely to indicate this fact.
REFERENCES
Author notes
Deceased.

