Abstract
Our group recently cloned the cDNA-encoding bomapin, a member of the serine protease inhibitor (serpin) superfamily, from a human bone marrow cDNA library (J Biol Chem 270:2675, 1995). To understand its expression within the hematopoietic compartment, RNA extracted from bone marrow or peripheral blood from normal donors and patients with leukemia was reverse transcribed and analyzed by polymerase chain reaction (PCR). Bomapin PCR products were readily detected in normal bone marrow, which was designated as a medium mRNA level. In peripheral blood, bomapin expression was low or undetectable in normal donors (n = 6) and patients with chronic lymphocytic leukemia (n = 6). Blood from patients with chronic myeloid leukemia (n = 6), chronic myelomonocytic leukemia (n = 6), acute myeloid leukemia (n = 5), and acute lymphocytic leukemia (n = 5) exhibited low to medium levels of bomapin expression. Furthermore, a high level of bomapin expression was detected in one individual with acute monocytic leukemia. These data suggest that bomapin expression may be elevated in hematopoietic cells of monocytic lineage. Therefore, we analyzed the expression of bomapin within cell lines that exhibited characteristics of the monocytic lineage. Bomapin PCR products were detected in the monocytic THP-1 and AML-193 cell lines but not in CRL 7607, CRL 7541, KG-1, or K562 cells. Induction of bomapin transcripts was not detected in the latter series of cell lines following a 24-hour treatment with phorbol myristate acetate (PMA, 10−8mol/L) or tumor necrosis factor-α (TNF-α, 30 U/mL), whereas treatment of THP-1 or AML-193 cells with these agents reduced the intensity of the bomapin PCR products. Northern blotting confirmed these results and showed that the expression of bomapin in THP-1 cells was downregulated over a 4-day period by PMA and, to a lesser extent, TNF-α. Immunoblotting was used to show the presence of a 40-kD protein in THP-1 cytosol preparations. Bomapin antigen levels were correspondingly reduced after treatment with PMA. Because PMA and TNF-α induce monocytic differentiation in THP-1 and AML-193 cells, these data increase the possibility that bomapin may play a role in the regulation of protease activities specifically in early stages of cellular differentiation.
SERINE PROTEINASE inhibitors (serpins) are a large superfamily of homologous proteins that resemble α1-proteinase inhibitor in overall structure and form stoichiometric 1:1 inhibitory complexes with target proteases that are typically stable to treatment with denaturants (eg, sodium dodecyl sulfate; SDS).1,2 Serpins play crucial roles in the neutralization of extracellular serine protease activities that are involved in a wide variety of vital processes including blood coagulation, fibrinolysis, complement activation, inflammation, and cell migration.2 Well-characterized examples are the inhibition of thrombin by antithrombin III, tissue-type plasminogen activator by plasminogen activator inhibitor-1, or elastase by α1-proteinase inhibitor.2 Within the serpin superfamily, ovalbumin represents the parent prototype of a currently emerging family of structurally related proteins (ov-serpins).3 Human members of the ov-serpin family are plasminogen activator inhibitor-2 (PAI-2),4 an elastase inhibitor isolated from monocyte-like cells,5squamous cell carcinoma antigen,6 cytoplasmic antiproteinase (CAP),7,8 and a tumor suppressor called maspin.9 In addition, two serpins related to CAP have been cloned from a placental λgtII library (ie, protease inhibitor-8 and -9),10 and recent data suggest that the latter molecule is an intracellular granzyme B inhibitor that is associated with cytotoxic lymphocytes.11
During studies investigating the presence of protease inhibitors in hematopoiesis, our group used a polymerase chain reaction (PCR)-based homology cloning strategy to identify a novel member of the ovalbumin family of serpins, which exhibited a high amino acid homology (48%) with PAI-2, CAP, and human leukocyte elastase inhibitor.12The isolated cDNA contains a single large open reading frame that encodes a 397-amino acid protein.12 Northern blotting analysis with this cDNA showed a single 2.3-kb bomapin transcript that was expressed in human bone marrow cells but was undetectable in all other analyzed human tissues, and this molecule was designated bone marrow-associated serpin (bomapin). Support for a role of this molecule in the inactivation of proteases initially was derived by the formation of SDS-stable complexes between either thrombin or trypsin and35S-methionine–labeled bomapin produced by an in vitro transcription/translation system.12 In this study, we extend our initial observations by analyzing transcription patterns for bomapin in bone marrow and peripheral blood of normal volunteers and patients with various forms of leukemia. Our ability to detect bomapin transcripts at elevated levels in patients with certain types of myeloid leukemia led us to expand our analysis to include a series of cell lines that exhibited defined characteristics of the monocytic lineage. Data are presented indicating that bomapin is constitutively expressed in THP-1 and AML-193 cells, and that treatment with agents that induce monocytic differentiation (eg, phorbol ester) cause a downregulation of bomapin mRNA and antigen, thus raising the possibility that bomapin plays a role in the regulation of protease activities specifically in early stages of cellular differentiation.
MATERIALS AND METHODS
Bone marrow and blood samples.
Normal donors and patients were from Virchow Klinikum, Berlin, Germany, and diagnosis was made according to standard clinical and laboratory criteria.13 Bone marrow samples (3 mL, 20 U heparin/mL) from 6 normal bone marrow donors before allogeneic bone marrow transplantation and 7 patients with acute myeloid leukemia (AML; median blast count 96%, range, 80% to 100%) were aspirated after informed consent. Peripheral blood (10 to 20 mL, 20 U heparin/mL) was drawn from 6 normal donors and 29 patients with leukemia. In AML and acute lymphocytic leukemia (ALL), the median percentage of blast cells was 89% (range, 50% to 100%). In chronic lymphocytic leukemia (CLL), chronic myeloid leukemia (CML), and chronic myelomonocytic leukemia (CMML), the median leukocyte count was 87 × 109/L (range, 43 to 179 × 109/L). To isolate leukocytes for RNA extraction, 10 mL heparinized blood were mixed with 2 mL of 5% dextran in 0.9% NaCl solution. After sedimentation of the dextran-loaded red blood cells (23°C, 40 minutes), the leukocyte-containing supernatant was aspirated, and leukocytes were pelleted (200g, 10 minutes). To lyse remaining erythrocytes, the pellet was resuspended in 10 mL of lysis buffer (150 mmol/L NH4Cl, 10 mmol/L KHCO3, 0.1 mmol/L EDTA) and incubated for 5 minutes (23°C). The leukocytes were pelleted again (200g, 10 minutes) followed by one washing step in 10 mL phosphate-buffered saline (PBS). Bone marrow was directly diluted 1:10 in lysis buffer (23°C, 5 minutes) and the leukocytes were isolated and washed as described above.
Cell culture and treatment.
Two mixed cell populations derived from human bone marrow were obtained from the American Type Culture Collection (Rockville, MD): CRL7607 was derived from the bone marrow of a normal donor and proliferated primarily as attached cells exhibiting a fibroblastic appearance, whereas CRL 7541 was derived from an abnormal bone marrow sample and exhibited a mixed morphology composed of loosely-attached, fibroblastic, and macrophage-like cells. Four defined cell lines that proliferated in suspension were obtained from the American Type Culture Collection: (1) K562 cells, which were derived from the blast cells of a 53-year-old patient with CML and have been classified as a human erythroleukemia line; (2) KG-1 cells, which were derived from the bone marrow of a 59-year-old male with erythroleukemia that evolved into undifferentiated acute myelogenous leukemia; (3) THP-1 cells, which were derived from the peripheral blood of a 1-year-old male with acute monocytic leukemia; and (4) AML-193 cells, which were established from the blast cells of a 13-year-old female with childhood leukemia classified as M5 acute monocytic leukemia. CRL7607 and 7541 cells were cultured in 10% fetal bovine serum (FBS)-containing Dulbecco's modified Eagle's medium, K562 cells were cultured in 10% FBS-containing RPMI, KG-1 cells were cultured in 20% FBS-containing Iscove's modified Dulbecco's medium (IMDM), THP-1 cells were cultured in 10% FBS-containing RPMI 1640 supplemented with 0.00004% α-mercaptoethanol, and AML-193 cells were cultured in 10% FBS-containing IMDM supplemented with 5 μg/mL transferrin (Sigma, St Louis, MO), 5 μg/mL insulin (Sigma), and 5 ng/mL granulocyte-macrophage colony-stimulating factor (Genzyme, Boston, MA).
RNA isolation, cDNA synthesis, and PCR.
RNA was extracted and reverse transcribed using previously described protocols.14 PCR was performed by modifying the previously described protocols as follows: cycle 1, 94°C for 5 minutes, 55°C for 1 minute, and 72°C for 1 minute; cycles 2 to 4, 94°C for 1 minute, 55°C for 1 minute, and 72°C for 1 minute; cycles 5 to 31 for bomapin, CAP, and PAI-2 and cycles 5 to 23 for two control proteins (ie, β-actin and glyceraldehyde 3′-phosphate dehydrogenase [GAPDH]), 94°C for 1 minute, 55°C for 1 minute, and 72°C for 2 minutes; cycle 32 for the three ov-serpins and cycle 24 for the two control proteins, 94°C for 1 minute, 55°C for 1 minute, and 72°C for 10 minutes. PCR products (10 μL) were subjected to electrophoresis on agarose gels and visualized by ethidium bromide staining. Based on the intensities of the bomapin bands, expression levels were classified as high, medium, low, or undetectable (Results and Fig 1). PCR conditions were calibrated in preliminary experiments, in which a linear relationship between cycle number and band intensity was observed using 32 cycles for the amplification of bomapin, CAP, and PAI-2 transcripts and 24 cycles for transcripts encoding either β-actin or GAPDH. Two sets of primers were synthesized for bomapin based on its published sequence12: primer set B1, CAGTGGGCCTTCAACTCTAC (sense, base position 707 to 726) and AATTCAATGGATGGGACTCT (antisense, base position 1,109 to 1,090); primer set B2, ATGGGACTCTCTAGCAACATCAATCAACCAG (sense, base position 1 to 30) and TTAGGGGGAGCATAATCTTCCAT (antisense, base position 1,195 to 1,173). Primers for two other serpins (ie, CAP and PAI-2) and control proteins (ie, β-actin and GAPDH) were based on published nucleotide sequences: (1) primer set C1 for CAP, TGGTTCTGGTGAATGCTGTC (sense, base position 482 to 501) and AGGTTGCGCAGGACACTCTC (antisense, base position 866 to 847)7; (2) primer set C2 for CAP, TGCTTAGGGTCGCCAACAGG (sense, base position 260 to 279) and AGGTTGCGCAGGACACTCTC (antisense, base position 866 to 849)7; (3) primer set for PAI-2, ATGCAGCAGATCCAGAAG (sense, base position 244 to 261) and TCTCCCTGTCATAACACC (antisense, base position 1,140 to 1,123)4; (4) primer set for β-actin, CCTTCCTGGGCATGGAGTCCT (sense, base position 835 to 855) and GCACGAAGGCTCATCATTCA (antisense, base position 1,630 to 1,611)15; and (5) primer set for GAPDH, GGTGAAGGTCGGAGTCAACG (sense, base position 42 to 61) and ACACGGAAGGCCATGCCAGT (antisense, base position 737 to 718).16 Controls in the PCR included (1) pBluescript vectors containing the cDNA encoding either bomapin, PAI-2, or CAP (10 ng plasmid/reaction, respectively) to show specificity of the primer pairs, (2) the vector pGAD-9 containing normal human bone marrow cDNA library (Clontech, San Diego, CA) as a positive control (10 ng/reaction),12 (3) no cDNA added to the PCR as a negative control, and (4) a nonreverse transcribed RNA sample as a control for amplification of genomic DNA.
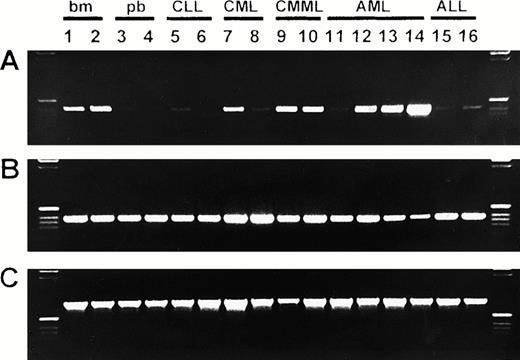
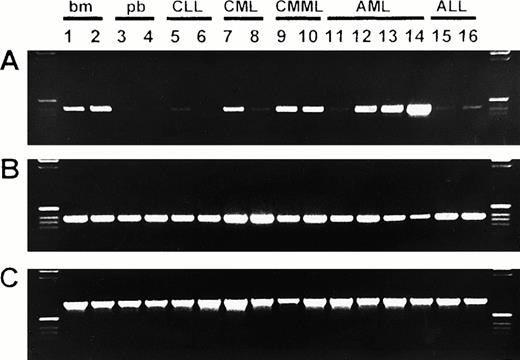
Expression of bomapin, CAP, and β-actin in normal hematopoiesis and in hematological malignancies. RNA was isolated from normal bone marrow (bm; lanes 1-2) and from peripheral blood of normal donors (pb; lanes 3-4) and patients with CLL (lanes 5-6), CML (lanes 7-8), CMML (lanes 9-10), AML (lanes 11-14), and ALL (lanes 15-16). After reverse transcription, bomapin (A) and CAP (B) cDNAs were amplified by PCR for 32 cycles using primer pairs B1 (amplification product, 403 base pairs) and C1 (amplification product, 385 base pairs), respectively. The β-actin (C) cDNA was amplified for 24 cycles (amplification product, 796 base pairs). PCR products (5 μL) were visualized by electrophoresis in a 1.5% agarose gel followed by staining with ethidium bromide. A 1-kb DNA ladder was loaded in the left and right lanes. Bomapin expression was scored to be low or absent in lanes 3-6, 8, 11, and 15-16; medium in lanes 1-2, 7, 9-10, and 12-13; and high in lane 14.
Expression of bomapin, CAP, and β-actin in normal hematopoiesis and in hematological malignancies. RNA was isolated from normal bone marrow (bm; lanes 1-2) and from peripheral blood of normal donors (pb; lanes 3-4) and patients with CLL (lanes 5-6), CML (lanes 7-8), CMML (lanes 9-10), AML (lanes 11-14), and ALL (lanes 15-16). After reverse transcription, bomapin (A) and CAP (B) cDNAs were amplified by PCR for 32 cycles using primer pairs B1 (amplification product, 403 base pairs) and C1 (amplification product, 385 base pairs), respectively. The β-actin (C) cDNA was amplified for 24 cycles (amplification product, 796 base pairs). PCR products (5 μL) were visualized by electrophoresis in a 1.5% agarose gel followed by staining with ethidium bromide. A 1-kb DNA ladder was loaded in the left and right lanes. Bomapin expression was scored to be low or absent in lanes 3-6, 8, 11, and 15-16; medium in lanes 1-2, 7, 9-10, and 12-13; and high in lane 14.
Northern blotting.
Denaturing electrophoresis of RNA in formaldehyde-containing 1% agarose gels and transferred to Hybond-N nylon membranes (Amersham Corp, Arlington Heights, IL) was performed as described previously.12,17 The cDNA sequence encoding bomapin was amplified by PCR using primer set B2 in the presence of [32P]dCTP and hybridized to the nylon membranes using conditions previously described.12,17 A digoxigenin-labeled human GAPDH probe was prepared by PCR using the aforementioned GAPDH primer set to amplify a 695-bp region of the GAPDH cDNA in the presence of PCR digoxigenin labeling mixture (Boehringer Mannheim, Mannheim, Germany) and used this probe to confirm equal loading as described.18
Purification of bomapin, antibodies to bomapin, and immunoprecipitation/immunoblotting protocols.
The expression, purification, and characterization of bomapin will be described in detail elsewhere (M. Riewald and R.R. Schleef, manuscript in preparation). For the preparation of recombinant bomapin, the coding region of bomapin was excised from pBluescript-bomapin12 using BamHI and Xho I and ligated in frame to the cDNA-encoding glutathione S-transferase (GST) in the bacterial expression vector pGEX-4T-1 (Pharmacia Biotech Inc, Piscataway, NJ). PGEX-4T-1 bomapin-transformedEscherichia coli cells were induced with 100 μmol/L isopropylthio-β-D-galactoside, sonicated, and centrifuged and the supernatant was mixed with glutathione-Sepharose 4B as described by the manufacturer. The beads were washed with (PBS) containing 1% Triton X-100, and the GST-bomapin was eluted with PBS supplemented with 20 mmol/L glutathione and 0.1% Triton X-100. The eluted material was analyzed by sodium dodecyl sulfate-polyacrylamide gel electrophoresis (SDS-PAGE) followed by silver staining.19,20 Fractions containing a single protein band at 62 kD were pooled and used to raise antibodies in New Zealand white rabbits according to standard protocols.20 Native bomapin was isolated from THP-1 cells using immunoblotting with antibodies to bomapin to optimize a purification protocol. Briefly, 109 cells were homogenized and subjected to ultracentrifugation (100,000g for 1 hour), and the cytosol was chromatographed in a heparin-Sepharose (1 × 15 cm) column in 20 mmol/L HEPES-HCl, pH 7.4. The nonabsorbed material was applied to a Diethylaminoethyl-Sephacryl (Pharmacia) column (1 × 15 cm) in 20 mmol/L HEPES-HCl, pH 7.4. The column was washed and eluted with a linear gradient of NaCl (0 to 0.15 mol/L NaCl in 20 mmol/L HEPES-HCl). Fractions containing bomapin were pooled and applied to a hydroxylapatite column in 20 mmol/L HEPES-HCl, pH 7.4. The column was eluted by increasing the phosphate concentration (300 mL linear gradient, 0 to 0.15 mol/L phosphate buffer, pH 7). Fractions from containing bomapin were subjected to preparative SDS-PAGE as a means to isolate the Mr 40 kD form of bomapin. Purified bomapin was coupled with cyanogen bromide-Sepharose (Pharmacia) and used to affinity purify antibodies to bomapin using previously described protocols.20 Antibodies were biotinylated using Ezlink Sulfo-NHS-LC-Biotin (Pierce) as described by the manufacturer. Immunoprecipitation21 and immunoblotting20 22 procedures were performed as described previously.
RESULTS
Expression of bomapin mRNA in normal and malignant hematopoietic cells.
To understand the expression of bomapin within hematopoietic tissues, we analyzed transcription patterns in bone marrow or peripheral blood from normal donors and patients with leukemia (Fig 1, Table 1). Using a calibrated PCR protocol, bomapin transcripts were readily detected in normal bone marrow, which was designated as a medium expression level (Fig 1A, lanes 1 to 2). In peripheral blood, bomapin expression was low or undetectable in normal donors and patients with CLL (Fig 1A, lanes 3 to 6, Table 1). Blood from patients with CML, CMML, AML, and ALL exhibited either low or medium levels of bomapin expression (Fig 1A, lanes 7 to 13 and 15 to 16, Table 1). However, the bomapin PCR product level was high in one individual with acute monocytic leukemia (AML M5b; Fig 1A, lane 14). A trend toward elevated bomapin expression was also detected in patients with CMML in comparison with those individuals with CML (Table 1). To substantiate our observations on bomapin, we used a second set of primers for this molecule, which resulted in similar observations, and representative data obtained using this set of primers will be provided in the next section. These data suggest that bomapin expression may be elevated in hematopoietic cells of monocytic lineage.
In comparison to the elevated expression of bomapin in individuals with specific types of leukemias, the expression of another ov-serpin (ie, CAP) was detected in samples of normal bone marrow and peripheral blood, as well as in all individuals analyzed in this study. However, one individual with acute monocytic leukemia (Fig 1A, lane 14), who exhibited elevated expression of bomapin, appeared to contain reduced levels of CAP expression (Fig 1B, lane 14). The PCR products for β-actin are shown in Fig 1C as a control.
Detection of bomapin in cell lines derived from patients with various types of leukemia.
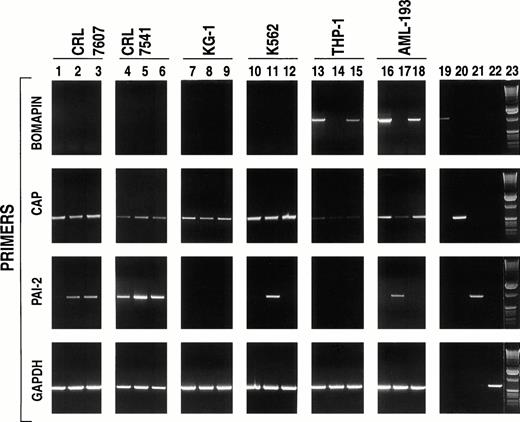
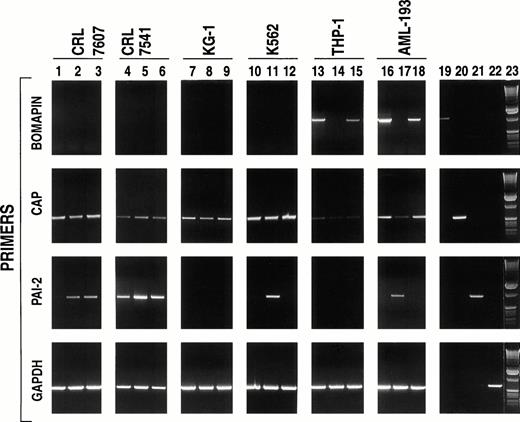
Because studies on the role of bomapin would be facilitated by the identification of bomapin-producing cell lines that could be readily cultured on a large scale in vitro, we investigated a series of cells that were derived from bone marrow or peripheral blood for the presence of bomapin transcripts by PCR. Initial experiments investigated two mixed cell populations prepared by the Naval Biosciences Laboratory (Oakland, CA): one derived from normal bone marrow (CRL 7607; Fig 2, lanes 1 to 3) and the other that was derived from an abnormal bone marrow sample (CRL 7541; Fig 2, lanes 4 to 6). Total RNA was extracted and analyzed from not only nonstimulated cells but also cells incubated for 24 hours in the presence of phorbol myristate acetate (PMA) or tumor necrosis factor-α (TNF-α), two known inducers of cellular differentiation that have also been observed to increase the production of the serpins PAI-1 and PAI-2. Although transcripts for CAP could be detected in both cell lines (Fig 2, second row, lanes 1 to 6) and the intensity of the PCR products for PAI-2 increased using RNA extracted from PMA (ie, CRL 7607 and 7541; Fig 2, third row, lanes 2 and 5, respectively) or TNF-α (ie, CRL 7607, lane 3) treated cells, bomapin transcripts were not detected in these two cell populations either under nonstimulated or stimulated conditions (Fig 2, first row, lanes 1 to 6). Our observation that bomapin expression was elevated in certain patients with leukemia (Fig 1, Table 1) subsequently led us to analyze the following set of cell lines: KG-1, K562, THP-1, and AML-193. Figure 2(first row) indicates that bomapin transcripts were present in two cell lines derived from patients with acute monocytic leukemia under normal tissue culture conditions (ie, control THP-1 cells, lane 13; AML-193 cells, lane 16), but not in KG-1 (lanes 7 to 9) or K562 (lanes 10 to 12) cells. Both PMA and TNF appeared to cause a decrease of the intensity of the bomapin PCR product band obtained using RNA extracted from agonist-treated THP-1 (Fig 2, first row, lanes 14 and 15 in comparison with lane 13) and AML-193 (Fig 2, first row, lanes 17 and 18 in comparison with lane 16) cells.
PCR analysis of cell lines derived from bone marrow or peripheral blood of patients with various types of leukemia. The indicated cell lines (CRL 7607, lanes 1-3; CRL 7541, lanes 4-6; KG-1, lanes 7-9; K562, lanes 10-12; THP-1, lanes 13-15; and AML-193, lanes 16-17) were incubated in serum-containing media (106cells/mL, 25 mL/162 cm2 flask) in the absence (lanes 1, 4, 7, 10, 13, and 16) or presence of either PMA (10-8 mol/L, lanes 2, 5, 8, 11, 14, and 17) or TNF-α (30 U/mL; lanes 3, 6, 9, 12, 15, and 18). After 24 hours, the cells were washed by centrifugation and total RNA was isolated, reverse transcribed, and subjected to PCR amplification using primers specific to bomapin (first row, primer pair B2, amplification product: 1,195 base pairs), CAP (second row, primer pair C2, amplification product: 607 base pairs), PAI-2 (third row, amplification product: 897 base pairs), and GAPDH (fourth row, amplification product: 695 base pairs). The PCR products were subjected to electrophoresis in a 1% agarose gel and stained with ethidium bromide. Lanes 19-22 show the PCR products obtained using the aforementioned primers to amplify the vectors containing the cDNAs encoding bomapin (lane 19), CAP (lane 20), PAI-2 (lane 21), or GAPDH (lane 22). Lane 23 contains a 1-kb DNA ladder.
PCR analysis of cell lines derived from bone marrow or peripheral blood of patients with various types of leukemia. The indicated cell lines (CRL 7607, lanes 1-3; CRL 7541, lanes 4-6; KG-1, lanes 7-9; K562, lanes 10-12; THP-1, lanes 13-15; and AML-193, lanes 16-17) were incubated in serum-containing media (106cells/mL, 25 mL/162 cm2 flask) in the absence (lanes 1, 4, 7, 10, 13, and 16) or presence of either PMA (10-8 mol/L, lanes 2, 5, 8, 11, 14, and 17) or TNF-α (30 U/mL; lanes 3, 6, 9, 12, 15, and 18). After 24 hours, the cells were washed by centrifugation and total RNA was isolated, reverse transcribed, and subjected to PCR amplification using primers specific to bomapin (first row, primer pair B2, amplification product: 1,195 base pairs), CAP (second row, primer pair C2, amplification product: 607 base pairs), PAI-2 (third row, amplification product: 897 base pairs), and GAPDH (fourth row, amplification product: 695 base pairs). The PCR products were subjected to electrophoresis in a 1% agarose gel and stained with ethidium bromide. Lanes 19-22 show the PCR products obtained using the aforementioned primers to amplify the vectors containing the cDNAs encoding bomapin (lane 19), CAP (lane 20), PAI-2 (lane 21), or GAPDH (lane 22). Lane 23 contains a 1-kb DNA ladder.
The levels of CAP and PAI-2 expression were also analyzed in these four leukemic cell lines for comparative purposes. Figure 2B and C indicate that the expression of these two serpins and their levels in response to PMA or TNF-α appear to depend on the cell line. For example, PCR products for CAP were readily detected using mRNA from the KG-1 or K562 cell line (Fig 2B, lanes 7 and 10, respectively) and the mRNA levels for this protein were not affected by treatment of the cells with either agonist (Fig 2B, lanes 8, 9, 11, and 12). In comparison, CAP transcript levels appeared to be reduced by treating the AML-193 cell line with PMA (Fig 2B, lane 17 v lane 16), whereas the PCR products for CAP were barely detected using mRNA from either control or stimulated THP-1 cells (lanes 13 to 15). PCR products for PAI-2 (Fig2C) were only detected in the K562 and AML-193 cell line after stimulation with PMA (lanes 11 and 17, respectively), but not in mRNA samples prepared from KG-1 or THP-1 cells (lanes 7 to 9 and 13 to 15, respectively) under control or stimulated conditions. PCR products for a control protein (ie, GAPDH) are shown in Fig 2D.
Bomapin expression is downregulated on differentiation of THP-1 and AML-193 cells.
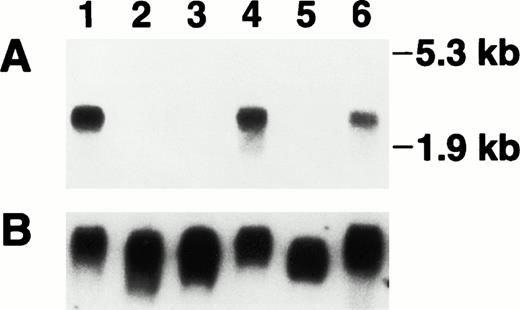
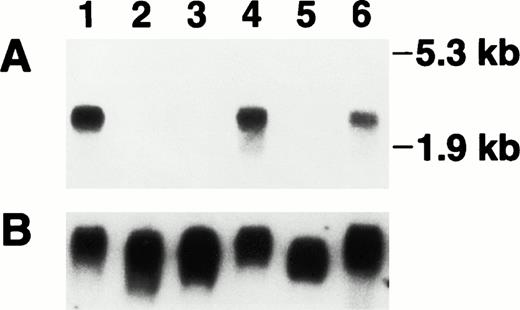
To confirm that PMA and TNF-α are able to decrease the steady-state levels for bomapin mRNA, we selected THP-1 cells for further analysis. Because cellular differentiation of THP-1 cells elicited by PMA treatment occurs over several days, we expanded our analysis by stimulating THP-1 cells not only for 24 hours but also over a 96-hour period with these agonists. Total RNA was extracted from these cells and the samples were subjected to Northern blotting using the cDNA for bomapin-labeled with 32P. A single transcript was detected in the RNA extracted from control THP-1 cells that were harvested either 24 or 96 hours after their transfer into fresh media (Fig 3, lanes 1 and 4). Although nonstimulated THP-1 cells proliferate in suspension, their treatment with 10-8 mol/L PMA mediates the attachment of these cells to the culture dish (ie, >95% within 24 hours) resulting in cessation of cell proliferation. In comparison, only a portion of the TNF-α–treated cells adhered to the plastic (ie, 15% after 24 hours decreasing to 10% at the 96-hour time point), which was accompanied by a 23% decrease in cell growth over the 96-hour period relative to the growth of control THP-1 cells (data not shown). Treatment of THP-1 cells with PMA or TNF-α (lanes 2 and 3, respectively) for 24 hours reduced bomapin mRNA levels below the sensitivity of this assay. The bomapin mRNA levels in the cells treated for 96 hours with PMA remained below the level of sensitivity of Northern blotting (lane 5), whereas mRNA for this inhibitor could be detected again by Northern blotting in these cells incubated for 96 hours with TNF-α (lane 6).
Detection of bomapin transcript in THP-1 cells. THP-1 cells were incubated in the absence (lanes 1 and 4) or presence of PMA (10-8 mol/L, lanes 2 and 5) or TNF-α (30 U/mL, lanes 3 and 6). RNA was isolated after either 24 hours (lanes 1-3) or 96 hours (lanes 4-6) of treatment and the blot was hybridized (10 μg/lane) to a 32P-labeled bomapin cDNA probe and exposed for 1 day to radiograph film (A). The blot was rehybridized to a digoxigenin-labeled GAPDH cDNA probe (25 mg/mL) and the bound probe detected by incubation with alkaline phosphatase-labeled antidigoxigenin followed by CDP-Star (Boehringer Mannheim), and exposure to radiograph film for 10 minutes (B).
Detection of bomapin transcript in THP-1 cells. THP-1 cells were incubated in the absence (lanes 1 and 4) or presence of PMA (10-8 mol/L, lanes 2 and 5) or TNF-α (30 U/mL, lanes 3 and 6). RNA was isolated after either 24 hours (lanes 1-3) or 96 hours (lanes 4-6) of treatment and the blot was hybridized (10 μg/lane) to a 32P-labeled bomapin cDNA probe and exposed for 1 day to radiograph film (A). The blot was rehybridized to a digoxigenin-labeled GAPDH cDNA probe (25 mg/mL) and the bound probe detected by incubation with alkaline phosphatase-labeled antidigoxigenin followed by CDP-Star (Boehringer Mannheim), and exposure to radiograph film for 10 minutes (B).
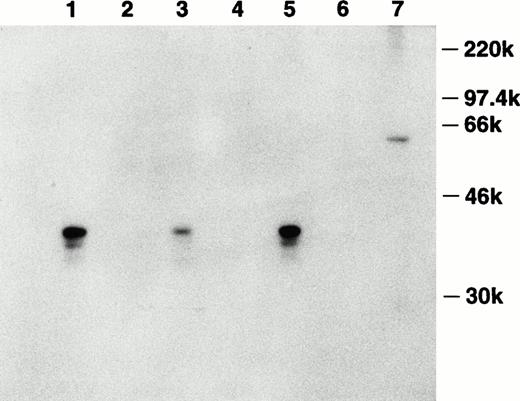
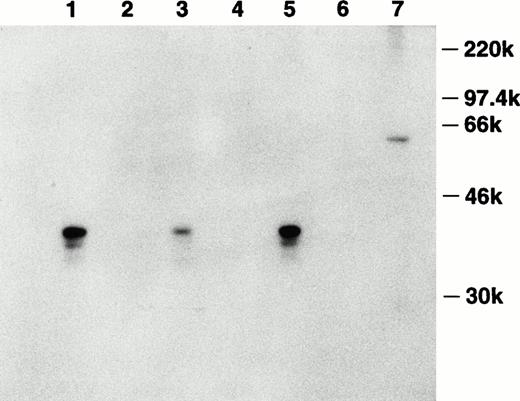
To investigate the production of this inhibitor on the protein level, the cDNA encoding bomapin was subcloned in-frame after the sequence coding for GST in pGEX-4T-1. The GST-bomapin fusion construct was purified from bacteria transformed with this plasmid and the purified construct was used to immunize a rabbit. Antiserum obtained from this rabbit was affinity purified using Sepharose conjugated to purified bomapin, and this reagent was subsequently used to analyze the presence of bomapin antigen in control and agonist-treated THP-1 cells. Figure 4 shows a representative experiment in which 3-day control or treated THP-1 cytosol samples were immunoprecipitated with either Sepharose-antibomapin or Sepharose-normal rabbit IgG, and the immunoprecipitates analyzed immunoblotting using biotin-labeled affinity purified antibomapin. A major band at Mr 40 kD was detected in the control THP-1 samples immunoprecipitated with the Sepharose-antibomapin (lane 1), which was markedly decreased in intensity in cytosol prepared from cells incubated for 3 days with PMA (lane 3).
Detection of bomapin antigen in control and PMA- or TNF-α–treated THP-1 cells. THP-1 cells (106 cells/mL, 25 mL/flask, 162 cm2/flask) were incubated in serum-containing media in the absence (lanes 1 and 2) or presence of either PMA (10−8 mol/L; lanes 3 and 4) or TNF-α (30 U/mL; lanes 5 and 6) as described above. After 72 hours, the cells were washed twice, homogenized, and centrifuged, and the cytosol preparations (1 mg) were incubated with either Sepharose-antibomapin (lanes 1, 3, and 5) or Sepharose-normal rabbit IgG (lanes 2, 4, and 6). The beads were washed and the material eluting with SDS-sample buffer was analyzed by immunoblotting using biotin-labeled affinity purified antibomapin, streptavidin-peroxidase, and the enhanced chemiluminescence detection system. Lane 7 contained 300 ng of GST-bomapin.
Detection of bomapin antigen in control and PMA- or TNF-α–treated THP-1 cells. THP-1 cells (106 cells/mL, 25 mL/flask, 162 cm2/flask) were incubated in serum-containing media in the absence (lanes 1 and 2) or presence of either PMA (10−8 mol/L; lanes 3 and 4) or TNF-α (30 U/mL; lanes 5 and 6) as described above. After 72 hours, the cells were washed twice, homogenized, and centrifuged, and the cytosol preparations (1 mg) were incubated with either Sepharose-antibomapin (lanes 1, 3, and 5) or Sepharose-normal rabbit IgG (lanes 2, 4, and 6). The beads were washed and the material eluting with SDS-sample buffer was analyzed by immunoblotting using biotin-labeled affinity purified antibomapin, streptavidin-peroxidase, and the enhanced chemiluminescence detection system. Lane 7 contained 300 ng of GST-bomapin.
DISCUSSION
This report provides data indicating that the expression of bomapin mRNA is significantly higher in the bone marrow than in peripheral blood from normal individuals (Fig 1, Table 1). This observation is consistent with the detection of bomapin transcript specifically in the bone marrow and its absence in all other analyzed human tissues, including samples from the peripheral blood cell-rich spleen or placenta that were analyzed in our initial survey of human tissues by Northern blotting.12 In addition, this observation supports the concept that bomapin is predominantly expressed in cells that, under normal conditions, are either not released from the bone marrow (eg, stromal cells) or that are released into the blood only after differentiation (eg, hematopoietic progenitor cells). Relatively high levels of bomapin transcript in peripheral blood leukocytes from patients with acute monoblastic leukemia (AML M5) and CMML (Fig 1, Table 1) suggest that bomapin may be expressed preferentially in hematopoietic progenitor cells of monocytic lineage. This hypothesis is supported by the detection of bomapin mRNA in two tissue culture cell lines of monocytic differentiation (ie, THP-1 and AML-193 cells). Bomapin mRNA levels are downregulated on differentiation of THP-1 and AML-193 cells by induction with PMA or TNF-α. Preliminary experiments suggest that HL-60 and U937 cells also express bomapin, which can be downregulated by treatment with PMA (R.R. Schleef, personal observations). Taken together, our data raise the possibility that bomapin expression increases during certain early stages of monocytic commitment, which is followed by a decrease of expression levels during later stages of the differentiation to monocytes/macrophages.
High levels of two other ov-serpins have been shown in peripheral blood monocytes and tissue culture cell lines of monocytic differentiation: (1) the expression of PAI-2 in peripheral blood monocytes and monocyte-like cell lines (eg, U937) is significantly elevated after the induction of differentiation towards a macrophage phenotype with PMA or TNF-α23-25 and (2) leukocyte elastase inhibitor is expressed constitutively in U937 cells and increasingly in peripheral blood monocytes during in vitro culture, again suggesting that expression of this inhibitor by monocytes increases during the maturation process towards macrophages.26 The downregulation of bomapin expression after induction of differentiation in THP-1 and AML-193 cells suggests that these different protease inhibitors may play specific roles during distinct stages of cellular development. Another widely-expressed intracellular inhibitor (ie, CAP) was noted by Scott et al27 to be absent from THP-1 cells using Northern blotting analysis. We have also observed that CAP mRNA levels in THP-1 cells are below the sensitivity of Northern blotting (Riewald et al, unpublished observations), and our present data suggest that transcripts for CAP are present at low levels that require a PCR-based assay. Our observation that bomapin is highly expressed in the peripheral blood cells isolated from a patient with AML M5 coupled with the low levels of CAP transcripts in this individual's blood (Fig1, lane 14) would also be consistent with the production of specific inhibitory molecules to protect or neutralize proteases that might be produced during a particular stage of development. Although bomapin, CAP, and PAI-2 are all serpins with arginine in the specificity-determining P1 position of the reactive site loop that plays a role in the formation of complexes with proteases of trypsin-like specificity,4,7,8,12 alignment of their primary structure indicates that bomapin contains a 22-amino acid loop including a cluster of charged amino acids between helices C and D in its tertiary structure12 that is absent in CAP. PAI-2 is the only serpin that contains an even longer (ie, 37 amino acids) interhelical loop,4 and recent data by Jensen et al28 suggest that this region serves as a protein-binding domain that may be critical for the function of PAI-2. It is possible that the interhelical loop in bomapin may play a role in defining its interaction with a specific cellular protein that is expressed during differentiation of hematopoietic cells along the monocytic lineage. Thus, second site interactions on these three protease inhibitors may provide a rationale for their production in distinct cell types or at a particular stage of differentiation.
Supported by a grant from the National Institutes of Health (HL49563).
Address reprint requests to Raymond R. Schleef, PhD, Department of Vascular Biology (VB-1), The Scripps Research Institute, 10550 North Torrey Pines Rd, La Jolla, CA 92037.
The publication costs of this article were defrayed in part by page charge payment. This article must therefore be hereby marked “advertisement” in accordance with 18 U.S.C. section 1734 solely to indicate this fact.

