Eμ-ret mice carrying an RFP/RET fusion gene under the transcriptional control of the immunoglobulin heavy chain enhancer develop B lineage leukemias/lymphomas. We have characterized B-cell development in these mice before the onset of clinical disease to determine the steps involved in leukemogenesis. Flow cytometry reveals that the CD45R+CD43+CD24+BP-1+late pro–B-cell population is markedly expanded in the bone marrow of 3- to 5-week-old Eμ-ret mice. Compared with late pro–B cells from transgene-negative mice, Eμ-ret late pro–B cells have a limited capacity to differentiate in interleukin (IL)-7 and a higher incidence of VDJ rearrangements, but a similar cell cycle profile. In contrast, CD45R+CD43+CD24+BP-1−early pro–B cells from 3- to 5-week-old Eμ-ret mice, which also express the RFP/RET transgene, differentiate in IL-7 similarly to their normal counterparts. Furthermore, early pro–B cells from Eμ-ret and transgene-negative mice have an identical pattern of growth inhibition when exposed to interferons (IFNs)-α/β and -γ, whereas, pro–B-cell leukemia lines derived from Eμ-ret mice are markedly less sensitive to growth inhibition by these IFNs. In 13-week-old well-appearing Eμ-ret mice, late pro–B cells upregulate CYCLIN D1 expression and downregulate CASPASE-1 expression in a pattern that correlates with the emergence of B precursor cells in the peripheral blood and the loss of other B lineage subsets in the bone marrow. Taken together, these results suggest that the expression of the RFP/RET transgene initially prevents the normal elimination of late pro–B cells with nonproductive rearrangements. Secondary events that simultaneously disturb the normal transcriptional regulation of genes involved in the control of the cell cycle and apoptosis may allow for subsequent malignant transformation within the expanded late pro–B-cell population.
B PRECURSOR ACUTE lymphoblastic leukemia (ALL), the most common childhood cancer, results from the overgrowth of the marrow compartment with a clonal population of pro–B or pre–B cells.1-3 The majority of B precursor leukemias manifest somatic chromosomal abnormalities such as deletions, translocations, and alterations in ploidy. Many of the genes affected by these abnormalities have been identified and characterized as playing a role in either cell survival or proliferation.4 However, a limitation of studying the pathogenesis of B precursor ALL using patient samples is that no preleukemic stage is recognizable. Therefore, it is unclear whether a genetic abnormality precedes, follows, or occurs concurrently with transformation. Consequently, several approaches using animal models have been developed that allow investigators to observe how a transformed monoclonal population emerges from a pool of polyclonal B precursors. These approaches include the infection of murine bone marrow with retroviruses as well as the generation of mice with transgenic constructs that transform B lineage cells. For example, mice carrying a transgene (Eμ-myc) that causes overexpression of the MYC gene develop predominately B precursor leukemias/lymphomas.5 The study of Eμ-myc mice has identified alterations in the size, proliferation, and control of apoptosis within the bone marrow B precursor cell population before transformation.6 7 Most notably, these studies have validated a multistep process of leukemogenesis.
The utility of animal model systems to study the pathogenesis of B precursor ALL is aided by the understanding of normal B lineage development. Bone marrow B-cell differentiation follows an ordered pattern where the pro–B-cell stages are characterized by the rearrangement of the immunoglobulin heavy chain (IgH) loci, the pre–B-cell stage by the expression of cytoplasmic IgM heavy chain (μ) protein, and the B-cell stages by expression of surface (s) IgM and subsequent IgD protein.8,9 In both humans and mice, B lineage subsets corresponding to these discrete stages of differentiation can be identified by a specific expression pattern of cell surface antigens.10-12 These subsets have been isolated by multiparameter flow cytometry and characterized at both the molecular and cellular levels. In murine B lineage development, the late pro–B cell corresponds to the most commonly transformed B lineage cell in human B precursor ALL. Late pro–B cells are in the process of completing the rearrangement of the IgH chain loci (V to DJ joining). The successful completion of this stage will result in the production of μ protein, and the cells will undergo a proliferative burst, the most prominent of any marrow B lineage stage.10 In contrast, failure to make a productive VDJ rearrangement will lead to cell death, although the steps involved in this process largely remain unknown.13 Thus, late pro–B cells appear to be particularly vulnerable to transformation through mutations that would disrupt the control of the cell cycle and apoptosis.
The RET tyrosine kinase is expressed during the pro–B-cell stages of murine bone marrow B lineage development.14 Ret expression is subsequently downregulated at the pre–B-cell stage as a consequence of μ expression.14 Mutations in RET that result in constitutive tyrosine kinase activity are oncogenic.15,16 A fusion protein containing the amino terminal of the RFP protein, a transcriptional activator, and the membrane and tyrosine kinase domains of RET induced B lymphoid malignancies when expressed under the transcriptional control of the IgH enhancer in transgenic (Eμ-ret) mice.17 Specifically, the Eμ-ret mice developed adenopathy and hepatosplenomegaly at 2 to 5 months of age. The malignant cells were characterized as B precursors as they expressed CD45R but lacked sIgM and had clonal IgH chain rearrangements.17 We have rederived the Eμ-ret mouse to determine the abnormalities in B-cell development that occur over time and result in the transformed state. We studied well-appearing Eμ-ret mice at 3 to 5 weeks of age to characterize the early effect of the transgenic construct on B lymphopoiesis and at 13 weeks of age to identify secondary changes that could contribute to malignant outgrowth. We have identified the late pro–B-cell fraction (Fr) C as the specific B lineage differentiation stage perturbed by the transgenic construct and compared the functional characteristics of these cells with those from normal mice. In addition, we show changes in gene expression of two genes, CYCLIN D1 and CASPASE-1, involved in cell cycle control and apoptosis, respectively, that are detectable before the onset of frank leukemia.
MATERIALS AND METHODS
Mice.
A transgenic male mouse carrying a RFP/RET fusion gene under the transcriptional control of the IgH enhancer (Eμ-ret) was generated on a C57BL/6 × DBA2 background. The Eμ-ret male was crossed to BALB/c females as were subsequent male progeny. The mice reported in this study have been bred through at least two generations of BALB/c matings. The Eμ-ret construct has been previously described and used to generate a line of Eμ-ret mice.17
Cell preparation.
A single cell suspension of bone marrow (femur and tibia) was prepared by injecting ice-cold staining medium (deficient RPMI [Irvine Scientific, Santa Ana, CA] containing 10 mmol/L HEPES, 3% fetal calf serum [FCS], and 0.1% NaN3) into the bone to flush out cells, followed by gentle mixing with a 1-mL syringe. Cells were treated with 0.165 mol/L NH4Cl to eliminate erythrocytes. Approximately 100 μL of peripheral blood was diluted into 0.5 mL staining medium with 12.5 U/mL Heparin Sulfate. The suspension was layered over 1 mL Lympholyte-M (Cedarlane Laboratories, Hornby, Canada) and spun at 2,600 RPM at room temperature for 20 minutes. The lymphocyte layer (interface) was removed and washed twice with staining medium.
Cell surface staining and flow cytometry.
Bone marrow cells were stained as described previously with a four-color combination of fluorescent monoclonal antibodies: anti-CD45R(B220) (allophycocyanin-6B2), anti-CD43 (fluorescein-S7), anti–BP-1 (phycoerythrin-BP-1), anti-CD24/HSA (biotin-30F1/Texas Red [or Red-613]-avidin).10 Peripheral blood lymphocytes were stained simultaneously with anti-CD45R(B220)(phycoerythrin-6B2) and anti-IgM (fluorescein-331.12). Four-color flow cytometry analysis and sorting of bone marrow was performed using a dual laser (FACSVantage, Becton Dickinson Immunocytometry Systems, San Jose, CA) or a dual laser/dye laser flow cytometer (FACStarPLUS, Becton Dickinson) equipped with appropriate filters for four-color immunofluorescence. Reanalysis of sorted fractions consistently showed purities in excess of 95%. Samples were held on ice during sorting. Two-color flow cytometry analysis of peripheral blood and interleukin-7 (IL-7) treated pro–B cells was performed on a single laser flow cytometer (FACScan, Becton Dickinson).
Cell lines and cell culture conditions.
The 02/1 cell line was produced from a single cell clone of the Eμ-ret 02 cell line.18 The 2-19 cell line was derived from a bulk culture of the leukemic bone marrow from our Eμ-ret mouse line. These two cell lines are CD45R+CD43+ and cytoplasmic μ− and thus correspond to the pro–B cell stage of B lineage differentiation19 (and unpublished observations). In the interferon (IFN) proliferation assays, the lines were cultured for 3 days in standard medium (RPMI 1640 supplemented with 5% FCS, 2 mmol/L L-glutamine, 25 mmol/L HEPES, and 50 μmol/L 2-mercaptoethanol), and IL-7 (Genzyme, Cambridge, MA) at 100 U/mL was added at time 0 to cultures containing the 2-19 line. In the IL-7 differentiation and IFN proliferation assays, sorted pro–B cells were cultured for 4 days using standard medium supplemented with IL-7 at 100 U/mL at time 0. In the IFN proliferation assays, murine IFN-α/β (Sigma, St Louis, MO) and IFN-γ (Genzyme) were added at time 0 at the indicated concentrations.
Cell cycle analysis.
Pro–B cells were sorted directly into 80% ethanol and chilled to −20°C. The cells were pelleted and resuspended in 500 μL of staining solution (phosphate-buffered saline [PBS] containing 50 μg/mL propidium iodide, 0.1% Triton X-100, 0.5 mmol/L EDTA, and 50 μg/mL RNAse A). Cells were then analyzed by flow cytometry and the cell cycle histograms were produced using the Modfit program (Verite Software, Topsham, ME).
RNA extraction and reverse transcription-polymerase chain reaction assay (RT-PCR).
A total of 105 cells were either sorted directly (bone marrow pro–B cells) into microcentrifuge tubes containing 350 μL of RNA lysis buffer (6 mol/L Guanidine thiocyanate, 0.67% Na N-lauroylsarcosine, 33 mmol/L Na Citrate, and 133 mmol/L 2-mercaptoethanol) or first suspended in 150 μL PBS (cell lines). After mixing, the samples were extracted with an equal volume of acid phenol (pH 4.3), and then 1/5 volume of chloroform: isoamyl alcohol (24:1) was mixed with the removed top layer. After a 15-minute incubation on ice, the samples were spun at 10,000 rpm at 4°C for 15 minutes. The top layer was removed and an equal volume of isopropanol was added along with 1 μl of glycogen (20 mg/mL). The samples were precipitated for 1 hour at −20°C and spun at 10,000 rpm at 4°C for 20 minutes. The RNA pellet was washed with 70% ethanol, dried in a speed vacuum, and resuspended in 18 μL of water.
cDNA was synthesized using a reaction mixture consisting of 4 μL of RNA, 6 μL of water, and 1 μL of 10 U/mL random hexamers (Pharmacia, Piscataway, NJ), which was incubated for 10 minutes at 70°C and placed on ice. The following reagents were then added: 2 μL of 10× PCR buffer (Life Technologies, Grand Island, NY), 2 μL of 25 mmol/L MgCl2, 2 μL of 0.1 mol/L dithiothreitol (DTT), and 1 μL of 10 mmol/L dNTPs (Amersham Life Science, Arlington Heights, IL). The mixture was incubated at 25°C for 5 minutes, and 1 μL (20 to 40 U/μL) of RNAsin (Promega, Madison, WI) and 1 μL (200 U/μL) of Superscript II-reverse transcriptase (Life Technologies) was added and incubated for 10 minutes at 25°C. The reaction was then incubated at 42°C for 50 minutes and subsequently at 95°C for 5 minutes.
PCR reactions were performed in a 50-μL reaction mixture containing 1 to 2 μL of cDNA with final concentrations of 1× PCR buffer II (Perkin Elmer Roche, Branchburg, NJ), 2.5 mmol/L MgCl2, 0.1 mmol/L dNTPs, 1 μmol/L of primers, and 2.5 U of Taq polymerase (Perkin Elmer Roche). Primer sequences (5′-3′) were: β-actin (623 bp), sense-CCTAAGGCCAACCGTGAAAAG and antisense-TCTTCATGGTGCTAGGAGCCA; CASPASE-1 (510 bp), sense-GCACATTTCCAGGACTGACTGG and antisense-ACACCACTCCTTGTTTCTCTCCAC; CYCLIN D1 (567 bp), sense-AGTGCGTGCAGAAGGAGATT and antisense-TGGAAAGAAAGTGCGTTGTG; and CYCLIN D2 (568 bp), sense-TCCTCTGGCCATGAATTACC and antisense-ATGCTGCTCTTGACGGAACT. Primer pairs spanned introns to discriminate signals resulting from contaminating DNA. After an initial 10-minute incubation at 80°C for 10 minutes, the PCR conditions were 95°C for 30 seconds, 62°C (for the first five cycles) or 58°C (for subsequent cycles) for 30 seconds, and 72°C for 45 seconds for the indicated number of cycles. Five to ten microliters of amplified cDNAs were run on 1.5% agarose gels and blotted onto Hybond N membranes (Amersham). Filters were ultravioletly crosslinked, hybridized with 5′ end-labeled oligoprobes specific for their corresponding PCR products, and visualized using Biomax-MS film (Kodak, Rochester, NY). Probe sequences (5′-3′) were: β-actin, CCTCCCTGGAGAAGAGCTATGA; CASPASE-1, CACAGCTCTGGAGATGGTGA; CYCLIN D1, TGCAAATGGAACTGCTTCTG; and CYCLIN D2, CCTCACGACTTCATTGAGCA.
DNA preparation, PCR, and data analysis.
Pro–B cells were sorted directly into standard media, pelleted, and lysed in modified STE buffer (50 mmol/L Tris-HCL pH 8.0, 10 mmol/L EDTA, 100 mmol/L NaCL, 0.1% sodium dodecyl sulfate [SDS], and 1 μg/mL Proteinase K) at a concentration of 1 to 2 × 10³cells/μL.20 The lysate was incubated at 55°C for 1 hour and then at 95°C for 5 minutes. One to two microliters of lysate was amplified using the above PCR reagents and conditions for RT-PCR. Primer sequences were; α-actin (737 bp), sense-GTGTCATGGTAGGTATGGGT and antisense-GCGCACAATCTCACGTTCAG; and 5′DFL16.1 (560 bp), sense-GAGTGCCATCAGACACCACAG and antisense-GTGTGGAAAGCTGTGTATCCCC. Blotting and hybridization were performed as above using oligonucleotide probes specific for α-actin (AACTGGGACGACATGGAGAA) and 5′DFL16.1 (CCTAAGCCATACAGTGTACC). The autoradiographs were scanned using National Institute's of Health (Bethesda, MD) Image software. To correct for differences in the amount of inputed DNA, the signal intensity for the 5′DFL16.1 amplifications was normalized by using the α-actin signal for the corresponding sample.
RESULTS
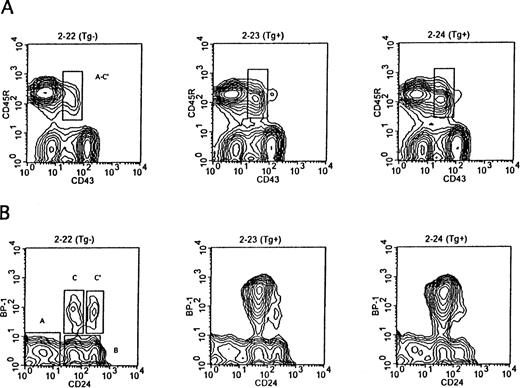
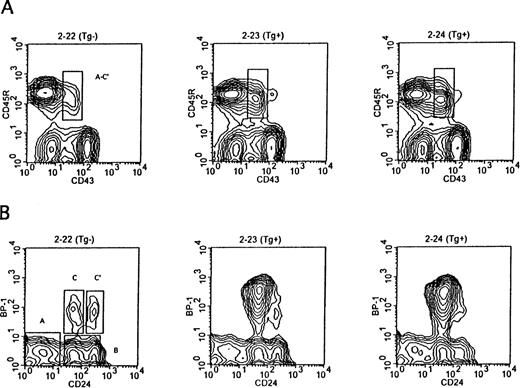
The Eμ-ret mice grow and gain weight at the same rate as their transgene-negative littermates and are thus indistinguishable from their littermates until they develop adenopathy. We compared the pattern of B-cell development in the bone marrow of Eμ-ret mice at 3 to 5 weeks of age to transgene-negative littermates by flow cytometry. Figure 1 shows a representative example from mice in this age range. Figure 1A provides the surface expression staining pattern of CD45R and CD43 in the bone marrow cells of 4-week-old mice. CD45R identifies all B lineage cells, whereas CD43 expression distinguishes the CD43+ pro and early pre–B-cell fractions (Fr A-C′) from the more differentiated CD43− subsets.10 As seen in the figure there is an increase in the population of Fr A-C′ cells in the Eμ-ret mice. Figure 1B represents the pattern of CD24 and BP-1 expression among CD45R+CD43+ gated B lineage cells. As shown, these surface markers allow for the subdivision of CD45R+CD43+ cells into pre pro-B (Fr A), early pro-B (Fr B), late pro-B (Fr C), and early pre-B (Fr C′) subsets. The marked increase in Fr C late pro–B cells in the Eμ-ret mice is illustrated. Of note, the Fr C cells in the Eμ-ret mice have a higher expression of BP-1 than their normal counterparts. Table1 provides the actual percentages of total marrow cells for the different CD45R+CD43+fractions in these mice as well as the percentage of CD45R+CD43− cells that is comprised of pre–B cells (cytoplasmic IgM+), immature B cells (sIgM+), and mature B cells (sIgM+sIgD+). In both transgenic mice, there is a decrease in the percentage of more mature CD45R+CD43− B lineage cells, whereas the percentage of the less mature CD45R+CD43+ cells is increased 1.6- to 2-fold. As noted in Table 1, the increase in the CD45R+CD43+ cell percentage is primarily due to the 15- to 24-fold increase in the late pro–B-cell Fr C, as Fr A, B, and C′ cells are present at similar percentages to the transgene-negative mouse. Although the percentages of Fr A, B, and C′ cells in the Eμ-ret mice are similar to the transgene-negative mouse, the actual number of Fr A, B, and C′ cells are reduced approximately 25% because of the depressed bone marrow cellularity. Consequently, CD45R+CD43− cells are also reduced in number to a greater extent than indicated by the decreased percentage of this population.
Representative flow cytometry of bone marrow showing separation of B lineage subsets by cell-surface antigen expression in 4-week-old Eμ-ret (Tg+) and transgene-negative (Tg−) mice. (A) CD45R+ B lineage cells are resolved into less differentiated (CD43+) and more differentiated subsets (CD43−). The CD43+subset, which is markedly expanded in the Eμ-ret mice, comprises the three pro–B-cell fractions (Fr A through C) and the early pre–B-cell fraction (Fr C′). (B) The CD45R+CD43+subset is further resolved into Fr A through C′ based on BP-1 and CD24 expression. There is a selective expansion of the BP-1+CD24+ late pro–B-cell fraction C in the Eμ-ret mice.
Representative flow cytometry of bone marrow showing separation of B lineage subsets by cell-surface antigen expression in 4-week-old Eμ-ret (Tg+) and transgene-negative (Tg−) mice. (A) CD45R+ B lineage cells are resolved into less differentiated (CD43+) and more differentiated subsets (CD43−). The CD43+subset, which is markedly expanded in the Eμ-ret mice, comprises the three pro–B-cell fractions (Fr A through C) and the early pre–B-cell fraction (Fr C′). (B) The CD45R+CD43+subset is further resolved into Fr A through C′ based on BP-1 and CD24 expression. There is a selective expansion of the BP-1+CD24+ late pro–B-cell fraction C in the Eμ-ret mice.
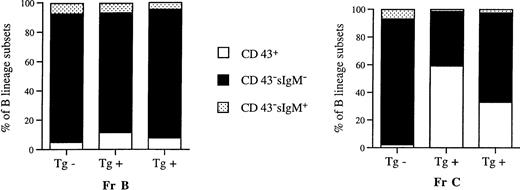
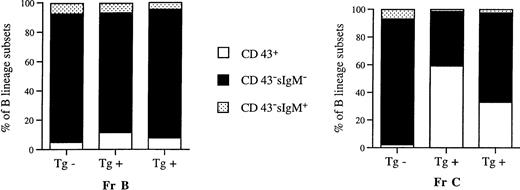
The increased number of late pro–B cells with the accompanying decrease in the more mature B lineage cells indicated that the RFP/RET transgene product might impair the differentiation of late pro–B cells. We took sorted Fr B early pro–B cells and Fr C late pro–B cells from 4-week-old mice and allowed them to differentiate in media supplemented with IL-7 (100 U/mL) over 4 days. We then stained the cells for cell surface expression of CD43 and IgM. Figure2 shows that Fr B cells from both Eμ-ret and transgene-negative mice have similar patterns of differentiation in IL-7 with the majority of cells differentiating to the CD43− stages. However, the two Eμ-ret Fr B samples did have a higher percentage of cells (11.4% and 7.8%) that remained phenotypically as CD43+ pro– or early pre–B cells compared with the transgene-negative Fr B sample (4.2%). In contrast, a markedly higher number of sorted Fr C cells fail to differentiate beyond the CD43+ stage (59.1% and 32.8%) in the two Eμ-ret mice compared with the transgene-negative mouse (2.1%). Thus, the early pro–B cell population from the Eμ-ret mice differentiates better than the late pro–B cell population.
Differentiation patterns of sorted early (Fr B) and late (Fr C) pro–B cells from 4-week-old Eμ-ret (Tg+) and transgene-negative (Tg−) mice. A total of 2 to 4 × 10⁴ cells were cultured in IL-7 (100 U/mL) for 4 days and analyzed by flow cytometry for cell surface expression of CD43 and IgM. Mean percentages are given for duplicate cultures. Cells retaining CD43 expression correspond phenotypically to either the pro–B-cell or early pre–B-cell stage, whereas the cells losing CD43 expression correspond to the late pre–B (sIgM−) or B-cell stage (sIgM+). Fr C late pro–B cells from Eμ-ret mice retain a higher percentage of cells with CD43 expression.
Differentiation patterns of sorted early (Fr B) and late (Fr C) pro–B cells from 4-week-old Eμ-ret (Tg+) and transgene-negative (Tg−) mice. A total of 2 to 4 × 10⁴ cells were cultured in IL-7 (100 U/mL) for 4 days and analyzed by flow cytometry for cell surface expression of CD43 and IgM. Mean percentages are given for duplicate cultures. Cells retaining CD43 expression correspond phenotypically to either the pro–B-cell or early pre–B-cell stage, whereas the cells losing CD43 expression correspond to the late pre–B (sIgM−) or B-cell stage (sIgM+). Fr C late pro–B cells from Eμ-ret mice retain a higher percentage of cells with CD43 expression.
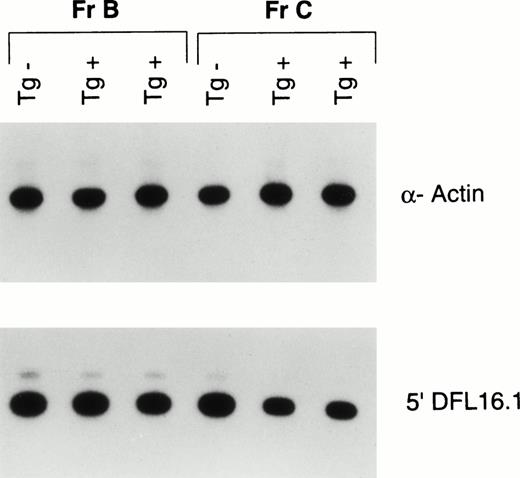
We next investigated whether Fr C late pro–B cells in the young Eμ-ret mice have higher levels of VDJ rearrangements compared with transgene-negative mice. We sorted Fr B and Fr C pro–B cells from 4-week-old mice and isolated DNA. We amplified by PCR a 560-bp region upstream of the most 5′ D gene, DFL16.1, in the IgH locus. Because this region also lies 3′ to the V gene IgH locus, it is lost upon V to DJ rearrangement.21 A previous study in BALB/c mice detecting deletions 5′ to the J locus (indicating DJ rearrangement) as well as 5′ to the D locus showed that Fr C late pro–B cells had a higher percentage of DJ rearrangements than Fr B cells, but that both fractions had a paucity of VDJ rearrangements.10 As can be seen in Fig 3, Fr B cells from the Eμ-ret mice have a comparable signal intensity as the early pro–B cells from the transgene negative mouse for the 5′ DFL16.1 sequence. Thus, early pro–B cells from Eμ-ret mice are similar to early pro–B cells from the transgene-negative mouse in their lack of VDJ rearrangements. However, analysis of Fr C cells shows a greater than 50% decrease in intensity of the 5′ DFL16.1 amplified sequence in the Eμ-ret mice compared with the transgene-negative mouse. These results indicate that at least half of the IgH loci present in the late pro–B cells from the Eμ-ret mice have undergone V to DJ recombination.
PCR analysis of completed VDJ rearrangement of the IgH locus in sorted early (Fr B) and late (Fr C) pro–B cells from 4-week-old Eμ-ret (Tg+) and transgene-negative (Tg−) mice. A 560-bp region upstream of the most V proximal D element, DFL16.1, that is lost on V to DJ rearrangement was amplified. Autoradiography was used to compare the signal intensity of the 5′ DFL16.1 amplification after standardization with an α-actin signal. Fr B cells from the Eμ-ret mice average 98% of the 5′ DFL16.1 signal intensity generated by Fr B cells from the transgene negative mice, whereas the Fr C cells average 43% of the signal intensity generated by the Fr C cells from the transgene-negative mice. Shown are 30-minute exposures of 26 cycles of amplification from the DNA of approximately 2 × 10³ cells.
PCR analysis of completed VDJ rearrangement of the IgH locus in sorted early (Fr B) and late (Fr C) pro–B cells from 4-week-old Eμ-ret (Tg+) and transgene-negative (Tg−) mice. A 560-bp region upstream of the most V proximal D element, DFL16.1, that is lost on V to DJ rearrangement was amplified. Autoradiography was used to compare the signal intensity of the 5′ DFL16.1 amplification after standardization with an α-actin signal. Fr B cells from the Eμ-ret mice average 98% of the 5′ DFL16.1 signal intensity generated by Fr B cells from the transgene negative mice, whereas the Fr C cells average 43% of the signal intensity generated by the Fr C cells from the transgene-negative mice. Shown are 30-minute exposures of 26 cycles of amplification from the DNA of approximately 2 × 10³ cells.
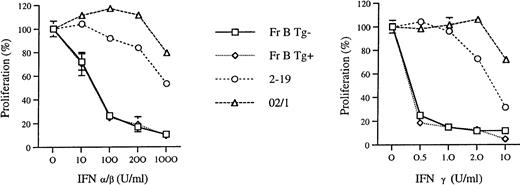
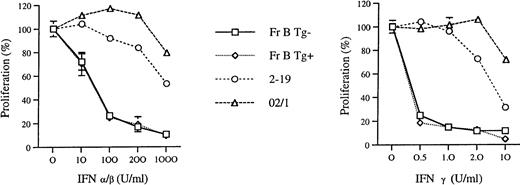
Because the Fr C cells in the young Eμ-ret mice appeared to be comprised of a population of late pro–B cells with nonproductive rearrangements, we wanted to determine whether expression of the transgene construct might make pro–B cells resistant to cytokines known to inhibit proliferation and induce apoptosis in B precursor cells.22 23 We compared the sensitivity of Fr B cells cultured in IL-7 to growth inhibition by IFN-α/β and IFN-γ in both Eμ-ret mice and transgene-negative mice. We chose to compare early pro–B cells because these two populations are similar in their ability to differentiate in IL-7, have comparable levels of VDJ rearrangements, and the transgene is already expressed at this stage (data not shown). We also compared the sensitivity of these early pro–B cells with an IL-7–dependent (2-19) and independent (02/1) pro–B-cell leukemia line derived from Eμ-ret mice with adenopathy and hepatosplenomegaly. As seen in Fig 4,Fr B cells from 3- to 5-week-old Eμ-ret and transgene-negative mice have identical patterns of growth inhibition by IFN-α/β, with greater than 50% inhibition noted with concentrations of 100 U/mL. The IL-7–dependent line, 2-19, was less sensitive than the sorted cells to growth inhibition at each concentration of IFN-α/β. The IL-7–independent line, 02/1, showed the least sensitivity with less than 50% growth inhibition to IFN-α/β even at a concentration of 1,000 U/mL. In regards to IFN-γ sensitivity, we found that Fr B cells from the Eμ-ret and transgene-negative mice also exhibited the same pattern of growth inhibition. As seen in Fig 4, sorted Fr B cells exhibited greater than 50% growth inhibition with 0.5 U/mL IFN-γ. In contrast, the 2-19 line required 10 U/mL of IFN-γ to achieve a greater than 50% inhibition, and this level of inhibition was still less than that achieved with 0.5 U in the Fr B cells. The 02/1 line was relatively resistant with some inhibition noted only with the 10 U/mL of IFN-γ. In addition to growth inhibition, the proportion of dead to live cells in the cultures as measured by propidium iodide staining was similar between the two Fr B populations (data not shown). These results indicate that there is no difference in sensitivity to IFN-α/β and -γ between early pro–B cells from young Eμ-ret and transgene-negative mice.
The effect of IFN-α/β and IFN-γ on the growth of sorted early (Fr B) pro–B cells from 3- to 5-week-old Eμ-ret (Tg+) and transgene-negative (Tg−) mice. A total of 2 to 4 × 10⁴ Fr B cells were cultured in IL-7 (100 U/mL) for 4 days along with the indicated amount of the IFN. A total of 2 × 10⁵ cells from the Eμ-ret–derived pro–B-cell lines, 2-19 and 02/1, were cultured for 3 days with (2-19) or without (02/1) IL-7. The proliferation percentages were calculated relative to the amount of proliferation (sum of live and dead cells) observed in the absence of the IFN (set at 100%). Mean percentages are given for two different sorts (Fr B cells) or two separate experiments (cell lines), and standard deviations are indicated by the error bars. Cell number was measured either by flow cytometry (Fr B cells) or by light microscopy (cell lines). The ratio of live to dead cells in the Fr B cell cultures from both the Eμ-ret and transgene-negative mice, as measured by propidium iodide staining, were similar for each IFN concentration.
The effect of IFN-α/β and IFN-γ on the growth of sorted early (Fr B) pro–B cells from 3- to 5-week-old Eμ-ret (Tg+) and transgene-negative (Tg−) mice. A total of 2 to 4 × 10⁴ Fr B cells were cultured in IL-7 (100 U/mL) for 4 days along with the indicated amount of the IFN. A total of 2 × 10⁵ cells from the Eμ-ret–derived pro–B-cell lines, 2-19 and 02/1, were cultured for 3 days with (2-19) or without (02/1) IL-7. The proliferation percentages were calculated relative to the amount of proliferation (sum of live and dead cells) observed in the absence of the IFN (set at 100%). Mean percentages are given for two different sorts (Fr B cells) or two separate experiments (cell lines), and standard deviations are indicated by the error bars. Cell number was measured either by flow cytometry (Fr B cells) or by light microscopy (cell lines). The ratio of live to dead cells in the Fr B cell cultures from both the Eμ-ret and transgene-negative mice, as measured by propidium iodide staining, were similar for each IFN concentration.
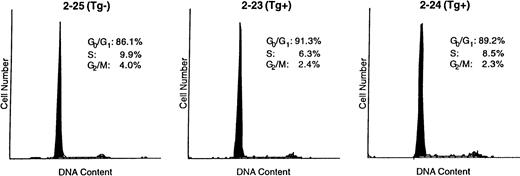
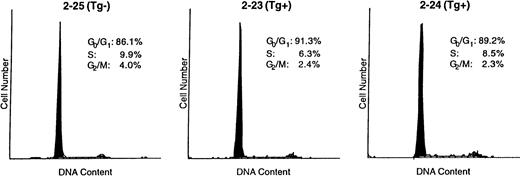
Lastly, we wanted to determine whether the increased number of Fr C late pro–B cells in the young Eμ-ret mice could in part be accounted for by a proliferative signal provided by the transgene product. Thus, we examined the cell cycle parameters of late pro–B cells from the bone marrow of 4-week-old Eμ-ret and transgene-negative mice. Figure5 shows the cell cycle histograms of a transgene-negative mouse compared with two Eμ-ret mice. The Fr C cells from the transgene-negative mouse had 13.9% of cells with a DNA content greater than G0 + G1, whereas Fr C cells from the two Eμ-ret mice had somewhat lower percentages of cells (8.7% and 10.8%) with a DNA content greater than G0+ G1. Consequently, these data indicate that Fr C cells in the Eμ-ret mice may have a slightly prolonged cell cycle (longer G1) or, alternatively, that there are slightly more cells not in cycle (larger G0 percentage). In addition, the hypodiploid percentage in the transgene-negative mouse was 1.1%, compared with 0.8% and 0.1% for the two Eμ-ret mice. The lower percentage of hypodiploid Fr C cells found in the freshly prepared bone marrow of Eμ-ret mice suggests that these cells may have a lower rate of apoptosis.
Cell cycle parameters in sorted late (Fr C) pro–B cells from 4-week-old Eμ-ret (Tg+) and transgene-negative (Tg−) mice. A total of 3 to 5 × 10³ Fr C cells were directly sorted into 80% ethanol and subsequently stained with propidium iodide for analysis of DNA content by flow cytometry.
Cell cycle parameters in sorted late (Fr C) pro–B cells from 4-week-old Eμ-ret (Tg+) and transgene-negative (Tg−) mice. A total of 3 to 5 × 10³ Fr C cells were directly sorted into 80% ethanol and subsequently stained with propidium iodide for analysis of DNA content by flow cytometry.
We were also interested in determining what subsequent steps might be involved in the malignant transformation of the late pro–B cells. We screened bone marrow or lymph node samples from eight Eμ-ret mice with lymphadenopathy and hepatosplenomegaly for alterations in the transcription of genes that control the cell cycle and apoptosis by RT-PCR. We did not screen for the downregulation of N-myc as previously reported in the tumors of Eμ-ret mice.17 The majority of samples showed upregulated CYCLIN D1 expression and downregulated CASPASE-1 expression compared with normal late pro–B cells. We then wanted to determine whether these abnormalities might be detectable before the clinical onset of leukemia.
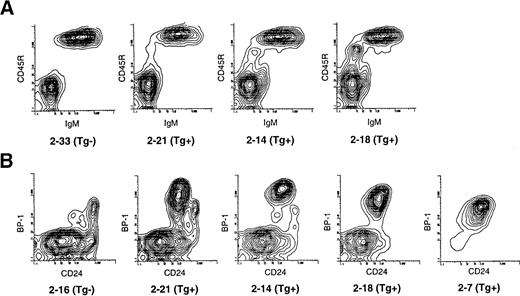
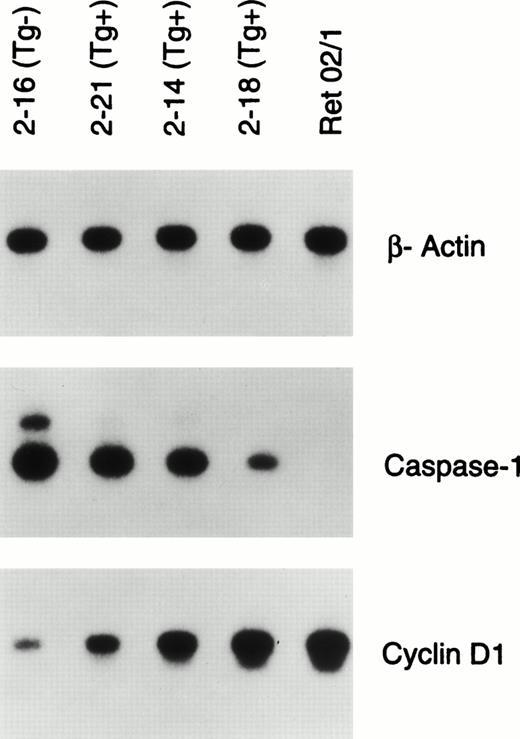
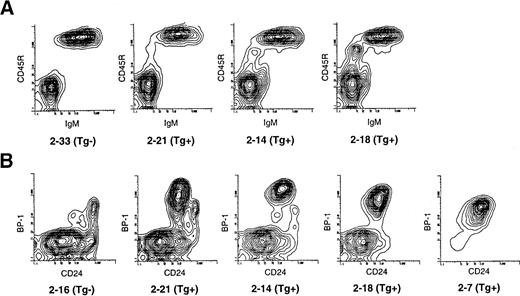
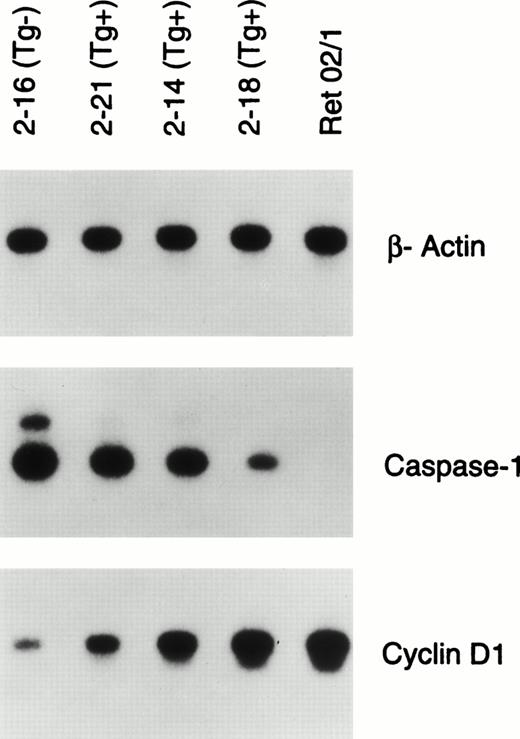
Consequently, as shown in Fig 6A we identified a litter of well-appearing 13-week-old mice in which three Eμ-ret mice showed in the peripheral blood increasing amounts of CD45R+sIgM− cells, presumed to represent circulating late pro–B cells or lymphoblasts. As seen in Table2, the percentage of these peripheral blood B precursor cells in the Eμ-ret mice ranged from 1.5% to 4.8% compared with 0.1% for a transgene-negative mouse. The bone marrow of these 13-week-old Eμ-ret mice revealed a predominance of Fr C late pro–B cells as illustrated in Fig 6B. Similar to the 4-week-old Eμ-ret mice, the late pro–B-cell population from these older Eμ-ret mice remained less than 5% of the total bone marrow population, and no mouse had obvious adenopathy. Specifically, the late pro–B cells constituted 4.2%, 3.6%, and 4.3% of the bone marrow population from mice 2-21, 2-14, and 2-18, respectively, compared with 0.3% for the transgene-negative littermate 2-16 (Table 2). In contrast to the 4-week-old Eμ-ret mice, the 13-week-old mice showed a variable decrease in the percentage of other CD45R+CD43+B lineage subsets. We sorted the late pro–B Fr C cells from the three Eμ-ret mice and the transgene-negative littermate and performed RT-PCR for the expression of CYCLIN D1 and CASPASE-1 as seen in Fig7. CASPASE-1 expression was downregulated and CYCLIN D1 upregulated to an extent that correlates not only with the amount of circulating CD45R+sIgM− cells in the peripheral blood, but also with the progressive loss of the early pro– (Fr B) and early pre– (Fr C′) B cells in the bone marrow (Fig 6 and Table 2).
Flow cytometry of peripheral blood and bone marrow of 13-week-old well-appearing Eμ-ret (Tg+) littermates and transgene-negative (Tg−) mice. (A) Density separated peripheral blood lymphocytes were stained for CD45R and IgM expression. Varying amounts of an abnormal population of CD45R+sIgM− B precursor cells are present in the Eμ-ret mice. (B) CD45R+CD43+ gated bone marrow cells from the above Eμ-ret mice along with a Tg− littermate were resolved by BP-1 and CD24 staining into the pro–B cell Fr A through C and early pre–B Fr C′. Eμ-ret mouse 2-7 was an 11-week-old with splenomegaly and adenopathy.
Flow cytometry of peripheral blood and bone marrow of 13-week-old well-appearing Eμ-ret (Tg+) littermates and transgene-negative (Tg−) mice. (A) Density separated peripheral blood lymphocytes were stained for CD45R and IgM expression. Varying amounts of an abnormal population of CD45R+sIgM− B precursor cells are present in the Eμ-ret mice. (B) CD45R+CD43+ gated bone marrow cells from the above Eμ-ret mice along with a Tg− littermate were resolved by BP-1 and CD24 staining into the pro–B cell Fr A through C and early pre–B Fr C′. Eμ-ret mouse 2-7 was an 11-week-old with splenomegaly and adenopathy.
RT-PCR analysis of gene expression of β-actin, CASPASE-1, and CYCLIN D1 in the sorted late pro–B cells (Fr C) of 13-week-old well-appearing Eμ-ret (Tg+) and transgene-negative littermates (Tg−) mice. Ret 02/1 is a pro–B-cell leukemia line derived from an Eμ-ret mouse. The autoradiograms shown represent 30-minute to 1-hour exposures of 22 (β-actin) or 26 cycles (CASPASE-1 and CYCLIN D1) of amplification.
RT-PCR analysis of gene expression of β-actin, CASPASE-1, and CYCLIN D1 in the sorted late pro–B cells (Fr C) of 13-week-old well-appearing Eμ-ret (Tg+) and transgene-negative littermates (Tg−) mice. Ret 02/1 is a pro–B-cell leukemia line derived from an Eμ-ret mouse. The autoradiograms shown represent 30-minute to 1-hour exposures of 22 (β-actin) or 26 cycles (CASPASE-1 and CYCLIN D1) of amplification.
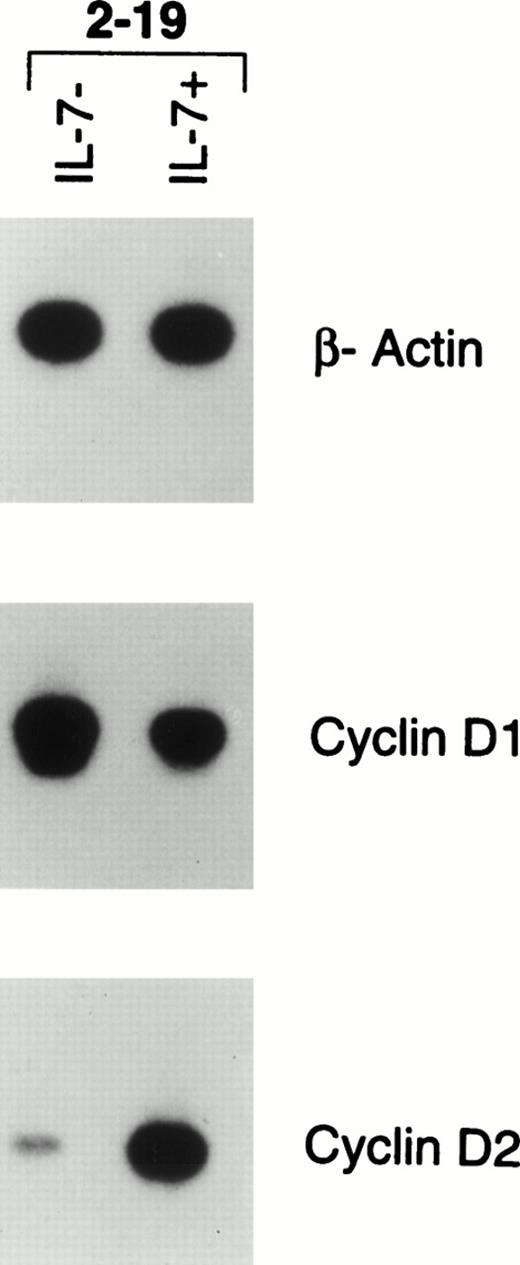
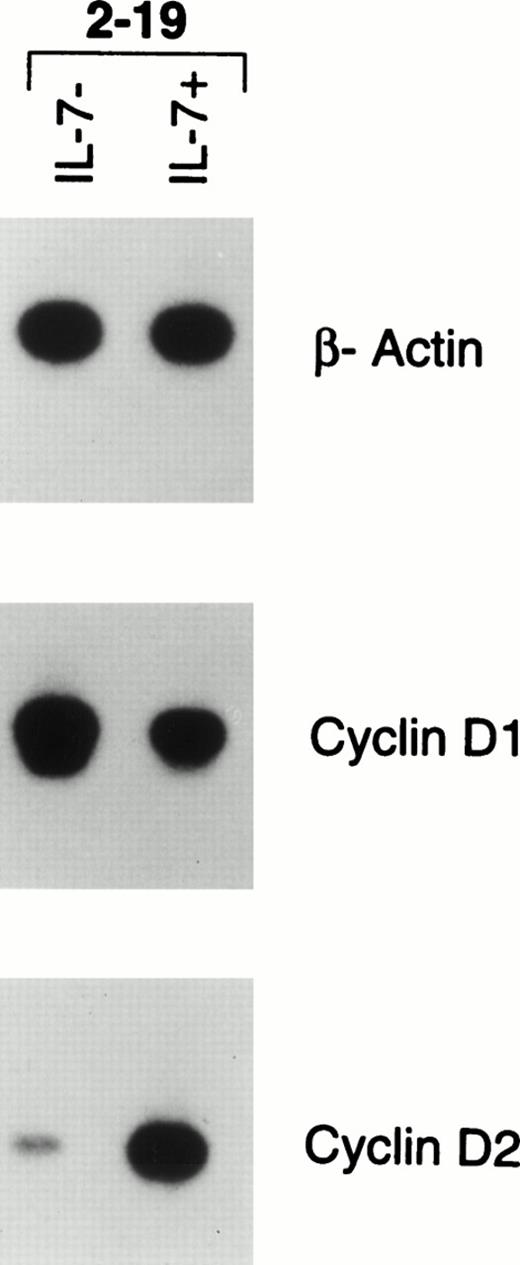
Lastly, we wanted to determine whether CYCLIN D1 expression correlates with proliferation and could account for the outgrowth of a leukemic clone in the Eμ-ret mice. We took bone marrow from mouse 2-19, which had developed hepatosplenomegaly and adenopathy, and cultured the cells for 4 days with and without IL-7. The marrow cells remained viable when cultured without IL-7 but did not proliferate, whereas there was a fourfold increase in cell number in the cultures supplemented with IL-7. As shown in Fig 8, RT-PCR analysis of the bone marrow cells placed in media alone showed marked CYCLIN D1 expression but minimal CYCLIN D2 expression, the latter of which is normally expressed in late pro–B cells. However, the bone marrow cells supplemented with IL-7 downregulated CYCLIN D1 expression, but markedly upregulated CYCLIN D2 expression. In contrast, the 02/1 line, which proliferates in the absence of IL-7, expresses CYCLIN D1 (Fig 7) but not CYCLIN D2 (data not shown), indicating that additional alterations in cell cycle control has occurred in the 02/1 line.
RT-PCR analysis of gene expression of β-actin, CYCLIN D1, and CYCLIN D2 in the pro–B-cell leukemia of an Eμ-ret mouse. Bone marrow was recovered from an Eμ-ret mouse (2-19) with adenopathy and splenomegaly and directly cultured for 4 days with or without IL-7 (100 U/mL). The cells survived without proliferation in media without IL-7 and proliferated fourfold in media supplemented with IL-7. The autoradiograms shown represent 30-minute exposures of 22 (β-actin) or 30 cycles (CYCLINS) of amplification.
RT-PCR analysis of gene expression of β-actin, CYCLIN D1, and CYCLIN D2 in the pro–B-cell leukemia of an Eμ-ret mouse. Bone marrow was recovered from an Eμ-ret mouse (2-19) with adenopathy and splenomegaly and directly cultured for 4 days with or without IL-7 (100 U/mL). The cells survived without proliferation in media without IL-7 and proliferated fourfold in media supplemented with IL-7. The autoradiograms shown represent 30-minute exposures of 22 (β-actin) or 30 cycles (CYCLINS) of amplification.
DISCUSSION
In this study we have characterized bone marrow B-cell development in the Eμ-ret mouse before the onset of frank leukemia to better understand the events that lead to transformation. Initially, we wanted to identify early changes in B-cell development that would likely arise as a direct effect of the transgene product. The RFP/RET chimeric protein, the product of the Eμ-ret transgene, has been proposed to function as a constitutively activated ret kinase,24,25 but it is possible that some of the effects of this protein result from an abnormality of transcriptional regulation mediated by the truncated RFP transcriptional activator.26,27 At 3 to 5 weeks of age, we found that Eμ-ret mice show a profound overexpansion of the late pro–B-cell population and decreased amounts of more mature CD43− B lineage cells. The selective abnormality in the late pro–B-cell population may be unique to the Eμ-ret mice because several other mouse models of B lineage malignancies usually have abnormalities in additional B lineage cells subsets. Specifically, in the bone marrow of Eμ-myc mice an early and intermediate stage was characterized as having increased amounts of pre–B cells (cytoplasmic IgM+sIgM−) whose population later decreased below normal levels, whereas the pro–B-cell population remained elevated.6 In the bone marrow of IL-7 transgenic mice, all CD45R+ subsets were elevated with the increase in the pre–B-cell population predominating.28 Lastly, in the pristane granuloma model of plasmacytoma, there is a persistent increase in the total pro–B-cell (TdT+) population of the bone marrow with a coincident loss of pre–B and B cells after a single injection of pristane into the peritoneum.29 Thus, depending on the specific inducing factor, various patterns of aberrant B precursor cell development in the bone marrow may precede the outgrowth of a malignant clone.
In murine B-cell development, differentiation beyond the pro–B-cell stage is dependent on μ protein. Hence, B-cell differentiation is arrested at the CD43+ late pro–B cell stage in recombination-deficient mice, but CD43− pre–B cells are produced in these mice when they carry μ transgenes.30-32Consequently, we explored the possibility that the transgenic construct interfered with the normal recombination process such that the ability of pro–B cells to differentiate to the pre–B-cell stage was impaired. Indeed, the Fr C late pro–B cells from the Eμ-ret mice had a markedly higher percentage of cells that remained CD43+ in short-term cultures with IL-7 compared with the transgene-negative mouse. However, Fr B early pro–B cells from the Eμ-ret mice, which are present in similar amounts to the transgene-negative mice and already express the Eμ-ret transgene, had only a slightly higher percentage of cells that remained CD43+ compared with normal early pro–B cells. We interpret the Fr B results as indicating that the transgene product does not globally impair differentiation at the pro–B cell to pre–B-cell transition but might allow some late pro–B cells to survive without differentiating in the Eμ-ret mice. Taken together with the Fr C results, these data suggest that the late pro–B cells that fail to differentiate might accumulate over time and overpopulate the bone marrow in the Eμ-ret mice. Furthermore, it is possible that the decreased number of more mature CD45R+CD43− cells seen in the Eμ-ret mice may result from an inhibition of Fr B–cell differentiation either by competition for stromal cell sites with Fr C cells or by alterations in cytokine levels as a response to the overexpanded pool of Fr C cells.
At the genomic level, late pro–B cells have undergone DJ rearrangement usually on both IgH alleles and are in the process of rearranging a V gene to the DJ joining. However, the majority of late pro–B cells appear to lack a completed VDJ joining.10 Thus, it is likely that late pro–B cells rapidly differentiate to the pre–B-cell stage upon productive VDJ rearrangement, whereas those cells that make nonproductive rearrangements are rapidly eliminated. Accordingly, cytoplasmic μ protein was not detected in Fr C late pro–B cells,19 and the pro–B-cell population was found to have the highest frequency of cells undergoing apoptosis among marrow B lineage cells.13 We used a deletional analysis10 to determine the relative abundance of VDJ joinings in the early and late pro–B cells of Eμ-ret and transgene-negative mice. The analysis indicated that the majority of IgH alleles have complete VDJ rearrangements (or deletions) within the Eμ-ret late pro–B-cell population unlike the population from the transgene-negative mice. Although we did not investigate whether the late pro–B-cell population from the Eμ-ret mice might contain some cells with productive rearrangements and cytoplasmic μ protein, the finding that the majority of B precursor leukemias from Eμ-ret mice lack μ protein (data not shown) suggests that the rearrangements are predominately nonproductive. Furthermore, the vast majority of VDJ rearrangements in Fr C late pro–B cells were shown to be nonproductive.33 Thus, it appears that the initial expansion of the late pro–B-cell population in the Eμ-ret mouse results from the failure of cells with nonproductive rearrangements to undergo apoptosis.
The steps whereby late pro–B cells with nonproductive VDJ rearrangements undergo apoptosis remain largely unknown. Macrophages have been visualized ingesting apoptotic B lineage cells, and this phagocytic activity likely accounts for the relative paucity of detectable apoptotic cells in bone marrow.34 In the absence of macrophage ingestion, bone marrow cultured in simple media for 8 hours shows a marked increase in the percentage of apoptotic B lineage cells, especially pro–B cells, indicating that internal signals likely determine the fate of normal late pro–B cells.13 The signaling pathway that triggers the death of late pro–B cells appears to invoke the BCL-XL protein.35 Most notably, transgenic mice that overexpress BCL-XL in B lineage cells specifically generate increased number of pro–B cells with a predominance of aberrant and nonproductive IgH rearrangements.36 This observation contrasts with the development of mature B-cell and very early B progenitor cell lymphoma cells seen in mice carrying BCL-2 transgene constructs,37,38 but is consistent with the expression pattern of these two genes in marrow B lineage cells; BCL-XL is expressed higher than BCL-2 in pro– and pre–B cells, whereas BCL-2 is expressed higher in progenitor and mature B cells.35 Furthermore, studies from knockout mice that lack the RET receptor or its ligand, glial cell line–derived neurotrophic factor, suggest that RET activity is necessary for the survival of enteric neurons and embryonic renal cells.39,40 Thus, constitutive RET tyrosine kinase activity provided by the RFP/RET protein might produce a survival signal that overrides the apoptotic signal generated in late pro–B cells with nonproductive VDJ rearrangements. Because RET is normally downregulated by the production of μ protein during murine B lineage development,14 it is conceivable that RET participates in the survival of pro–B cells rearranging the IgH loci. However, we have not detected any specific abnormalities in B lineage development in RET knockout mice39 (unpublished observations, August 1995). We do not know whether RET activity affects BCL-XL function, but levels of BCL-XL mRNA are not notably different in late pro–B cells from Eμ-ret mice compared with those from transgene-negative mice. In addition, RET activation does not appear to be a common event in the pathogenesis of human B precursor ALL.41
IFN-α and -β can directly inhibit proliferation and induce apoptosis in marrow B precursor cells and IL-7–dependent B precursor lines.23 In contrast, IL-2–, IL-3–, or IL-4–dependent and cytokine-independent B lineage lines are relatively resistant to IFN-α and -β.23 IFN-γ, like IFN-α/β, was also shown to inhibit proliferation and cause apoptosis in IL-7–dependent B precursor cells.22 Consequently, we wanted to determine whether pro–B cells that express the Eμ-ret transgene might also be resistant to the effects of these IFN. An IL-7–dependent and a cytokine-independent pro–B-cell line derived from Eμ-ret mice had either no or minimal inhibition of proliferation, respectively, at concentrations of IFN known to inhibit normal marrow B precursor cells and IL-7–dependent B precursor cell lines. In contrast, the early pro–B cells from young Eμ-ret and transgene-negative mice were similarly sensitive to growth inhibition and cell death induced by the IFN. These cytokine studies indicate that the expression of the transgene alone cannot account for the relative resistance to IFN seen in the Eμ-ret leukemias.
Because macrophages were shown to be the predominant producer of IFN-α/β activity in the marrow23 and T-cell– or natural killer cell–generated IFN-γ can activate macrophages,42,43 it is possible that these three IFN play a role in the initial containment of the overexpanding late pro–B-cell population. Interestingly, Jacobsen et al7 observed a pretumorous phase in the bone marrow of Eμ-myc mice characterized by increased numbers of apoptotic B lineage cells and their phagocytosis by macrophages. However, the authors proposed that the activity of the MYC gene may have been responsible for the increase in the rate of B precursor cell apoptosis, and the macrophage activity was simply a response to the increased cell death.7 Nonetheless, these cytokine data suggest that the development of resistance to growth suppressing stimuli, as manifested in the Eμ-ret leukemias, is a later event that may allow for the outgrowth of a malignant clone. Thus, the Eμ-ret transgene appears to create a high-risk population of late pro–B cells that will acquire additional mutations before becoming transformed.
The cause of the elevated BP-1 levels in the Fr C cells from the Eμ-ret mice is unknown. IL-7 and IFN-α/β have been shown to increase BP-1 expression despite their opposite effects on proliferation.44-46 Consequently, it is possible that BP-1 overexpression results from either increased stromal cell IL-7 production in response to the deficient lymphopoiesis or the release of the type 1 IFN as part of the host response to contain the overexpanded pool of late pro–B cells.
To begin to characterize the secondary mutational events that occur in the expanded late pro–B cell population, we screened for alterations in expression of genes that control the cell cycle. We studied the expression of the D CYCLINS, because these CYCLINS are synthesized in response to growth-inducing cytokines and their expression is the least cell-cycle phase dependent.47 We found that the majority of leukemias from the Eμ-ret mice express CYCLIN D1, whereas CYCLIN D1 mRNA is barely detectable in normal late pro–B cells. The appearance of CYCLIN D1 expression is a characteristic of a diverse type of malignancies, and it occurs secondary to a t(11;14)(q13;q32) involving its rearrangement to the IgH loci in mantle B-cell lymphomas.48 In addition, abnormal CYCLIN D1 expression has been noted in the lymphomas of Eμ-myc mice.49Surprisingly, transgenic mice that carry a CYCLIN D1 gene driven by an IgH enhancer have only minor alterations in bone marrow B lymphopoiesis and infrequent tumor formation.49 50
In 13-week-old well-appearing Eμ-ret mice whose bone marrow contained less than 5% late pro–B cells, we found increasing amounts of CYCLIN D1 expression that correlated with the disappearance of the less differentiated early pro–B cell and more differentiated pre–B cells as well as the amount of B precursor cells in the peripheral blood. In the absence of IL-7, the Eμ-ret pro–B-cell leukemia line, 2-19, survives without proliferation and expresses CYCLIN D1 but not CYCLIN D2. In contrast, the 2-19 line downregulates CYCLIN D1 and upregulates CYCLIN D2 while proliferating in IL-7. These later observations indicate that CYCLIN D1 expression per se is not sufficient to provide a proliferative signal even in Eμ-ret pro–B cells that already have other abnormalities. Consequently, the IL-7–independent proliferation of the Eμ-ret pro–B cell line, 02/1, which expresses CYCLIN D1 but not CYCLIN D2, suggests that additional mutations need to occur for CYCLIN D1 to drive proliferation. Furthermore, the IL-7–dependent proliferation of normal pro–B cells appears to be a consequence of cytoplasmic μ protein production. As a result, pro–B cells from recombination-deficient mice fail to proliferate in IL-7 alone, whereas pro–B cells from recombination-deficient mice expressing μ transgenes proliferate similarly to normal late pro–B cells.30,31 Thus, the ability of Eμ-ret late pro–B-cell leukemias to proliferate without μ protein production suggests that a secondary event in the Eμ-ret late pro–B cells is the uncoupling of proliferation from differentiation. In this regard, functional analysis of the IL-7 receptor α chain has identified distinct domains that signal for proliferation and differentiation,51 raising the possibility that the IL-7–dependent proliferative pathway is activated independent of the differentiation pathway in the Eμ-ret late pro–B-cell leukemias. In Abelson murine leukemia virus–transformed B precursor cells, STAT proteins normally activated by IL-7 were tyrosine-phosphorylated in the absence of this cytokine.52This later mechanism could account for the IL-7–independent growth of the ret 02/1 B precursor line.
Because resistance to external apoptotic stimuli such as IFN exposure also appears to be a secondary event in the transformation of late pro–B cells, we screened for alterations in expression of genes that control apoptosis.35,53 We studied the expression of BCL-XL, BCL-2, BAX, CASPASE-1, and CASPASE-3 in late pro–B cells and B precursor leukemias from Eμ-ret mice. CASPASE-1 was the only gene to show consistent abnormalities at the transcriptional level as its downregulation was noted in B precursor leukemias and the late pro–B cells of older mice. CASPASE-1 is expressed in all bone marrow B lineage fractions but at the highest levels in late pro–B cells.54 Furthermore, CASPASE-1 expression is minimal in fetal liver pro–B-cell development with a fivefold reduction in expression compared with marrow late pro–B cells.54 There are two potential mechanisms whereby CASPASE-1 downregulation might inhibit apoptosis in the late pro–B cells from Eμ-ret mice. CASPASE-1 downregulation could directly block the transmission of an apoptotic signal initiated by an external stimulus. T cells from CASPASE-1–deficient mice are resistant to FAS-induced apoptosis,55 and B-cell receptor cross-linking was recently shown to prevent FAS-induced cell death by inactivating CASPASE-1.56 Alternatively, CASPASE-1 downregulation might prevent the activation of apoptosis-inducing cytokines expressed within the late pro–B cells. In support, CASPASE-1 activity has been shown to activate the proinflammatory cytokines IL-1α, IL-1β, and IL-18 (IFN-γ–releasing factor) from their mature forms in other hematopoietic cell lineages.55 57-59 In either scenario, the correlation between the loss of other B lineage marrow fractions with CASPASE-1 downregulation in the late pro–B cells suggests that CASPASE-1 downregulation may allow the late pro–B cells to survive in the presence of a factor capable of killing other B lineage cells. This factor may be synthesized by cells in the bone marrow compartment as part of the host response to control the late pro–B-cell expansion or perhaps from the late pro–B cells themselves.
Most notably, the coincident upregulation of CYCLIN D1 and downregulation of CASPASE-1 expression may represent the emergence of a clonal and thus transformed population within the pool of late pro–B cells. It is possible that the abnormal transcriptional control of these genes represents a coordinate process mediated by the aberrant expression of a transcriptional factor. Accordingly, in human B precursor ALL, transcriptional activators are often one component of a chimeric protein produced from a chromosomal translocation.4 Thus, there may be a requirement for transformation that includes the simultaneous activation and repression of proliferative and apoptotic pathways, respectively. Further studies will be directed toward determining whether these abnormalities of gene expression represent transformation.
ACKNOWLEDGMENT
We thank T. Iwamato for the ret 02/1 cell line and the Eμ-ret construct; C.H. Pletcher, S.-J. Jeong, and J.S. Moore for their technical assistance and the use of the Flow Cytometry and Cell Sorter Facility of the University of Pennsylvania Cancer Center; S. Shinton for technical assistance; and G.M. Brodeur for his advice and comments on the manuscript.
Supported by Grant No. DHP 176 from the American Cancer Society and by the University of Pennsylvania Cancer Center Core Support Grant.
Address reprint requests to Robert Wasserman, MD, Division of Oncology, The Children's Hospital of Philadelphia, 34th and Civic Center Blvd, Philadelphia, PA 19104.
The publication costs of this article were defrayed in part by page charge payment. This article must therefore be hereby marked "advertisement" is accordance with 18 U.S.C. section 1734 solely to indicate this fact.

