Abstract
When blood (plasma) contacts certain foreign surfaces, factor XII can activate and trigger a series of reactions leading to cleavage of kininogens with subsequent release of bradykinin. In this study, we investigated two different widely used leukocyte removal filters, Pall PXL8K (A) and Asahi PLS-5A (B), to test whether clinically significant contact activation occurred during leukodepletion of platelet-rich plasma (PRP). Kininogens were measured by particle concentration fluorescence immunoassay (PCFIA), which can detect cleavage of high and low molecular weight kininogens (HK and LK), the parent molecules of bradykinin, to determine if contact activation had occurred. A slight, nonsignificant decrease in HK and LK was observed with filter A after the first 5 mL was filtered that returned to prefiltration levels by the end of the filtration. Specific TotK (the combined measurement of HK and LK heavy chains divided by plasma protein concentration) showed a small, significant decrease with filter A after the first 5 mL of platelet concentrates was filtered that returned to prefiltration levels by the end of the filtration. There were no significant increases or decreases in the cleaved kininogen index (CKI), an index of HK proteolytic activation or HK and LK destruction (with release of bradykinin). These data suggest that small amounts of both HK and LK initially adsorb to filter A and then desorb, primarily intact. These data also indicate that no significant contact activation, as measured by PCFIA, occurs during leukodepletion of platelet concentrates with either filter A or B.
HIGH MOLECULAR WEIGHT kininogen (HK) is the procofactor for activation of the contact system1 as well as one of the parent molecules for the vasodilatory peptide, bradykinin.2 When blood contacts some negatively charged artificial surfaces, factor XII can become activated3 and, after a series of enzymatic reactions, HK is cleaved to release bradykinin, a peptide that can induce hypotension.4 Because contact activation is a surface-mediated event, the rate of contact activation is proportional to the surface area contacted.
The cleavage of HK by factor XIIa and plasma kallikrein activates HK from its procofactor form to the active cofactor, HKa,5 and concomitantly releases bradykinin.6 In clinical sepsis, the detection of cleaved HK is the most sensitive indicator of contact system activation.7
The contact system has been reported to become activated upon exposure of blood plasma to negatively charged artificial surfaces, with a large surface area, such as those encountered during cardiopulmonary bypass,8 therapeutic apheresis with hollow-fiber devices,9 and newer hemodialysis membranes where bradykinin has also been detected.10,11 Recently, it was hypothesized that increased contact activation and subsequent accumulation of bradykinin might occur when platelet concentrates are filtered with certain negatively-charged leukocyte filtration devices12-14 and that this could explain the hypotension that is observed with some patients after transfusion. In this study, we compared the negatively charged Pall PXL8K leukocyte removal filter to the positively charged Asahi PLS-5A leukocyte removal filter to quantify any significant differences in contact activation, as assessed by the measurement of HK, LK, and TotK during the course of a standard platelet filtration procedure.
MATERIALS AND METHODS
Materials
Pall PXL8K leukocyte filters were obtained from Pall Biomedical Products Co (East Hills, NY). Filters from the following lots were used: lots no. 617802, 610405, and 619702 as well as set lots no. 621207 and 621407. Asahi PLS-5A leukocyte filters were obtained from Baxter Medical Corp (Deerfield Park, IL). Filters from the following lots were used: lots no. 442H34, A96D19090, A95L05035, and A95L21073. Carboxylate modified latex (0.8 μm) and Seradyn modified latex (0.8 μm) were generous gifts of Seradyn, Inc (a subsidiary of Mitsubishi Chemical Corp; Indianapolis, IN). Tween 20, leupeptin, benzamidine, EDTA, hexadimethrine bromide, sodium azide, soybean trypsin inhibitor, fluorescein isothiocyanate (FITC)-labeled sheep antimouse IgG (whole molecule), and sheep antimouse IgG F(ab′)2 were all purchased from Sigma Chemical Co (St Louis, MO). Phe-Phe-Arg-chloromethyl ketone (PPACK II) and [4-(2-aminoethyl)-benzenesulfonylfluoride, HCl] (AEBSF) were purchased from Calbiochem (La Jolla, CA). Sheep antihuman HK and sheep antihuman HK labeled with FITC were purchased from The Binding Site, Ltd (San Diego, CA).
Preparation of proteinase inhibitor cocktail (PIC).
Benzamidine (100 mmol/L), 400 μg/mL hexadimethrine bromide, 2 mg/mL soybean trypsin inhibitor (SBTI), 20 mmol/L EDTA, 263 μmol/L leupeptin, 20 mmol/L AEBSF, and 1 mmol/L PPACK II were dissolved in the anticoagulant, acid-citrate-dextrose (100 mmol/L trisodium citrate, 67 mmol/L citric acid, and 2% dextrose, pH 4.5), to make the PIC.15
Software used for data analysis.
Winplate, version 1.1 (Idexx Corp, Westbrook, ME), and Sigma Plot for Windows, versions 2.01 and 3.0 (Jandel Corp, Chicago, IL) were used. Sigma Stat for Windows, versions 1.0 and 2.0 (Jandel Corp), was used for the comparative analyses (paired t-test). A P value less than .05 was considered to be significant.
Methods
General principles for kininogen assays using particle concentration fluorescence immunoassay (PCFIA).
PCFIA was performed, in triplicate, in 96-well assay plates fitted with a 0.45-μm membrane. Microspheres were placed in each well followed by diluted reference plasma (ranging from 1:50 to 1:3,200).15The surrounding plasma from the platelet concentrates, after centrifugation to sediment the cells, were diluted 1:100 in PCFIA diluent (see above), and the same diluted sample was used for all 3 kininogen determinations. PCFIA diluent was used as the blank. After 20 minutes, 20 μL of tracer (composed of anti-HK labeled with FITC) was added and the mixture was incubated for an additional 20 minutes. The plate was then placed in a fluorescence concentration analyzer (FCA), where it was evacuated at 20 mm Hg and then washed twice, under vacuum, with 10 mmol/L sodium phosphate, pH 7.0, containing 0.5 mol/L NaCl and 0.02% NaN3 (wt/vol). The plate was read on the FCA and the data were analyzed by Winplate software using an IBM compatible 486DX-100 computer, equipped with Windows 95 software (Microsoft Corp, Redmond, WA). The curves were fitted by the Winplate software and the values for the triplicate determinations were automatically calculated from the standard curve. For HK, no antibody is used on the microspheres for capture, because we demonstrated that HK, and not LK, specifically adsorbs to the carboxylate-modified latex microsphere surface.15 LK is specifically attached to the microspheres via its unique light chain by a monoclonal antibody, LKL-1,16 which is covalently bound to specially modified microspheres.15 TotK, the sum of LK plus HK, is measured by the capture of LK and HK heavy chains by the monoclonal antibody, 2B5,17 covalently bound to specially modified microspheres.15 It is the capture that makes each of the kininogen determinations specific, because unbound proteins are completely removed during the washing phase.15 The same polyclonal detector antibody is then used to detect the kininogen that is bound to the microspheres. The calculated kininogen values from the Winplate software for HK, LK, and TotK were copied to Sigma Plot for Windows, where transforms were created to calculate HK plus LK, CKI (see below), and specific kininogen concentrations (see below).15 The interassay coefficients of variation (CV) for HK, LK, and TotK were 3.34%, 5.45%, and 3.47%, respectively, for a sample containing 1 U/mL kininogen (where 1 U is defined as the amount in 1 mL of normal, pooled plasma) and 5.23%, 6.59%, and 7.48%, respectively, for a sample containing 0.1 U/mL. The intraassay coefficients of variation were 4.79%, 5.49%, and 4.18% for HK, LK, and TotK, respectively, for a sample containing 1 U/mL kininogens and 3.76%, 1.69%, and 3.23%, respectively, for a sample containing 0.7 U/mL. Both activation and destructive cleavage of kininogens are easily detected by this assay method.15 HK, LK, and TotK in our normal pooled plasma was assayed against highly purified HK and LK.15
Determination of cleaved kininogen index (CKI).
To determine the CKI, the LK concentration (as measured by its light chain) was subtracted from the concentration determined for TotK (measured by the sum of the heavy chains of LK and HK), and this became the denominator in the equation. The numerator in the equation was HK that was measured by PCFIA (see above). The equation is listed below15: CKI = HK/(TotK − LK).
Determination of total protein.
Protein was determined with Coomassie Plus Protein Assay Reagent (Pierce Chemical Co, Rockford, IL). The samples were diluted 1:100 in phosphate-buffered saline (PBS)-Tween and the standard curve was constructed from bovine serum albumin.15
Samples for leukocyte filtration.
Twenty batches of single-donor platelet concentrates, from 2- to 4-day-old apheresis units, were divided and used for each side by side filtration using the Pall (filter A) or Asahi (filter B) filters. The apheresis units were obtained using Cobe Spectra and Fenwal CS3000 machines and then stored at 22°C with agitation. A 900 μL prefiltration sample (influent) was taken before each filtration, placed in a polypropylene tube containing 100 μL PIC (see the Materials and Methods), and set aside for processing. Influent leukocyte concentrations ranged from 0.5 to 1,000 white blood cells (WBC)/μL. Influent platelet concentrations ranged from 1.1 to 1.9 × 10⁶ platelets/μL. Typical bedside flow rates (7 to 10 mL/min) were maintained using a roller clamp for both filters. The WBC residuals and platelet recoveries for both filters were consistent with their respective manufacturers' claims. A sample was withdrawn after the first 5 mL passed through the filter (5 mL), and another sample was withdrawn after all of the platelet concentrate was filtered and combined (pool). All withdrawn samples (900 μL) were immediately placed into polypropylene microcentrifuge tubes containing 100 μL of PIC (see the Materials and Methods) to prevent subsequent activation of kininogen from occurring. All samples were then centrifuged at 10,000g for 15 minutes and the supernatants were harvested and centrifuged a second time under the same conditions. The second supernatant was then frozen at −70°C until the time of assay.
RESULTS
Assessment of HK After Filtration of Platelet Concentrates
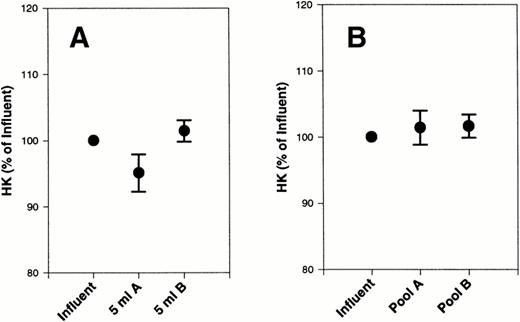
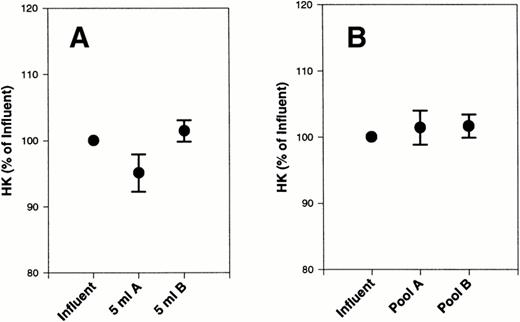
An initial sample was removed before filtration (influent). A second sample was removed after 5 mL of platelet concentrate passed through each filter (5 mL). The remainder of the material was collected into a bag and, after the remainder of the platelet concentrate passed through the filter, a sample was taken (pool). Influents, 5-mL samples and pools were all assayed for HK by PCFIA.15 The 5-mL samples as well as the pools were compared with the influents (Table 1). There was a slight decrease in HK after the first 5 mL was filtered on filter A that was not statistically different from the influent by paired t-test (Fig 1A). This decrease in HK after filtration on filter A returned to prefiltration levels by the end of the experiment (Table 1). There were no changes in HK during filtration through filter B. These data suggest that a small amount of HK may initially adsorb to filter A but desorbs by the end of the filtration. When each platelet concentrate was normalized to its baseline level, to correct for variation in initial HK concentration (Fig 1), the results were very similar to the data in Table 1.
Effect of filters A and B on HK from platelet concentrates. HK was measured in 20 platelet concentrates, subjected to filtration by filter A and filter B, and compared with the initial starting material (influent). The data are expressed as the percentage of initial HK. (A) The first 5 mL of filtrate collected. (B) The final pooled filtrate. Error bars are the ± SEM for the 5 mL and final samples.
Effect of filters A and B on HK from platelet concentrates. HK was measured in 20 platelet concentrates, subjected to filtration by filter A and filter B, and compared with the initial starting material (influent). The data are expressed as the percentage of initial HK. (A) The first 5 mL of filtrate collected. (B) The final pooled filtrate. Error bars are the ± SEM for the 5 mL and final samples.
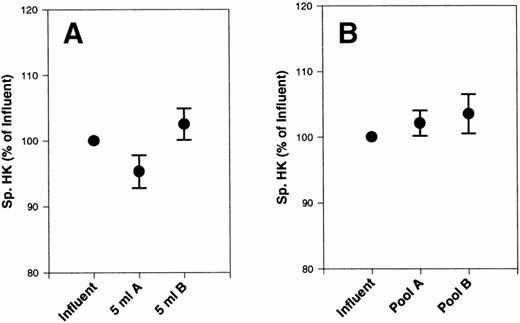
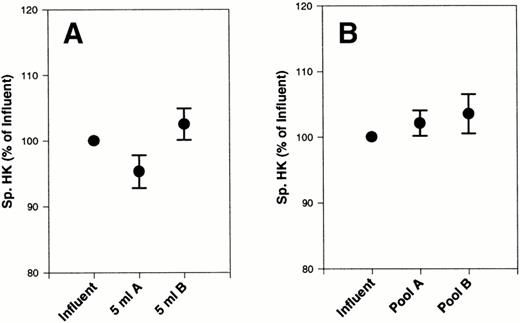
We then looked at the specific HK values (ie, HK divided by the total protein concentration) and found that they were all within the normal limits for plasma HK.15 It is, therefore, unlikely that a major contribution of platelet HK to the total HK found in the platelet-rich plasma had occurred. When we related specific HK to the influents, we observed a small (<5%) nonsignificant decrease in specific HK with filter A after 5 mL of filtration did not occur with filter B (Fig 2A). This value returned to the baseline value by the end of the experiment (Fig 2B).
Effect of filters A and B on specific HK from platelet concentrates. Specific HK was measured in 20 platelet concentrates, subjected to filtration by filter A and filter B, and compared with the initial starting material (influent). Total plasma protein was also measured in each sample. The data are expressed as the percentage of initial specific HK. (A) The first 5 mL of filtrate collected. (B) The final pooled filtrate. Error bars are the ± SEM for the 5 mL and final samples.
Effect of filters A and B on specific HK from platelet concentrates. Specific HK was measured in 20 platelet concentrates, subjected to filtration by filter A and filter B, and compared with the initial starting material (influent). Total plasma protein was also measured in each sample. The data are expressed as the percentage of initial specific HK. (A) The first 5 mL of filtrate collected. (B) The final pooled filtrate. Error bars are the ± SEM for the 5 mL and final samples.
Assessment of LK After Filtration of Platelet Concentrates
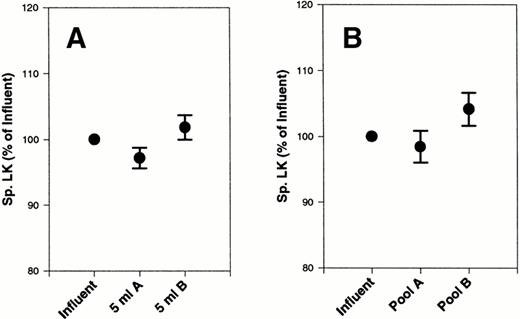
LK concentration in the samples was measured by PCFIA15(Table 2). There was a slight, nonsignificant decrease by paired t-test in LK concentrations with both filters A and B after the first 5 mL of the filtration process that returned to baseline by the end of the filtration process (Table 2). Specific LK values did not change significantly from the influent, although there was a slight decrease using filter A (Fig 3A). In contrast, there was a slight, nonsignificant increase in specific LK at the end of filtration using filter B (Fig 3B).
Effect of filters A and B on specific LK from platelet concentrates. Specific LK was measured in 20 platelet concentrates, subjected to filtration by filter A and filter B, and compared with the initial starting material (influent). Total plasma protein was also measured in each sample. The data are expressed as the percentage of initial specific LK. (A) The first 5 mL of filtrate collected. (B) The final pooled filtrate. Error bars are the ± SEM.
Effect of filters A and B on specific LK from platelet concentrates. Specific LK was measured in 20 platelet concentrates, subjected to filtration by filter A and filter B, and compared with the initial starting material (influent). Total plasma protein was also measured in each sample. The data are expressed as the percentage of initial specific LK. (A) The first 5 mL of filtrate collected. (B) The final pooled filtrate. Error bars are the ± SEM.
Assessment of TotK After Filtration of Platelet Concentrates
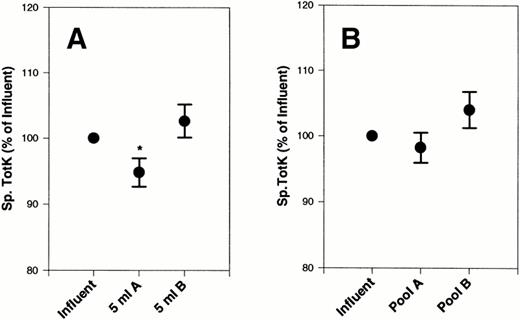
There were no significant differences in absolute TotK concentrations after filtration on filter A or B (data not shown). However, specific TotK measurements showed a slight, significant decrease (P < .05) after the first 5 mL of platelet concentrates was filtered with filter A that was not observed with filter B (Fig 4A). By the end of the filtration process, specific TotK returned to the prefiltration level (Fig 4B).
Effect of filters A and B on specific TotK from platelet concentrates. Specific TotK was measured in 20 platelet concentrates, subjected to filtration by filter A and filter B, and compared with the initial starting material (influent). Total plasma protein was also measured in each sample. The data are expressed as the percentage of initial specific TotK. (A) The first 5 mL of filtrate collected. (B) The final pooled filtrate. Error bars are the ± SEM.
Effect of filters A and B on specific TotK from platelet concentrates. Specific TotK was measured in 20 platelet concentrates, subjected to filtration by filter A and filter B, and compared with the initial starting material (influent). Total plasma protein was also measured in each sample. The data are expressed as the percentage of initial specific TotK. (A) The first 5 mL of filtrate collected. (B) The final pooled filtrate. Error bars are the ± SEM.
Effect of Filtration of Platelet Concentrates on the CKI
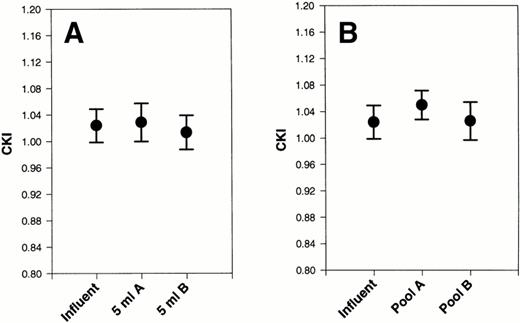
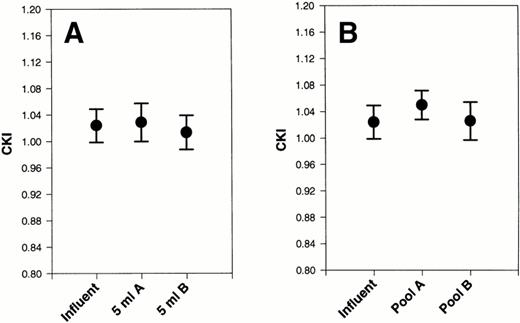
The combined heavy chains of HK and LK were measured so that we could calculate the CKI.15 A CKI equal to 1.0 indicates that HK and LK are totally intact.15 The CKI for each influent, 5-mL aliquot sample, and postfiltration sample was determined. We compared 5 mL aliquot values and the postfiltration samples to their respective influents and found no significant differences by pairedt-test with either the 5-mL samples (Fig 5A) or postfiltration samples (Fig 5B) when either filter A or filter B was used. There was a slight, nonsignificant increase in the CKI at the end of filtration by filter A. These data suggest that neither HK nor LK was significantly cleaved as a result of passage of platelet concentrates through either filter A or B.
Effect of filters A and B on CKI after filtration of platelet concentrates. The CKI was calculated after 20 platelet concentrates were subjected to filtration by filters A and filter B. They were compared with the CKI of each initial sample (influent). (A) The first 5 mL of filtrate collected. (B) The final pooled filtrate. Error bars are the ± SEM.
Effect of filters A and B on CKI after filtration of platelet concentrates. The CKI was calculated after 20 platelet concentrates were subjected to filtration by filters A and filter B. They were compared with the CKI of each initial sample (influent). (A) The first 5 mL of filtrate collected. (B) The final pooled filtrate. Error bars are the ± SEM.
DISCUSSION
The kallikrein-kinin system not only contributes the vasodilatory peptide, bradykinin, but also generates factor XIIa that cleaves the first component of the classical complement pathway,18resulting in its activation. Thus, it is clinically relevant to know if the kallikrein-kinin system becomes activated as a result of platelet concentrate filtration, as was recently reported.12-14,19Because HK is the contact system cofactor1 as well as the substrate for cleavage by both plasma kallikrein and factor XIIa, a small change in the concentration of HK can signify a substantial amount of contact system activation in addition to bradykinin release. Although it is true that there is a sensitive, direct enzyme immunoassay for bradykinin,20 it should be noted that bradykinin can be released and/or degraded in plasma simply due to handling and processing of the sample, particularly if appropriate proteinase inhibitors are not included. This manipulation can result in either spurious increases or decreases of the actual amount of bradykinin measured in the sample. In our study, we used a combination of kininogen determinations that can distinguish between intact and cleaved kininogens using samples that were immediately placed into proteinase inhibitor cocktail to prevent additional cleavage from occurring during the processing.15 We observed a slight, nonsignificant decrease in HK after the first 5 mL of platelet concentrates were filtered using filter A. The decrease in HK was not the result of activation because activation results in an apparent increase in HK concentration when measured by PCFIA and clotting.15 Therefore, it appears that some HK was initially adsorbed to the filter and later desorbed because, by the end of the filtration process, the HK level was similar to baseline values (Table 1). In contrast to HK, LK appeared to initially adsorb to both filters A and B (Table 2) after the first 5 mL was filtered. When the HK data were expressed as the percentage of the influent (Fig 1), a process that corrects for the initial variation of HK concentration in the platelet concentrates, the picture looked very similar to the data in Table 1.
The measurements of specific kininogens (ie, kininogen concentrations divided by total plasma protein concentrations in each sample) have proven to be the best assessment of the behavior of kininogens in systemic inflammatory response syndrome (SIRS) and polytrauma.21,22 In this study, calculation of specific kininogens allowed us to see subtle changes in kininogens that would have otherwise been missed. Whereas the decrease in HK and LK, after the first 5 mL of platelet concentrates was filtered, was not significant, the addition of the two kininogens, as assessed by the heavy chain assay (specific TotK), showed a slight, significant decrease with filter A (Fig 3). This decrease in high and low molecular weight kininogens returned to the baseline value by the end of the filtration. The CKI, a sensitive measurement of HK activation,15 was not significantly changed by filtration with either filter A or B, indicating that substantial cleavage of kininogens had not resulted (Fig 5). Because HK and/or LK must be cleaved to release bradykinin, we conclude that significant levels of bradykinin are not generated during filtration by either filter A or filter B. In addition, because the less than 4% decrease in specific HK and specific LK observed with filter A after 5 mL of platelet concentrates was filtered (Figs 2A and 3A) was not accompanied by a significant change in the CKI (Fig 5A), these data suggest that the HK and LK that initially adheres to filter A subsequently desorbs, primarily intact, after additional platelet concentrate passes through the filter. From these results we conclude that the kallikrein-kinin system is not substantially activated by either filter A or filter B.
It was recently suggested by Takahashi et al14,19 that, because filter A's surface has a net negative charge, it would increase the amount bradykinin generated via contact activation and, perhaps, cause the hypotensive reactions that are observed when some patients are transfused. However, in the samples examined in their previous study, the highest concentration of bradykinin released, at the half-way point of filtration, was 8,000 pg/mL,19 which amounts to only 0.1% of the total bradykinin in the sample that can be released via contact activation of HK. In our study, we observed no significant change in the CKI (Fig 5), which is sensitive to more than 5% of the total cleavage of HK and LK.15 Considering the amount of plasma typically in platelet concentrates (150 to 300 mL), there would be less than 6 to 12 μg bradykinin generated (40 to 80 ng/mL) if 5% of the bradykinin were released from the HK. Typically, platelet concentrates are infused at a rate of 7 to 10 mL/min. However, the clearance rate of bradykinin from the circulation is very rapid. Approximately 95% of the bradykinin is removed by a single passage through the lungs.23 If 6 to 12 μg bradykinin was infused as a bolus into a patient, it might cause hypotension in patients receiving ACE inhibitors. According to Bönner et al,24 approximately 3.5 μg bradykinin (50 ng/kg) was required to decrease the mean arterial pressure by 15 mm Hg in humans receiving ACE inhibitors, whereas that same concentration had no effect on mean arterial pressure in humans not receiving ACE inhibitors. However, the chances of such a high concentration of bradykinin being infused into a patient during a platelet concentrate transfusion are unlikely, because the concentrates are usually administered over a 30-minute period. Takahashi et al19 found a maximum of 200 pg/mL bradykinin at the end of the filtration process using filter A that translates to 60 ng bradykinin in 300 mL of platelet concentrate. Because of the limitation of our assay, we could have missed the low levels of bradykinin that were reported in Takahashi et al.19 However, the concentration of bradykinin reported by Takahashi et al19 was more than 50-fold less than the concentration needed to produce clinical hypotension in patients receiving ACE inhibitors.24 Shiba et al25 described a case of a patient with low ACE activity who received platelet concentrates filtered with filter A. Even though there was a small increase in bradykinin from 20 to 80 pg/mL, the patient did not become hypotensive or exhibit other adverse reactions.25 Shiba et al25 also state that they cannot conclude that the increased bradykinin levels are a major cause of hypotensive reactions, because severe, adverse reactions were also reported during platelet concentrate transfusions using non-negatively charged filters similar to filter B. In agreement with Shiba et al,25 we did not find significant changes in HK levels with either filter. However, Shiba et al25 also observed a decrease in prekallikrein and concluded that to be an indication of contact activation. Because the assay they used does not distinguish between prekallikrein and kallikrein, it is more likely that the decreased levels of prekallikrein they observed resulted from adsorption of the prekallikrein to the filter, rather than activation.25 If prekallikrein were actually activated to the extent reported in Shiba et al,25 they would have observed a great deal more bradykinin than what was reported. Because kallikrein is the enzyme in the reaction that releases bradykinin from HK, a few molecules of kallikrein would have been able to cleave many molecules of HK. Also, it is not surprising that filter A did not induce a great deal of contact activation, because the rate of contact activation is dependent on the surface area that the plasma contacts. The surface area of filter A is only 30.68 cm2, which is small when compared with the surface area of a membrane oxygenator (450 cm2) used in cardiopulmonary bypass.
Dextran sulfate has a strong negative charge and is a potent activator of the contact system.26 Infusion of dextran sulfate into rabbits produces acute hypotension.27 However, Wiggins et al27 demonstrated that the hypotension was not the result of contact activation and release of bradykinin (which did occur), but rather the hypotension was mediated by serotonin released from the platelets. Upon storage, platelets have been shown to release serotonin from their dense granules.28 In a recent report, Masayuki et al29 demonstrated increased bradykinin formation in red blood cell concentrates upon prolonged storage. After filtration of the red blood cell concentrates through negatively charged filters, they observed additional bradykinin.29 However, Masayuki et al29 point out that hypotensive reactions are rare in patients receiving red blood cell transfusions and conclude that bradykinin is not likely to be the main cause of hypotensive reactions. These data, in conjunction with the reports of Bönner et al24 and Takahashi et al,19 suggest that bradykinin, even if present in platelet concentrates, is not responsible for the hypotension that is associated with transfusion reactions. To date, there has been no direct correlation of the use of filter A and/or bradykinin concentrations with severe hypotension in patients experiencing transfusion reactions.
Transfusion reactions continue to be a moderate to serious complication for many patients receiving blood products, with the majority of these reactions occurring when platelet products are transfused.30 These reactions may include hypotension, fever, rigors, and, more seriously, anaphylaxis.31Filtration of platelet concentrates to remove leukocytes is practiced in many institutions to prevent transmission of cytomegalovirus (CMV),32 to remove HLA alloantigens,33 and to minimize immunosuppression.34 Muylle et al35 observed a correlation with febrile transfusion reactions and the concentrations of interleukin-6 (IL-6) and tumor necrosis factor α (TNFα) in the platelet concentrates. Stack and Snyder36 found that (day 1) leukofiltration of platelet concentrates drastically decreases the generation of IL-8 that normally accumulates during storage of platelet products, ostensibly due to the removal of cytokine-producing leukocytes. These reports suggest that patients transfused with platelets that are not leukodepleted before storage may receive substantial concentrations of IL-8 and other biological response modifiers (ie, TNFα and some fragments of complement) that can lead to febrile, nonhemolytic reactions.30 It is possible that these cytokines are also a major cause of severe hypotensive reactions during transfusion of platelet concentrates. In addition to the aforementioned mediators, histamine is another biological mediator of hypotension that is known to accumulate upon storage of platelet concentrates.37,38 In a blood bank environment, platelet concentrates are stored from 1 to 4 days before they are filtered and administered to patients. This practice of not leukodepleting platelets before storage allows mediators to be released from the leukocytes and most of these harmful mediators are not removed by leukocyte filters when used immediately before transfusion. In contrast, immediate filtration before storage dramatically decreases the concentration of cytokines in platelet concentrates that are released by monocytes.36 Even with this knowledge, the immediate filtration of platelets before storage is not a common practice. It is interesting to note that a benefit of using the negatively charged leukocyte removal filter is a reduction of harmful anaphylotoxins after platelet concentrates are filtered with filter A, as was reported by Shimizu et al.39 Careful clinical studies must be performed to correlate the incidence of transfusion reactions with various biological mediators such as cytokines, complement components, histamine, and serotonin in addition to bradykinin. Only then will questions be appropriately answered and solutions found for the ongoing problem of transfusion reactions.
ACKNOWLEDGMENT
The authors thank Dr Jingqiu Yao (Temple University School Of Medicine) for her excellent technical assistance and Dr Jay Herman (Director of Transfusion Medicine, Temple University School Of Medicine) and Dr Walter H. Dzik (Director of Transfusion Medicine, Deaconess Hospital of Harvard Medical School, Boston, MA) for their critique of this manuscript.
Support for this research was provided by National Institutes of Health Program Project No. HL 56914.
Address reprint requests to Robert W. Colman, MD, Temple University School of Medicine, The Sol Sherry Thrombosis Research Center, 3400 N Broad St 300A-OMS, Philadelphia, PA 19140; e-mail:colmanr@astro.temple.edu.
The publication costs of this article were defrayed in part by page charge payment. This article must therefore be hereby marked "advertisement" is accordance with 18 U.S.C. section 1734 solely to indicate this fact.
© 1998 by the American Society of Hematology.

