Abstract
Several studies have shown that interleukin-8 (IL-8) causes a rapid granulocytosis with the release of polymorphonuclear leukocytes (PMN) from the bone marrow (BM) partially responsible for the granulocytosis. This study was designed to quantitate the release of PMN from the BM by IL-8 and measure the transit time of PMN through the marrow after IL-8 administration. The thymidine analogue, 5'-bromo-2'-deoxyuridine (BrdU), was used to label dividing PMN in the marrow and follow their release into the circulation after intravenous IL-8. This allowed us to calculate the transit time of PMN through the mitotic and postmitotic pools of BM. BrdU was infused intravenously into rabbits 24 hours before IL-8 (2.5 μg/kg). IL-8 caused a rapid, transient granulocytopenia (5.9 ± 0.4 at baseline v 0.2 ± 0.06 × 10/9L at 5 minutes, P < .05) followed by granulocytosis (8.4 ± 0.1 at 30 minutes, P < .05) associated with an increased number (0.3 ± 0.1 at baseline v1.2 ± 0.6 × 10⁹/L at 30 minutes, P < .05) and percentage of band cells (P < .05), as well as a rapid increase in the number of BrdU-labeled PMN (PMNBrdU) in the circulation (0.09 ± 0.05 at baseline to 1.5 ± 0.6 × 10⁹/L at 60 minutes, P < .05). The transit time of PMN through both the mitotic and postmitotic pools of BM was not affected by IL-8. To determine the marrow compartment from which the PMN were mobilized by IL-8, we quantitated PMN movement from the hematopoietic and sinusoidal compartments into the circulation. The fraction of PMNBrdU in both compartments was higher than in the circulating blood (P < .05) and the fraction and number of PMNBrdU in the sinusoids decreased with IL-8 treatment (P < .05). We conclude that the pool of PMN residing in the BM venous sinusoids are rapidly released into the circulation after administration of IL-8.
© 1998 by The American Society of Hematology.
THE REGULATION of circulating neutrophil levels is an important feature of both the local and the systemic response to inflammatory stimuli.1,2 Circulating neutrophils can increase without increasing the total number of neutrophils in the vascular system by mobilizing the cells marginated along vessel walls.3 With increasing stress, neutrophils are mobilized from the bone marrow (BM), which increases their number in both the circulating and the marginated pools.4,5 During their maturation process in the BM, the polymorphonuclear leukocytes (PMN) increase their mobility, deformability, and chemotactic responsiveness.6,7 Because immature PMN are larger and less deformable than their mature counterparts,7,8 they preferentially sequester in lung microvessels where they may play a pivotal role in mediating inappropriate lung injury associated with infection and sepsis.4 9
Interleukin-8 (IL-8) is produced by a wide variety of cell types and functions as a potent and selective neutrophil chemoattractant and activator inducing directional migration, release of storage enzymes, and production of toxic metabolites in PMN.10,11 Recent studies have shown that during both experimentally induced inflammation and human clinical disease, IL-8 can be detected in plasma at concentrations of 1 to 8 ng/mL.12-14 In endotoxemia and after IL-1α administration, the increase of circulating IL-8 levels coincides with the resolution of early granulocytopenia.12 Several investigators have shown that intravenous (IV) administration of IL-8 induces a rapid granulocytopenia followed by granulocytosis.15-18 Demargination of PMN from within the vascular space may contribute to this granulocytosis, but these studies suggest that the release of PMN from the BM contributes to the transient granulocytosis induced by IL-8.15 17
The present study was designed to determine the effect of IV IL-8 administration on the BM by calculating the transit time of PMN through the mitotic and postmitotic marrow pools and by measuring the release of new PMN into the circulation.5 Changes in the BM hematopoietic tissue and venous sinusoids after IL-8 stimulation were also assessed using morphometric analysis.
MATERIALS AND METHODS
Experimental Animals
Adult female New Zealand White rabbits (n = 26; weight, 1.8 to 2.4 kg) were used in this study. All of the experiments were approved by the Animal Experimentation Committee of the University of British Columbia.
Experimental Protocols
Release of PMN from the BM.
Following a protocol that has previously been described in detail, 5′-bromo-2′-deoxyuridine (BrdU) (Sigma Chemical Co, St Louis, MO) was infused through the marginal ear vein at a concentration of 10 mg/mL in normal sterile saline solution over a period of 5 minutes to deliver a pulse dose of 100 mg/kg.5 The animals were then allowed to recover for 24 hours before they were anesthetized with ketamine hydrochloride (80 to 100 mg/kg intramuscular [IM]) and xylazine (10 to 15 mg/kg IM). Polyethylene tubing catheters of appropriate size were placed in the marginal ear vein, the right carotid artery, and the right jugular vein. Each catheter was connected through a three-way stopcock to a syringe containing heparinized saline. After a baseline sample was drawn, saline (n = 4) or rabbit recombinant IL-8 (a kind gift from Genentech Inc, San Francisco, CA) (n = 4) was administered IV as a rapid bolus (2.5 μg/kg) into the marginal ear vein. Blood samples were obtained simultaneously from the carotid artery and the jugular vein 3, 5, 15, 30, 60, 90, and 180 minutes after the IV IL-8 administration. After each blood sample, the catheter was flushed with an equal volume of heparinized saline.
Leukocyte Counts
Blood samples were analyzed as follows: 1 mL was collected in standard Vacutainer tubes containing potassium ethylene diamine tetra-acetic acid (Becton Dickinson, Rutherford, NJ) for blood cell counts, which were determined on a model SS80 Coulter Counter (Coulter Electronics, Hialeah, FL) and differential white blood cell (WBC) and band cell counts were done on Wright's stained blood smears; 1 mL samples were collected in acid-citrate-dextrose (ACD) for the preparation of leukocyte-rich plasma (LRP). Erythrocytes in the ACD blood samples were allowed to sediment for 25 to 30 minutes after the addition of an equal volume of 4% dextran (average molecular weight, 162,000) (Sigma) in PMN buffer (138 mmol/L NaCl, 27 mmol/L KCl, 8.1 mmol/L Na2HPO4 7H2O, 1.5 mmol/L KH2PO4, and 5.5 mmol/L glucose, pH 7.4). The resulting LRP was cytospun at 1,600 rpm for 4 minutes to obtain a monolayer of cells on slides coated with 3-aminopropryl-tri-ethoxysilane, which was used to determine the number of BrdU-labeled PMN (PMNBrdU) per 100 PMN counted in random fields of view.
Immunocytochemical Detection of PMNBrdU
A mouse monoclonal antibody against BrdU and the alkaline phosphatase antialkaline phosphatase (APAAP) method was used to stain for the presence of BrdU incorporated into the DNA of PMN in cytospins made of LRP as previously described.4 5 All slides were evaluated on a Zeiss Universal Research light microscope (Model IIR; Oberkochen, Germany) at 400× magnification.
Evaluation of PMNBrdU and Calculation of BM Transit Times
PMN with any nuclear stain were counted as BrdU-labeled. PMNBrdU were divided into three groups according to the intensity of nuclear staining using an arbitrarily designated grading system: weakly positive (staining of less than 5% of the nucleus: G1); moderate positive (staining of 5% to 80% of the nucleus: G2); and highly positive (staining of more than 80% of the nucleus: G3). This grading system was designed to evaluate the transit time of the myeloid cells that were in their last division in the mitotic pool when exposed to BrdU (highly positive or G3), those that were in the middle (moderately positive or G2), and those that were in their first division (weakly positive or G1).
Slides were coded and examined without knowledge of the group or the sampled time. Fields were selected in a systematic randomized fashion, and 100 cells were evaluated per specimen. All cells of interest in a selected field were evaluated, except if the cell was broken or overlapping. This method of evaluating PMNBrdU has a small intraobserver and interobserver variability and has previously been described in more detail.5
This method to calculate the transit time of PMN through the different pools in the marrow was derived from the work of Maloney and Patt19 who used tritiated thymidine to label dividing cells in the BM of dogs. It is based on the assumption that most of the mitotic cells in the BM incorporate BrdU into nuclear DNA over a short period and that the recirculation and reuse of BrdU is minimal.20 The assumption that the highly labeled PMN are myelocytes that incorporate BrdU during their last division and did not dilute it by subsequent divisions allowed us to calculate the transit time of this single generation of cells through the postmitotic or maturation pool. Similarly, by assuming that the weakest stained PMN represents myeloid cells where the BrdU was incorporated during their early division stages and diluted with subsequent divisions allowed the transit time of these cells through both the mitotic and postmitotic pools of the BM to be calculated. All of these transit times were corrected for the normal removal of PMN from the circulation.21
Transit time of PMN through the BM.
The transit time of PMN through the mitotic and postmitotic pools of the BM were measured using a technique that is fully described elsewhere.5 Briefly, BrdU was infused at a pulse dose of 100 mg/kg. Twenty-four hours later, a baseline sample was drawn from the central ear artery, and either saline (n = 4) or rabbit recombinant IL-8 (n = 5) was administered IV as a rapid bolus (2.5 μg/kg) into the marginal ear vein. Blood samples were obtained from the central ear artery at intervals from 6 to 168 hours after IL-8 administration, cytospins prepared from LRP, and used to calculate the transit times through the BM, as previously described.5
The transit time of PMN from the BM to the circulation was corrected for the disappearance (half-life, T1/2) of PMNBrdU in the circulation. In previous studies, we have reported that the T1/2 of PMNBrdU in rabbits is 270 minutes or 4.5 hours using a whole blood transfusion method.21 Therefore, this rate of exponential loss of PMNBrdU from the circulation was used to calculate the number of PMNBrdU released from the BM and the transit time through the different pools in the marrow in the following manner:
where: ΔN = number of labeled cells released from the marrow in the time interval Δt; ti, tj = the initial and successive time intervals; Δt = tj − ti; and k = In2/T1/2.
These calculations were made for each 6-hour interval and a histogram was drawn showing the distribution of PMNBrdU released from the BM during each 6-hour interval. The mean transit times for all PMNBrdU and the different populations of labeled PMN (G1, G2, and G3) were calculated individually for each animal and were compared among the groups.
Changes in BM compartments.
BrdU was infused at a pulse dose of 100 mg/kg 24 hours before IL-8 (n = 6) or saline (n = 3) administration as described above. The animals were anesthetized with ketamine hydrochloride (80 to 100 mg/kg IM) and xylazine (10 to 15 mg/kg IM), and polyethylene catheters (16G; Jelco I.V. catheters, Tampa, FL) were placed in the abdominal aorta and inferior vena cava. Both catheters were directed distally and clamped proximally to perfuse the lower limbs selectively. The animals were killed with an overdose of sodium pentobarbitone, after which the lower limbs of the animals were perfused through the arterial line with Krebs buffer (6.9 g/L NaCl, 0.35 g/L KCl, 0.29 g/L MgSO4•7H2O, 0.16 g/L KH2PO4, 2.1 g/L NaHCO3, 2.0 g/L glucose, 0.28 g/L CaCl2) from a reservoir with a 30 cm H2O perfusion pressure and drained from the venous line. Perfusion was continued until no more blood was visible in the solution draining from the venous catheter. The perfusate was replaced by 10% formalin to perfusion fix the BM (100 mL). Both femurs were removed and emerged in B5 fixative (60 g/L HgCl2, 12.5 g/L CH3COONa, 4% formalin) overnight. BM was harvested from the femurs by carefully removing the cortical bone of the femur and the BM tissue was embedded in glycolmethacrylate for histological analysis (see below).
BM samples were processed for histology by embedding them in glycolmethacrylate (GMA) using a modification of a method previously described for immunohistochemical analysis.22 The BM tissue was cut in 1- to 2-mm thick slices, washed well with phosphate-buffered saline (PBS), then dehydrated through graded alcohol from 30% to 100%. The specimens were then infiltrated overnight with GMA resin monomer (JB4; PolyScience, Ltd, Warrington, PA) containing 0.9% benzoyl peroxidase-solution A. The infiltrated tissue was placed in embedding molds and GMA chemically polymerized by a mixture of 200 mL of JB4 solution B to 5 mL of solution A (JB4; PolyScience, Ltd) for 1 hour. Polymerized resin blocks were brought to room temperature and 2-mm sections cut with a Sorval JB4 microtome fitted with a glass knife (made with an LKB Knife maker Type 7801, Stockholm, Sweden). Sections were floated on a room temperature water bath, transferred to glass slides, air dried overnight at 37°C, and stained with hematoxylin and eosin (H&E). These sections were used for the evaluation of the fraction of metamyelocytes, band cells, and segmented PMN in the BM.
Immunohistochemical Detection of PMNBrdU Cells
Immunohistochemical staining of plastic embedded sections of BM for the presence of BrdU was performed by the APAAP method. DNA in tissue was denatured in 1 N HCl at 60°C for 20 minutes, followed by washing with water and air drying. Slides were then immersed in xylene for 10 minutes, dried, and washed with water. BM tissue was then digested with 0.25 mg/mL protease type XIV at 37°C for 90 minutes, which was followed by neutralization in two washes of Tris buffered saline (TBS). After nonspecific binding sites were blocked by incubation with 5% normal rabbit serum for 15 minutes, the specimens were incubated with 10 μg/mL mouse anti-BrdU antibody (Dako, Glostrup, Denmark) prepared with 1% bovine serum albumin in TBS at 37°C in a humidified chamber for 1 hour. Nonspecific mouse IgG1 at 10 μg/mL was used as a negative control. Incubation in a 1:20 dilution of rabbit antimouse IgG (Dako) for 30 minutes was followed by 30 minutes in a 1:50 dilution of a mouse monoclonal APAAP complex (Dako). Slides were washed in 0.1% Tween 20 in TBS for 10 minutes after each antibody application. The alkaline phosphatase was developed as described above. The preparations were counterstained with Toluidine Blue O, dried, and mounted in an aqueous medium.
Evaluation of PMNBrdU in the BM
PMNBrdU in the BM were counted at 800× magnification using a Nikon Microphot-fx light microscope (Nikon, Tokyo, Japan) with Bioview, an image processing system (Infrascan Inc, Richmond, British Columbia, Canada). A minimum of 20 randomly selected fields were evaluated per slide and a minimum of 100 sinusoids per animal. In these fields of view, the total number and the percentage of PMNBrdU were counted both in the sinusoids and hematopoietic tissue. The volume fraction of venous sinusoids in the marrow was determined using a point counting technique23where random fields of view generated by a computer program and a 200-point counting grid superimposed on the microscope image allowed a calculation of total points falling on the different BM tissue. Assuming that the BM represents 4.5% of total body weight,24 the volume of venous sinusoids (Vs) was calculated as follows:
VS = BW × K × 0.045 × Volume fraction of venous sinusoid of marrow tissue where: BW = body weight and K = correction factor to change weight into volume.
These values were used to calculate the total number of PMNBrdU in the venous sinusoids:
where 143 fL is the volume of rabbit PMN fixed in paraformaldehyde.25
Statistical Analysis
All values are expressed as mean ± standard error of mean (SEM). Analysis of variance (ANOVA) was used for continuous data and to compare IL-8 and control groups. Bonferonni corrections were done for multiple comparisons. Student's paired t-test was used to compare the data between arterial and venous samples and P < .05 was accepted as statistically significant.
RESULTS
Release of PMN From the BM
Leukocyte counts.
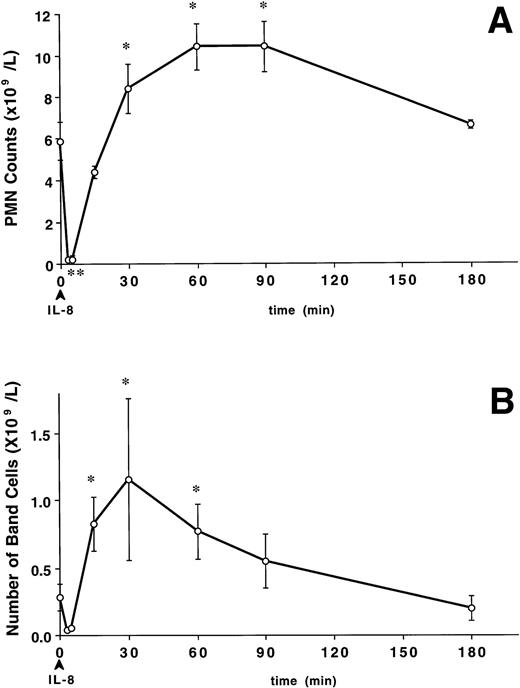
A bolus of IL-8 induced a rapid decline in circulating PMN numbers (Fig 1A) from the baseline value of 5.9 ± 0.4 to 0.2 ± 0.08 × 10⁹/L at 3 minutes and 0.2 ± 0.06 × 10⁹/L at 5 minutes (P < .05 v baseline). Circulating PMN numbers returned to baseline levels by 15 minutes, exceeded these levels by 30 minutes (8.4 ± 0.1 × 10⁹/L, P < .05 v baseline), remained elevated up to 90 minutes (P < .05), and returned to baseline by 180 minutes. The increase in circulating PMN counts was accompanied by an increase in band cells (Fig 1B). The number of band cells increased from 0.3 ± 0.1 × 10⁹/L at baseline to 0.8 ± 0.2 × 10⁹/L at 15 minutes and peaked at 1.2 ± 0.6 × 10⁹/L at 30 minutes (P < .05). The percentage of band cells change in a similar pattern (P < .05). The band cell counts did not change in the control group (data not shown).
The effect of IV IL-8 (2.5 μg/kg) on the circulating PMN and band cell counts. IL-8 induced a rapid decline in circulating PMN (A) that was significant at 3 to 5 minutes (*P < .05v baseline). Circulating PMN numbers returned to pretreatment levels by 15 minutes, exceeded these levels by 30 minutes (*P< .05 v baseline), remained elevated up to 90 minutes (*P < .05), and returned to baseline by 180 minutes. The increase in circulating PMN counts was accompanied by a similar increase in band cells (B). The number of band cells increased at 15 minutes, peaked at 30 minutes, and returned to baseline at 180 minutes after IL-8 (*P < .05 v baseline). Values are mean ± SEM (n = 4).
The effect of IV IL-8 (2.5 μg/kg) on the circulating PMN and band cell counts. IL-8 induced a rapid decline in circulating PMN (A) that was significant at 3 to 5 minutes (*P < .05v baseline). Circulating PMN numbers returned to pretreatment levels by 15 minutes, exceeded these levels by 30 minutes (*P< .05 v baseline), remained elevated up to 90 minutes (*P < .05), and returned to baseline by 180 minutes. The increase in circulating PMN counts was accompanied by a similar increase in band cells (B). The number of band cells increased at 15 minutes, peaked at 30 minutes, and returned to baseline at 180 minutes after IL-8 (*P < .05 v baseline). Values are mean ± SEM (n = 4).
Release of PMNBrdU into the circulation.
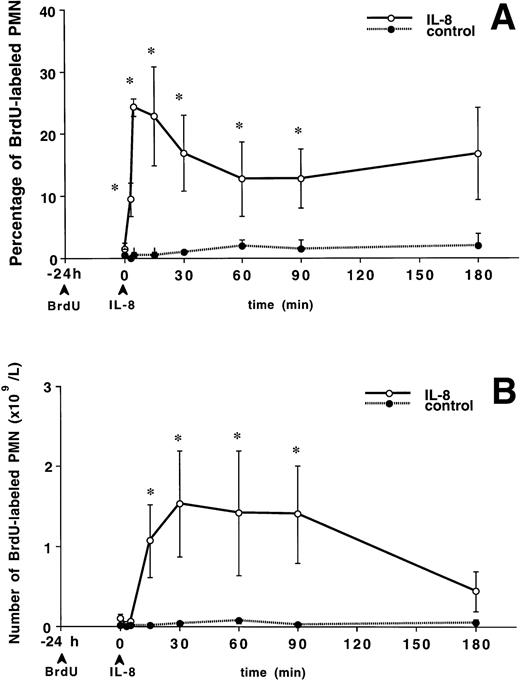
Figure 2A shows the percentage of PMNBrdU in the circulation after IL-8 administration. At time 0 (24 hours after BrdU labeling), the percentage of PMNBrdU in the circulation was less than 2% in both groups. A bolus of IV IL-8 induced a rapid increase in the percentage of PMNBrdU in the circulation, which was observable at 3 minutes. This increase peaked at 5 minutes and remained higher than baseline for up to 90 minutes (P < .05 v baseline). Figure 2B shows the absolute number of PMNBrdU in the circulation after IL-8 administration. This number increased and peaked at 60 minutes, then gradually declined until the values were similar to baseline at 180 minutes. The control group showed no change during the 180-minute period.
The release of PMNBrdU into the circulation after IV IL-8 (2.5 μg/kg) (n = 4) or saline (n = 4). BrdU was infused 24 hours before the IL-8 was administered. At time 0, the percentage of PMNBrdU in the circulation was less than 2% (A). IL-8 induced a rapid increase in the percentage of PMNBrdU in the circulation, which remained higher than the controls for 90 minutes (*P < .05 v control). (B) Shows the absolute number of PMNBrdU in the circulation. After IV IL-8, the number of circulating PMNBrdU increased and peaked at 60 minutes, then gradually declined to baseline levels at 180 minutes. The control group showed no change in either the percentage or the number of PMNBrdU during the 180-minute study period. Values are mean ± SEM.
The release of PMNBrdU into the circulation after IV IL-8 (2.5 μg/kg) (n = 4) or saline (n = 4). BrdU was infused 24 hours before the IL-8 was administered. At time 0, the percentage of PMNBrdU in the circulation was less than 2% (A). IL-8 induced a rapid increase in the percentage of PMNBrdU in the circulation, which remained higher than the controls for 90 minutes (*P < .05 v control). (B) Shows the absolute number of PMNBrdU in the circulation. After IV IL-8, the number of circulating PMNBrdU increased and peaked at 60 minutes, then gradually declined to baseline levels at 180 minutes. The control group showed no change in either the percentage or the number of PMNBrdU during the 180-minute study period. Values are mean ± SEM.
Sequestration of PMN in the lung after IL-8.
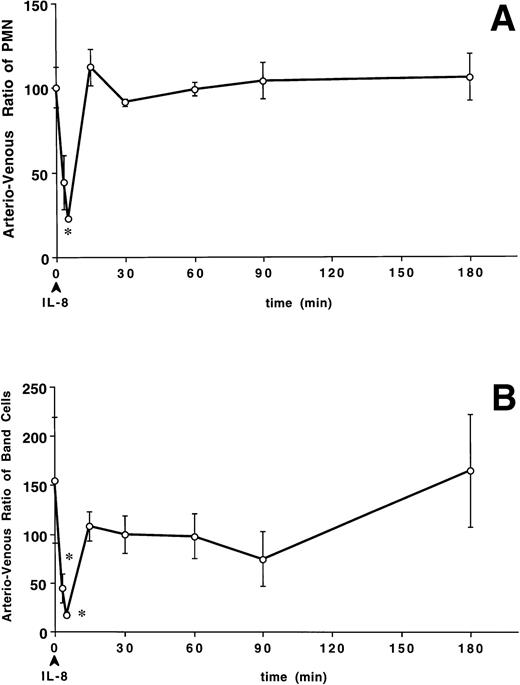
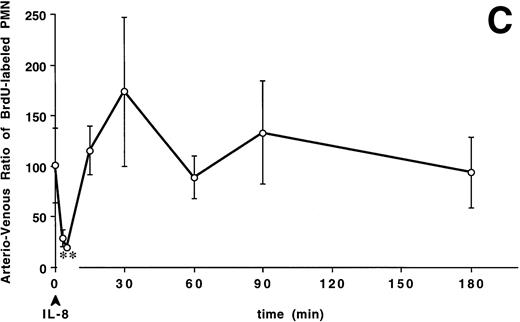
The number of PMN was lower in the arterial blood than in the venous blood 5 minutes (0.2 ± 0.06 v 1.0 ± 0.2 × 10⁹/L, P < .05) after IL-8. Figure 3A shows that the arterio-venous ratio of PMN, expressed as a percentage (arterial values divided by venous values times 100) was lower at 5 minutes than at baseline after IL-8 (22.5% ± 1.9% v 100.3% ± 12.0%, P < .05). The number of band cells was also lower in the arterial blood than in the venous blood at 5 minutes (0.1 ± 0.02 × 10⁹/L v 0.3 ± 0.01 × 10⁹/L,P < .05). Figure 3B shows the arterio-venous ratio of the band cells across the lung with a decreased ratio from a baseline value of 154.9% ± 64.2% to 44.7% ± 15.2% at 3 minutes and 17.4% ± 3.3% at 5 minutes (P < .05). The number of PMNBrdU was lower in the arterial blood than in the venous blood at 5 minutes (0.019 ± 0.002 v 0.27 ± 0.1 × 10⁹/L, P < .05). Figure 3C shows that the arterio-venous ratio of PMNBrdU across the lung decreased from a baseline value of 100.8% ± 37.1% to 28.9% ± 8.4% at 3 minutes and 19.2% ± 2.4% at 5 minutes. These results show a transient arterio-venous gradient of PMN, band cells, and PMNBrdU across the lung with the granulocytopenia induced by IL-8. These arterio-venous (A-V) gradients returned to baseline values within 15 minutes and remained unchanged during the granulocytosis.
The arterio-venous difference in PMN (A), band cell (B), and PMNBrdU counts (C) after IV IL-8 (2.5 μg/kg) (n = 4). Values are the ratio of arterio-venous counts and are expressed as a percentage (see text for formula). These ratios were lower than baseline values at 3 minutes for PMN and 3 and 5 minutes for band cell and PMNBrdU after IL-8 administration. *P < .05v baseline. Values are mean ± SEM.
The arterio-venous difference in PMN (A), band cell (B), and PMNBrdU counts (C) after IV IL-8 (2.5 μg/kg) (n = 4). Values are the ratio of arterio-venous counts and are expressed as a percentage (see text for formula). These ratios were lower than baseline values at 3 minutes for PMN and 3 and 5 minutes for band cell and PMNBrdU after IL-8 administration. *P < .05v baseline. Values are mean ± SEM.
Transit Time of PMNBrdU Through the BM
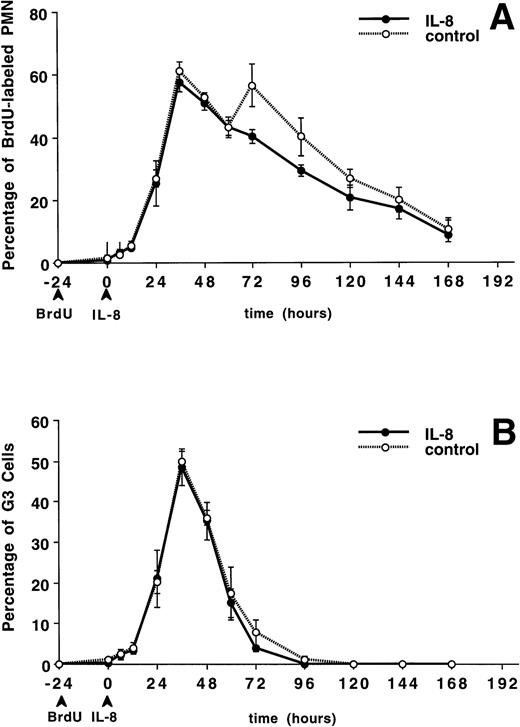
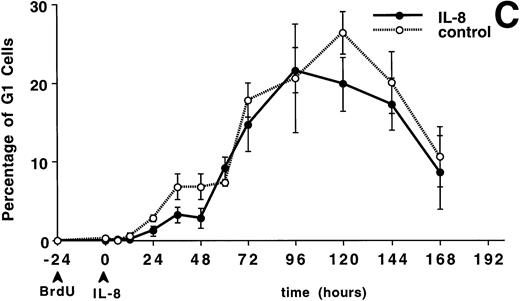
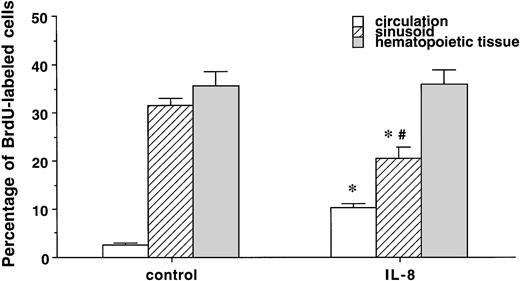
The circulating PMN or band cell counts did not change significantly from baseline in either the IL-8 or control groups (data not shown). Figure 4A shows the percentage of PMNBrdU in the circulation for 7 days after IL-8 administration. A slow increase in the percentage of PMNBrdU was seen between 0 and 12 hours followed by a rapid increase to peak levels between 36 and 48 hours, then a slow decline was seen over the next 5 days. This was not different from the control group (P = not significant). The G3 cells (representing the transit time through the postmitotic pool of the BM) peaked at 36 hours (Fig 4B) and G1 cells (represented the total transit time ) peaked between 96 and 120 hours (Fig 4C). There was no difference between the IL-8– and saline-treated animals.
The appearance and disappearance of PMNBrdUin the circulation after IV IL-8 (2.5 μg/kg) (n = 5) or saline (n = 4). (A) Shows all the PMNBrdU. In both groups there was a slow increase between 0 and 12 hours followed by a rapid increase to peak levels between 36 and 48 hours and then a slow decline over the following 5 days. G3 cells (representing the transit time through the postmitotic pool) peaked at 36 hours (B) and G1 cells (representing the transit time through both the mitotic and postmitotic pools) peaked between 96 and 120 hours in both group (C). No differences were apparent between groups. Values are mean ± SEM.
The appearance and disappearance of PMNBrdUin the circulation after IV IL-8 (2.5 μg/kg) (n = 5) or saline (n = 4). (A) Shows all the PMNBrdU. In both groups there was a slow increase between 0 and 12 hours followed by a rapid increase to peak levels between 36 and 48 hours and then a slow decline over the following 5 days. G3 cells (representing the transit time through the postmitotic pool) peaked at 36 hours (B) and G1 cells (representing the transit time through both the mitotic and postmitotic pools) peaked between 96 and 120 hours in both group (C). No differences were apparent between groups. Values are mean ± SEM.
Based on the assumptions outlined in Materials and Methods and fully discussed elsewhere,16 the calculated mean transit time of all PMNBrdU through the BM was 97.2 ± 2.5 hours in the IL-8 group and 98.1 ± 1.2 hours in the control group. Table 1 summarizes the data and shows that the mean transit time through the postmitotic pool was 60.7 ± 1.4 hours and through the entire pool was 125.5 ± 1.9 hours in the control group. The difference between these two values (G1-G3, 64.8 ± 2.9 hours) represents the transit time through the mitotic pool. Therefore, IL-8 did not change the PMN transit time through either the mitotic or the postmitotic pools of the BM.
Changes in BM Compartments
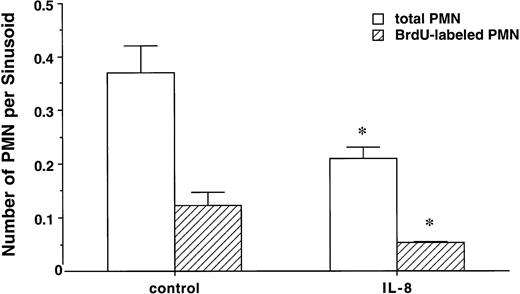
IL-8 did not change the differential leukocyte counts in the postmitotic pool in the BM (metamyelocyte; 31.7% ± 4.2% v 27.5% ± 1.8%, band cells; 37.3% ± 2.6%v 43.2% ± 1.8%, and segmented PMN; 31% ± 1.7%v 28.8% ± 2.1%, control v IL-8 group). IL-8 also did not affect the percentage of BrdU-labeled segmented or band cells in the hematopoietic tissue in the BM (data not shown). Figure 5 compares the percentage of BrdU-labeled cells in the peripheral blood, marrow sinusoids, and hematopoietic tissue. In the control group, there was no difference in the percentage of PMNBrdU between the venous sinusoids and the hematopoietic tissue (P < .5), but values in both of these compartments were higher than in the circulating blood (P< .05). IL-8 increased the percentage of PMNBrdU in the circulating blood (P < .05) and decreased the value in the venous sinusoids (P < .05) with no change in the hematopoietic compartment. This increased the gradient of PMNBrdU between the hematopoietic tissue and venous sinusoids (P < .05) in the IL-8 group. Figure 6 shows that IL-8 also decreased the total number of PMN and the PMNBrdU in the marrow sinusoids (P < .05).
The percentage of PMNBrdU in the circulation, sinusoids, and hematopoietic tissue in the BM 60 minutes after IL-8 (n = 6) or saline (n = 3). The percentage of PMNBrdU was higher in the hematopoietic tissue and venous sinusoids than in the circulating blood in both the IL-8 and control groups. IL-8 caused an increase in PMNBrdU in the circulating blood (P < .05) and a decrease in the PMNBrdU venous sinusoids (P < .05). Compared with the hematopoietic tissue, the percentage of PMNBrdU in the sinusoids was lower in the IL-8 group (P < .05), but not in the controls. Values are mean ± SEM. *P < .05 control versus IL-8 group, #P < .05 hematopoietic tissue versus sinusoids in the IL-8 group.
The percentage of PMNBrdU in the circulation, sinusoids, and hematopoietic tissue in the BM 60 minutes after IL-8 (n = 6) or saline (n = 3). The percentage of PMNBrdU was higher in the hematopoietic tissue and venous sinusoids than in the circulating blood in both the IL-8 and control groups. IL-8 caused an increase in PMNBrdU in the circulating blood (P < .05) and a decrease in the PMNBrdU venous sinusoids (P < .05). Compared with the hematopoietic tissue, the percentage of PMNBrdU in the sinusoids was lower in the IL-8 group (P < .05), but not in the controls. Values are mean ± SEM. *P < .05 control versus IL-8 group, #P < .05 hematopoietic tissue versus sinusoids in the IL-8 group.
The total number of PMN and the PMNBrdU in the venous sinusoids 60 minutes after IL-8 (n = 6) or saline (n = 3). Values are expressed as the number of PMN per sinusoid. IL-8 decreased total number of PMN and PMNBrdU in the sinusoids compared with controls (P < .05). Values are mean ± SEM. *P < .05 control versus IL-8 groups.
The total number of PMN and the PMNBrdU in the venous sinusoids 60 minutes after IL-8 (n = 6) or saline (n = 3). Values are expressed as the number of PMN per sinusoid. IL-8 decreased total number of PMN and PMNBrdU in the sinusoids compared with controls (P < .05). Values are mean ± SEM. *P < .05 control versus IL-8 groups.
The total number of PMN and PMNBrdU calculated in the venous sinusoids was lower in the IL-8 group than in the control group (Table 2, see Materials and Methods for calculation). Assuming that the number of PMNBrdU in the sinusoids in the control group represents a baseline value, it follows that IL-8 released 57.5 × 10⁶ PMNBrdUfrom the venous sinusoids. Using a total blood volume of 56.4 mL/kg in rabbits,24 the number of PMNBrdU in the circulation 60 minutes after IL-8 administration was 80.8 ± 19.4 × 10⁶ compared with 13.2. ± 0.9 × 10⁶ in the control group. Assuming that 50% of the PMNBrdU that are released into the general circulation marginate along vessel walls,25 the calculated number of PMNBrdU added to the intravascular pool by IL-8 treatment was 135.2 × 10⁶, which is ≈2 times the calculated number released from the venous sinusoids.
DISCUSSION
The results of this study confirm that intravenous IL-8 causes a transient neutropenia followed by a neutrophilia. The neutropenia was associated with an arterio-venous difference of PMN across the lung, which suggests sequestration of cells in the lung. During the neutrophilia, there was no A-V difference of PMN across the lungs consistent with release of PMN from marginated pool in the lung into the circulation. The neutrophilia was associated with rapid release of both segmented and band cells from the BM. IL-8 released PMN from the BM without changing their transit time through either the mitotic or the postmitotic marrow pools. The quantitative histologic studies of the marrow showed that the majority of PMN that are released from the marrow after IL-8 administration come from a pool in the venous sinusoids of the BM.
Several investigators have reported that IV IL-8 induces a granulocytopenia followed by a granulocytosis.15-18 Ley et al18 suggested that this granulocytosis results from demargination rather than BM release because there was no consistent increase in circulating nonsegmented PMN (band cells) in rabbits receiving human recombinant IL-8 (hrIL-8). Van Zee et al16reported similar results in baboons receiving hrIL-8. Studies from our26 and other laboratories27 28 have shown that the lung is the major site of PMN margination in rabbits. However, in the present study, we were unable to show an arterio-venous difference consistent with the release from the pulmonary circulation during the granulocytosis phase of the IL-8 response. This suggests that the PMN leave the lung at the same rate as they enter it during the granulocytosis phase.
Hechtman et al15 showed that IL-8 induced a granulocytosis with an increase in band cells in rabbits, which was supported by studies from Jagels and Hugli,17 suggesting a significant release of PMN from BM stores. The results of our study provide several lines of evidence that IL-8 stimulates the BM to release PMN into the circulation. There was a rapid increase in the number of PMN in the circulation 30 minutes after IL-8 administration (Fig 1A). This increase was accompanied by an increase in the number and percentage of band cells, which provides definitive evidence for the BM release of PMN (Fig 1B). There was also a rapid increase in the number and the fraction of PMNBrdU in the circulation, which confirms that these cells come from the BM (Fig 2A and B).
Interestingly, Laterveer et al29,30 have demonstrated a rapid mobilization of hematopoietic progenitor cells into the circulation of monkeys29 and mice30 after a single dose of IV IL-8. They reported that the maximum circulating level of progenitors was 30 minutes after the IL-8, which corresponds to the peak release of granulocytes in our study. Our results show that granulocyte release from the BM venous sinusoids accounts for approximately 50% of the IL-8–induced granulocytosis. Furthermore, IL-8 also did not change the transit time of PMN through the mitotic or postmitotic pools in the marrow (Fig 4). Taken together, these results suggest the presence of a pool of hematopoietic progenitors in the BM sinusoids available for immediate mobilization into the circulation with IL-8.
The effect of IL-8 on the BM was transient in that circulating PMN, band cell, and PMNBrdU counts returned to baseline levels by 6 hours. Interestingly, there was no change in the calculated transit time of PMN through either the mitotic or the postmitotic pools in the BM (Fig 4A through C). However, IL-8 did decrease the number of BrdU-labeled cells in the marrow sinusoids and increase the gradient in BrdU-labeled cells from the hematopoietic tissue to the sinusoids. These results suggest that IL-8 mobilizes PMN out of the BM venous sinusoids, which could increase the traffic of PMN from the hematopoietic tissue into the sinusoidal compartment.
In the control group, the fraction of PMNBrdU in the sinusoids was similar to the fraction in the hematopoietic tissues and higher than those in the circulation (Fig 5), suggesting the presence of a pool of PMN in the venous sinusoids that does not circulate. We postulate that these cells remain attached to the sinusoidal endothelium after migration from the hematopoietic compartment and that IL-8 reduces this attachment to release them into the circulation. We calculate that ≈50% of the PMNBrdU released into the circulation by IL-8 come from a pool located in the marrow sinusoids and the rest are transferred from the hematopoietic tissue into the sinusoids and then into the peripheral blood. The mechanism(s) responsible for this preferential release of PMN from the sinusoids by IL-8 is not known. We have previously shown that the surface expression of the adhesion molecule, L-selectin, on PMN decreases when these cells translocate from the BM to the circulation22 and speculate that L-selectin is involved in keeping PMN attached to sinusoidal endothelial. Circulating stimuli, such as IL-8, could influence this adhesive interaction by shedding L-selectin and release PMN into the circulation.
Factors capable of stimulating the BM to release PMN include granulocyte colony-stimulating factor (G-CSF), granulocyte-macrophage colony-stimulating factor (GM-CSF), IL-1, and IL-3.31,32G-CSF is known to shorten the PMN transit time through the mitotic and postmitotic pools in the marrow.33 Van Zee et al16 have shown that IV IL-8 infusions were not associated with the appearance of other cytokines such as IL-1β, TNF-α, or IL-6 in the plasma,34 suggesting that IL-8 has a direct effect on the BM rather than an indirect effect via other inflammatory mediators. Furthermore, the relatively late appearance of IL-8 in the circulation during endotoxemia and sepsis12 suggests that IL-1 and TNF-α may induce the biosynthesis of IL-8, which contributes to the leukocytosis seen during sepsis.
The short-lived neutropenia induced by IL-8 was accompanied by a transient arterio-venous gradient of PMN, band cells, and PMNBrdU across the lung, suggesting sequestration in the pulmonary microvessels. PMN activation decreases cell deformability, which has been shown to be the principal factor responsible for their sequestration in lung microvessels.35 The short half-life (± 8 minutes) of IL-8 in the circulation suggests that this effect should be brief and reversible.16
The neutrophilia that followed the IL-8–induced neutropenia was not associated with an arterio-venous gradient of newly released PMN (band cells and PMNBrdU) across the lung (Fig 3B and C). Lichtman and Weed7 have shown that PMN harvested from the postmitotic pool in the marrow are larger and less deformable than their counterparts in the circulation. These physical characteristics make immature PMN more prone to sequester in the lung microvessels because of the size discrepancy between PMN and pulmonary capillaries.25 Studies from our laboratory have shown that PMN released from the marrow during pneumococcal pneumonia4and endotoxemia9 preferentially sequester in lung microvessels. The absence of an A-V difference during the neutrophilic period in this study suggests that the cells released from the marrow by IL-8 behave like fully mature circulating PMN.
In summary, the data presented here show that IV IL-8 stimulates the BM to release PMN without affecting PMN transit time through either the mitotic or the postmitotic marrow pools. The data also demonstrate the presence of a pool of PMN in BM sinusoids that are rapidly mobilized into the circulation after intravenous IL-8 administration. We speculate that PMN are attached to the sinusoidal endothelium after migration from the hematopoietic tissues and that this PMN-endothelial interaction is reduced when PMN are mobilized from the marrow sinusoids by IL-8 into the peripheral blood. These observations extend the previously defined functions of IL-8 and provide insight into how this molecule acts to release PMN from the marrow.
ACKNOWLEDGMENT
We thank Genentech Inc for supplying the recombinant rabbit IL-8, Jenny Hards for helping with the immunohistochemistry, Lorri Verburght for doing the statistical analysis, Stuart Greene for photography, and Heather Hogg for reviewing the manuscript.
Supported by Grant No.MRC 4219 from the Medical Research Council of Canada (Ottawa, Ontario) and by the B.C. Lung Association (Vancouver, B.C.).
Address reprint requests to Stephan F. van Eeden, MD, UBC Pulmonary Research Laboratory, St. Paul's Hospital, 1081 Burrard St, Vancouver, B.C. V6Z 1Y6; e-mail: svaneeden@prl.pulmonary.ubc.ca.
The publication costs of this article were defrayed in part by page charge payment. This article must therefore be hereby marked "advertisement" is accordance with 18 U.S.C. section 1734 solely to indicate this fact.

