Abstract
Despite the established utility of serum transferrin receptor (sTfR), serum ferritin, and the sTfR/log ferritin ratio (TfR-F Index) in the diagnosis of iron deficiency (ID) anemia, the numeric values of these parameters, which are indicative of subclinical ID, remain to be clearly defined. In this study, 65 apparently healthy nonanemic adults (22 men and 43 women) were treated with 3 months of oral iron supplementation to evaluate its effect on parameters reflecting iron status and to determine the prevalence of subclinical iron deficiency in apparently healthy adults. Significant supplementation-induced changes were observed in sTfR, ferritin, and TfR-F Index values in women, whereas in men, none of the studied parameters showed any significant change. Iron-deficient erythropoiesis (IDE) was not observed in men, but was found in 17 women (40%). Although individuals with a compromised iron status may be represented in substantial numbers in conventional reference populations, they can be readily identified using sTfR, ferritin, and TfR-F Index determinations.
© 1998 by The American Society of Hematology.
IRON DEFICIENCY (ID) is generally acknowledged to be the single most common nutritional deficiency worldwide. In developed countries, the prevalence of iron deficiency anemia (IDA) has decreased rapidly during the past few decades, whereas the prevalence of subclinical ID has remained substantial.1-3 Subclinical ID is especially common in children aged 1 to 3 years, in adolescents of both sexes, in women of childbearing age, and in the elderly population.4-8 Because current methods permit the accurate diagnosis of uncomplicated IDA, the focus of clinical interest has shifted to the detection of subclinical ID and to the distinction of ID from other entities in the differential diagnosis of anemia.9
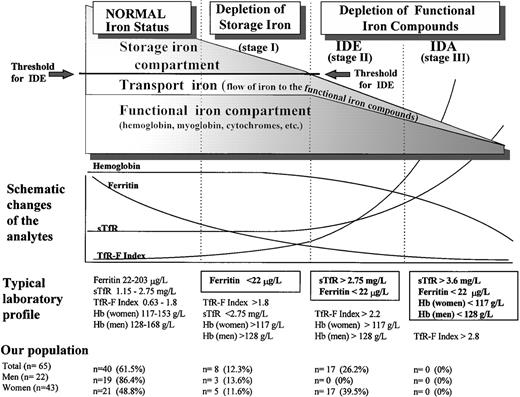
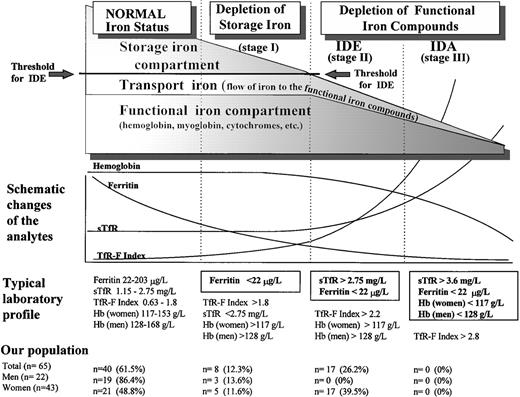
Both serum ferritin and serum transferrin receptor (sTfR) are known to undergo a characteristic sequence of changes, as body iron stores decrease from normal iron-replete levels to those found in IDA (Fig 1).10-13 During the depletion phase (stage I), in which sTfR concentration remains stable, there is a progressive decrease in serum ferritin. When the storage deficit is sufficient to restrict the synthesis of hemoglobin and other functional iron compounds, iron-deficient erythropoiesis (IDE) ensues (stage II). The only indicator of early IDE is the compensatorily elevated sTfR concentration.14 15 Finally, IDA (stage III) develops as the hemoglobin (Hb) concentration falls below the lower limit of normal as a result of progressive depletion of the functional iron compartment.
Phases of advancing ID. The gradual diminution of the different iron compartments and the concomitant changes seen in the laboratory analytes are presented schematically in relation to the separate stages of advancing ID. Typical laboratory findings are displayed separately for each stage, and the normal values of sTfR, ferritin, and sTfR/log ferritin (TfR-F Index) are presented as 95% reference intervals obtained from our study population of apparently healthy adults after 3 months of oral iron supplementation. Normal Hb concentrations are the reference values currently applied at the Turku University Central Hospital (TUCH). The criteria used to define the different stages of ID appear boxed. The prevalences of the different subgroups with various degrees of ID in our study population before the supplementation are presented as determined by these criteria.
Phases of advancing ID. The gradual diminution of the different iron compartments and the concomitant changes seen in the laboratory analytes are presented schematically in relation to the separate stages of advancing ID. Typical laboratory findings are displayed separately for each stage, and the normal values of sTfR, ferritin, and sTfR/log ferritin (TfR-F Index) are presented as 95% reference intervals obtained from our study population of apparently healthy adults after 3 months of oral iron supplementation. Normal Hb concentrations are the reference values currently applied at the Turku University Central Hospital (TUCH). The criteria used to define the different stages of ID appear boxed. The prevalences of the different subgroups with various degrees of ID in our study population before the supplementation are presented as determined by these criteria.
Establishing reliable reference values for ferritin and sTfR to study subclinical ID has been challenging because of the strict concepts of conventional reference values and because reference limits have generally been designed to distinguish nonanemic subjects from patients with IDA.16-22 Furthermore, definite exclusion of subclinical ID from reference populations has rarely been achieved by methods other than bone marrow sampling or iron supplementation trials.23,24 To fully exploit the obvious potentials of ferritin and sTfR assays in diagnosis of subclinical ID, their dynamic properties need to be examined over a wide range of iron status. Additionally, because serum ferritin reflects the storage iron compartment and sTfR reflects the functional iron compartment, these two values can be combined into a ratio, which is reciprocally regulated. The special value of sTfR/ferritin ratio and the sTfR/log ferritin index (TfR-F Index) in the differential diagnosis of IDA has already been documented.14,16-18 25 Reanalysis of the reference values for ferritin and sTfR would enable this derivative to be used more accurately in definition of the entire range of body iron stores.
We evaluated the effect of 3 months of oral iron supplementation on the iron status of healthy nonanemic subjects as reflected by serum transferrin receptor, serum ferritin, serum transferrin, serum iron, and transferrin saturation levels. Subgroups with iron depletion were identified in this population by using sTfR, ferritin, and the sTfR/log ferritin ratio measurements. The results of this study define values of sTfR and the sTfR-F Index useful in detecting subclinical ID.
MATERIALS AND METHODS
Subjects.
The protocol of this study was approved by the Joint Committee of Ethics of the Turku University Central Hospital and the University of Turku. Seventy-five apparently healthy volunteers (25 men and 50 women; age range, 22 to 60 years) received 3 months of oral iron supplementation with daily administration of 100 mg of elemental iron as ferrous sulfate. Of the 75 individuals starting the supplementation treatment, 3 men and 6 women (12.0%) withdrew from the trial prematurely because of adverse gastrointestinal effects. One of the female volunteers was found to be anemic (Hb, 113 g/L) and was subsequently excluded from the trial. The exclusion criteria used were the Hb concentrations used to define anemia in our hospital (128 g/L for men and 117 g/L for women). Therefore, a total of 65 subjects (22 men and 43 women) succesfully completed the trial. Of these 43 women, 3 were postmenopausal.
Study design.
The iron status of the subjects was assessed at onset of the study (sample A) by assaying a venous blood sample for Hb, hematocrit, mean corpuscular hemoglobin, mean corpuscular volume, erythrocyte count, reticulocyte count, serum ferritin, serum iron, serum transferrin, and serum transferrin receptor (sTfR). The sTfR/log ferritin ratio (TfR-F Index) and transferrin saturation levels were also determined. Similar tests were also performed weeks after the discontinuation of supplementation (sample B), a total of 14 weeks after its initiation. None of the subjects had regularly used iron supplements, and none had dietary restrictions. The effect of a possible concomitant infection was excluded in all of the subjects by assessing the white blood cell count, erythrocyte sedimentation rate, and C-reactive protein both before and after supplementation.
Diagnostic testing.
Blood counts were measured using an automated analyzer (Technicon H*2; Technicon Instruments Corp, Tarrytown, NY). Serum transferrin receptor assays were performed with a commercial kit using a monoclonal antibody in a sandwich immunoezymometric assay (IEMA) format (IDeA; Orion Diagnostica, Turku, Finland). The method has been described in detail elsewhere.24 Serum ferritin (the reference range at our hospital: 20 to 240 μg/L for men, 10 to 100 μg/L for women) was measured using an automated time-resolved immunofluorometric assay (Autodelfia, Wallac, Turku, Finland). Serum transferrin (reference range, 1.75 to 3.13 g/L) was measured using a Behring Nephelometer (Behringwerke AG, Marburg, Germany) together with antibodies obtained from Dakopatts (Dakopatts, Glostrup, Denmark). The method was calibrated using the IFCC calibrator (BCR CRM No. 470; Community Bureau of Reference, Commission of the European Communities, Brussels, Belgium). Serum iron (reference range, 10 to 40 μmol/L) was measured using an Iron FZ assay (Hoffman-LaRoche, Basel, Switzerland) based on a guanidine hydrochloride/Ferrozine reaction. Transferrin saturation was calculated as described by Huebers and Finch.26
Statistical analyses.
The 95% reference intervals for the various parameters as well as the 90% confidence intervals for the respective reference limits were calculated using the GraphROC for Windows software package (Veli Kairisto, Department of Clinical Chemistry, Turku University Central Hospital, Turku, Finland).27 The distribution scattergram was visualized using Fig P Software (Fig P Software, Durham, NC). All P values were calculated by Student’st-test using the Microsoft Windows for Workgroups software package (Microsoft Corp, Redmond, WA).
RESULTS
In the group of women, 3 months of supplementation with ferrous sulfate produced a highly significant change in sTfR, ferritin, and TfR-F Index. There was only a modest, but statistically significant, change in serum iron (data not shown) and transferrin saturation (Table 1). In the group of men, the parameters reflecting iron status were not significantly altered. Changes in the sTfR and the TfR-F Index mainly occurred in subjects in which these values were elevated in the samples taken before supplementation. Changes in ferritin were more variable, also occurring in subjects considered to be iron-replete on the basis of presupplementation testing. The distribution of the TfR-F Index was narrowed most markedly. Differences between male and female subjects before supplementation were seen in sTfR (P < .0003), ferritin (P < .0005), and the TfR-F Index (P < .00001). After supplementation, the difference in sTfR values between men and women was eliminated (P < .4). However, differences remained in ferritin values (P < .001) and consequently in the TfR-F Index (P < .02). The significant difference between men and women in Hb, hematocrit, and erythrocyte count (P < .00001) remained unaffected by supplementation. No supplementation-induced changes or significant differences between men and women were observed in values of transferrin, iron, and transferrin saturation.
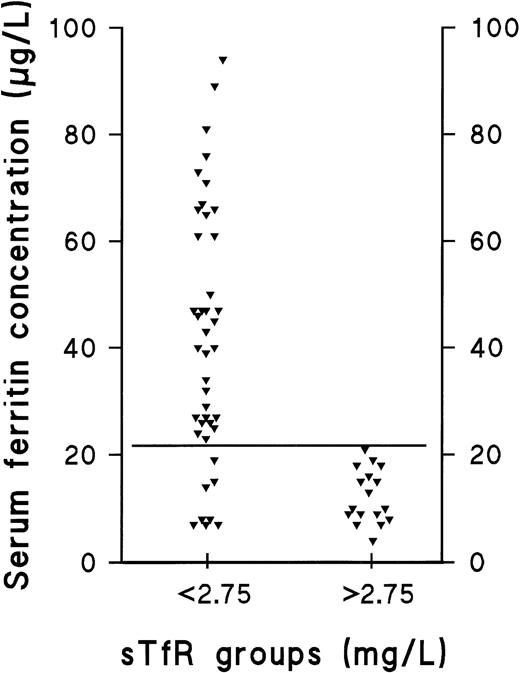
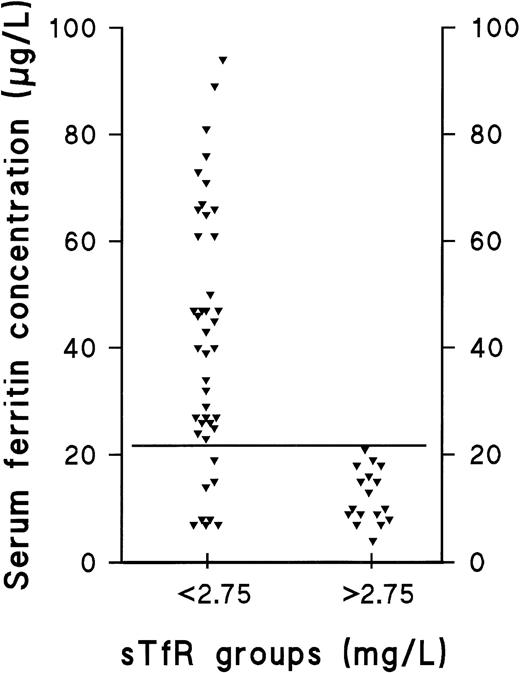
The prevalence of the nonanemic stages of ID in our population was studied retrospectively by comparing the individual values of the separate parameters in the presupplementation samples (sample A) with the respective 95% reference intervals calculated from results obtained after supplementation (sample B) (Table 2 and Fig 1). The decision limit of ferritin was set at 22 μg/L, as this concentration represented the lower limit of the 95% reference interval in the group of supplemented men (90% confidence interval, 22 to 38 μg/L). Furthermore, the range, which contained all subjects with elevated sTfR (>2.75 mg/L) before supplementation was 4 to 21 μg/L (Fig 2). Of the 65 subjects who completed the trial, 25 were retrospectively judged to have had storage iron depletion (stage I) or depletion of the functional compartment (IDE, stage II) (Fig 1). Supplementation-induced changes in these 25 subjects were highly significant as judged by sTfR, ferritin, and TfR-F Index (Table 1). Changes observed in other parameters indicative of iron status, including transferrin saturation, were absent or variable (data not shown).
Distribution of ferritin in subjects with normal sTfR and those with elevated sTfR. The ferritin concentrations of iron-replete and iron-deplete (diminished or exhausted iron stores) subjects (sTfR <2.75 mg/L) are compared with the corresponding values of subjects with IDE, ie, depletion of the functional iron compartment (sTfR >2.75 mg/L). The solid, horizontal line represents the ferritin concentration of 22 μg/L, which we suggest to be used as a cutoff value for clinically relevant depletion of the storage iron compartment.
Distribution of ferritin in subjects with normal sTfR and those with elevated sTfR. The ferritin concentrations of iron-replete and iron-deplete (diminished or exhausted iron stores) subjects (sTfR <2.75 mg/L) are compared with the corresponding values of subjects with IDE, ie, depletion of the functional iron compartment (sTfR >2.75 mg/L). The solid, horizontal line represents the ferritin concentration of 22 μg/L, which we suggest to be used as a cutoff value for clinically relevant depletion of the storage iron compartment.
DISCUSSION
The transition from the normal iron-replete state to the development of IDA entails two sequential processes (Fig 1): depletion of the storage iron compartment (stage I), followed by its exhaustion and the consequent initiation of depletion of the functional iron compartment in the setting of continued iron loss (stage II). There are no additional physiologic phenomena associated with the development of IDA (stage III), which is merely a sequel of progressive depletion of the functional compartment. Though the mechanisms linking the changes in iron status to the consequent changes observed in the various measurements have been well-documented,11-15,25 28-30accurate assessment of the iron status in an individual patient requires that the normal values established for various parameters be reexamined.
In this study, a population sample of apparently healthy, nonanemic adults was subjected to 3 months of oral iron supplementation to produce an iron-replete population. The samples obtained before supplementation (A) had values similar to those used to establish reference values for the various indices of iron status.31-34 Samples drawn after supplementation (B) were considered to represent the values of an iron-replete population. The prevalence of the nonanemic stages of ID were studied retrospectively by comparing the individual values of the separate parameters in the presupplementation samples with the corresponding 95% reference intervals from the postsupplementation samples. The effects of iron supplementation on the various laboratory values reflecting iron status were expected to be in agreement with findings from earlier studies and reviews.13,35 36
Ferritin measurements have been used to differentiate between normality and IDA, and the reference limits have been designed accordingly. However, disagreement still remains on the value, which indicates clinically relevant storage iron depletion. This is mainly due to the fairly large physiologic variability occurring between individual patients.5,28 The fact that ferritin is a known acute-phase reactant also complicates its use as a marker of ID in acute or chronic inflammatory diseases.28,37-44 To define the cut-off value for ferritin indicative of storage iron depletion, comparison was made of the the presupplementation ferritin and TfR levels observed in normals and storage iron-deficient patients with those observed in patients having IDE (Fig 2). The range of ferritin values in the 17 female subjects with IDE was found to be 4 to 21 μg/L, which suggests that concentrations <22 μg/L could be used to define clinically relevant storage depletion. The lower limit of the 95% reference interval in our sample of supplemented men was also 22 μg/L. Thus, this concentration can be used as a cut-off value for both men and women.13
Regarding the postsupplementation samples, the 3 months of oral iron supplementation produced a significant increase in ferritin concentrations in virtually all of the women, irrespective of their initial iron status. Four of the 17 women with IDE and very low initial ferritin concentrations emerged from the trial with ferritin concentrations of 17 to 18 μg/L and normalized sTfR. Excluding these four subjects, the lower limit of the 95% reference interval for women in samples taken after supplementation was also 22 μg/L (90% confidence interval, 21 to 24 μg/L). The restoration of the storage compartment is known to be initiated only after the immediate demand for iron is met and any losses of the functional compartment halted. Therefore, the supplementation used in this study seems to have been insufficient for complete replenishment of the iron deficit in subjects with functional depletion.
The data from sTfR measurements give a clearer picture of functional iron status than ferritin measurements. sTfR concentrations remain unaffected by any active acute-phase reactants, which has made sTfR measurement an attractive tool for the differential diagnosis of IDA.16-18 Its day-to-day variation is more acceptable than that of the conventionally used indices of functional iron status, such as transferrin saturation.45 Although sTfR concentrations are known to reflect the degree of depletion of the functional compartment well before IDA develops, most clinical experience comes from settings where reference limits have been set to diagnose ID in patients already anemic. We wished to modify the normal range of sTfR measurements to permit the detection of the inception of IDE. sTfR concentrations exceeding 2.75 mg/L (90% confidence interval, 2.34 to 2.84 mg/L), but not 3.6 mg/L (90% confidence interval, 3.26 to 3.72 mg/L; measured using the IDeA method of Orion Diagnostica) were deemed to define a subgroup of individuals having depletion of the functional iron compartment leading to IDE. For comparison, in a previous study,19 an sTfR concentration of 3.6 mg/L was identified as an optimal cutoff value for IDA. Supplementation induced a significant decrease in sTfR in all 17 women with initial values >2.75 mg/L, whereas little change was seen in the other women or any men with initial values <2.75 mg/L. This observation supports earlier findings about the stability of sTfR, which does not begin to increase until the development of true tissue ID. The difference in sTfR levels between men and women completely disappeared during the study, indicating that the initial difference might be explained by IDE present only in the women of our population sample. Consequently, the 95% reference interval, as suggested by the results obtained after supplementation, became narrower and virtually identical for both men and women. This is in agreement with previous studies, which have found similar sTfR concentrations in men and women.20,31 46 In our population, therefore, the elevated presupplementation range of sTfR was likely due to subclinical ID.
The sTfR/log ferritin ratio (TfR-F Index) has been shown to distinguish between iron-replete and iron-deplete anemic patients effectively, yet its value in diagnosing nonanemic ID remains to be verified.16 In the present study, the supplementation-induced change was made most apparent by using the TfR-F Index, indicating that the nonanemic stages of ID are readily detectable using this index. Similar supplementation-induced changes have been observed by Simmons et al.36 The TfR-F Index can distinguish storage iron depletion (stage I) from IDE (stage II), such that separate decision limits could be derived in the present study: a ratio of 1.8 (90% confidence interval, 1.55 to 1.99) or greater for storage iron depletion and 2.2 (90% confidence interval, 1.81 to 2.53) or greater for IDE (Fig 1). One subject considered normal presented with a combination of borderline normal values of ferritin (22 μg/L) and sTfR (2.43 mg/L), but a slightly elevated TfR-F Index (1.81) in the presupplementation sample. This might indicate that in borderline cases, when the results of sTfR and ferritin assays are ambiguous, the TfR-F Index is more sensitive in the detection of iron-deficient states.
The role of the individual tests of serum iron, serum transferrin, and transferrin saturation should be reevaluated because of their unpredictable variability and relative insensitivity.7,14,16,47 48 Our findings indicate that sTfR measurement could replace these procedures in the routine testing of ID, as the subclinical ID present in our study population remained undetected by these other methods, and the changes induced by supplementation were sporadic and inconsistent (Table 1).
This study was undertaken in an attempt to characterize the different stages of ID by means of serum ferritin, sTfR, and TfR-F Index determinations. A relatively large number of women of childbearing age were intentionally enrolled to permit inclusion of a larger proportion of potential subjects with subclinical ID. Therefore, the data presented in this study offer limited epidemiologic information. In our opinion, the presence of IDE could be disclosed by sTfR concentrations, whereas Hb determination is applicable to the detection of IDA. The detection of reduced ferritin concentrations, on the other hand, could indicate an increased risk of progressive ID, and together with sTfR, distinguish between the two subclinical phases of ID. In certain situations, emphasizing the importance of sTfR rather than the Hb alone in the diagnostic algorithm might contribute to a more effective preventive approach: a clinically silent ID could be detected when the need for compensatory mechanisms arises, ie, well before IDA develops.
The limited availability of dietary iron almost never seems to be the only explanation for ID in older children, adult men, and postmenopausal women. Therefore, further investigation is often promptly indicated to disclose the underlying cause of ID. In certain situations where an increase in iron requirements can be expected, it might be useful to regard elevated sTfR concentrations as the manifestation of true ID, as an elevated concentration represents IDE. This use of sTfR measurement offers a particular advantage over ferritin determination in physiologic conditions, in which depletion of the storage compartment is highly prevalent, such as infancy, early childhood, adolescence, and pregnancy. In these conditions, ferritin concentrations are usually close to the limit of ID, and monitoring sTfR would show differences in functional iron status more accurately. The combined use of ferritin, sTfR, and Hb determinations, along with the TfR-F Index, facilitates the accurate determination of the iron status of any given patient. The clinical condition of the individual patient, however, dictates which measurement should be emphasized for the diagnosis of ID and whether the diagnosis of ID warrants monitoring, dietary counseling, iron therapy, or other measures.
Address reprint requests to Pauli Suominen, MD, Central Laboratory, Turku University Central Hospital, PL 52, FIN-20521, Turku, Finland; e-mail: pausuo@utu.fi.
The publication costs of this article were defrayed in part by page charge payment. This article must therefore be hereby marked "advertisement" is accordance with 18 U.S.C. section 1734 solely to indicate this fact.


