The Na+/H+ exchanger isoform 1 (NHE1) is primarily responsible for the regulation of intracellular pH (pHi). It is a ubiquitous, amiloride-sensitive, growth factor–activatable exchanger whose role has been implicated in cell-cycle regulation, apoptosis, and neoplasia. Here we demonstrate that leukemic cell lines and peripheral blood from primary patient leukemic samples exhibit a constitutively and statistically higher pHi than normal hematopoietic tissue. We then show that a direct correlation exists between pHi and cell-cycle status of normal hematopoietic and leukemic cells. Advantage was taken of this relationship by treating leukemic cells with the Na+/H+ exchanger inhibitor, 5-(N, N-hexamethylene)-amiloride (HMA), which decreases the pHiand induces apoptosis. By incubating patient leukemic cells in vitro with pharmacologic doses of HMA for up to 5 hours, we show, using flow cytometry and fluorescent ratio imaging microscopy, that when the pHi decreases, apoptosis—measured by annexin-V and TUNEL methodologies—rapidly increases so that more than 90% of the leukemic cells are killed. The differential sensitivity exhibited between normal and leukemic cells allows consideration of NHE1 inhibitors as potential antileukemic agents.
The role of intracellular pH (pHi) regulation in hematopoiesis is an area of research that has received little attention. Yet the concern for maintaining pH as an important parameter in all in vitro work is well known. By keeping the extracellular pH (pHe) constant, we assume that the cells will be able to regulate their own pHi. This is indeed the case because cells are equipped with several different exchangers to help regulate pHi and to counteract acidification either by efflux of H+ ions or influx of HCO3− ions. The Na+-dependent and -independent Cl−/HCO3−exchangers and an adenosine triphosphate–dependent H+ pump are important if the cell becomes too acidic or too alkaline.1,2 Thus, whereas the Na+-linked Cl−/HCO3−antiporter exchanges Na+ and HCO3− ions for Cl− ions, thereby causing a increase in cytosolic pHi, the Na+-independent Cl−/HCO3−exchanger reduces pHi in cells with an alkali overload.3 However, the primary regulator of pHi is the Na+/H+ exchanger (NHE) of which there are 6 known isoforms.4
The ubiquitous Na+/H+ exchanger isoform 1 (NHE1) is the primary membrane transporter used by cells to regulate pHi and cell volume.1,2 The human NHE1 is an 815-amino acid membrane protein transporter produced from the 70-kb long APNH gene located on chromosome 1p35-36.1.5,6The 1p36 region has been shown to contain the tumor suppressor p73,7,8 deletion of which has been implicated in the development of neuroblastoma, breast cancer, colon cancer, melanoma, and Wilms tumor,7 and other reports have documented loss of heterozygosity in this region to be associated with chronic myelogenous leukemia.9 10
The NHE1 protein has 12 membrane-spanning segments. The extracellular region contains a highly conserved Na+/H+-binding site and an amiloride-binding site. Amiloride is a potassium-sparing diuretic used to treat hypokalemia and manage edema, and it is an adjunct in hypertension. Many amiloride analogs have been produced with variable potency and specificity11-13 and, as described below, have been used in various applications with hematopoietic cells. The cytoplasmic domain of the NHE1 contains the pH sensor and maintenance sites.2However, it also contains regions that activate the exchanger when growth factors, mitogens, or nonmitogenic signals act on the cell.2 For this reason, the NHE1 has been called a “growth factor–activatable” exchanger. Activation of NHE1 results in a 1:1 efflux of H+ and influx of Na+ions, with a concomitant increase in pHi. All the growth factors tested have been shown to increase pHi with an associated activation of cell stimulation and proliferation.1 For example, using the interleukin-3 (IL-3)-dependent stem-cell line, FDCP-mix, Whetton et al14demonstrated that IL-3 activates the NHE and that the resultant intracellular alkalinization was a signal for proliferation of these cells. When granulocyte-macrophage colony-stimulating factor was used to stimulate macrophage proliferation, activation of the NHE was detected.15 Removal of growth factors such as IL-2 from IL-2–dependent cytotoxic T cells resulted in a decrease in pHi and the onset of apoptosis.16 17
Growth factors are not the only stimuli to activate the NHE1. Phorbol esters activate the exchanger nonspecifically within 5 minutes.18 In addition, cell–cell interactions can also activate the NHE1. For example, many members of the integrin family can activate the exchanger.19 Adherence of cells to fibronectin or specific fibronectin-binding sequences results in localization of the exchanger together with integrins and growth factor receptors in a so-called focal adhesion complex.20 Our laboratory has demonstrated that the NHE1 is involved in cell–cell interactions of normal murine hematopoietic cells.21 When murine bone marrow cells are brought together at high cell density by centrifugation, hematopoietic stem and progenitor cells can be stimulated to produce colonies in vitro in the absence of growth factors. The stimulation results from interaction of the α4 integrin subunit with fibronectin, causing activation of NHE1, an increase in pHi, and increased hematopoietic colony formation.21
In contrast to activation of the NHE1 and the concomitant increase in pHi by various stimuli, a decrease in pHi can result in apoptosis of the cell. Several reports using different leukemic cell lines demonstrated that if the Na+/H+ exchanger was inhibited by amiloride analogs, acidification of the cells occurred with a concomitant induction of apoptosis.22-24 We hypothesized that cells maintaining a high rate of proliferation should exhibit a sustained increase in pHi relative to normal cells as a result of activation of the NHE1. Here we show that leukemic cell lines and primary patient leukemic samples exhibit a greater pHi than normal cells, that pHi is correlated with cell-cycle status, and that inhibition of NHE1 in patient leukemic cells results in a decrease in pHi and an increase in apoptosis.
Materials and methods
Human samples
Normal peripheral blood mononuclear cell (PBMC) and bone marrow mononuclear cell (BMMC) samples were obtained from adult donors after approved Institutional Research Board consent forms had been signed. Similarly, samples from patients with leukemia were also obtained after consent had been given. Samples were obtained from patients with acute lymphocytic leukemia (ALL) and acute myeloid leukemia (AML), chronic lymphocytic leukemia (CLL) and chronic myeloid leukemia (CML), and pre-B ALL. The mononuclear cell fraction was obtained by Ficoll-Hypaque separation.
Leukemic cell lines
The following human leukemic cell lines were originally obtained from the American Type Culture Collection (ATCC, Rockville, MD): KG-1a (bone marrow acute myelogenous leukemia), Jurkat (acute T-cell leukemia), Molt-4 (peripheral blood acute lymphoblastic leukemia), CEM (peripheral blood acute lymphoblastic leukemia), K562 (chronic myeloid leukemia), THP-1 (acute monocytic leukemia), and Nalm-6 (B-cell leukemia). All cell lines were cultured in Dulbecco's modified Eagle's medium (DMEM) containing 10% heat-inactivated fetal bovine serum. Only cells in log-phase growth were used.
Growth and expansion of primary leukemic cells in NOD-SCID mice
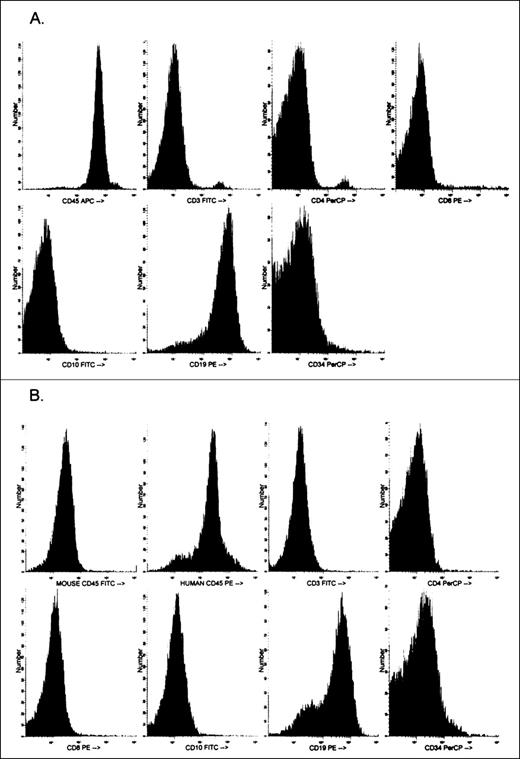
The nonobese diabetic, severe combined immunodeficient (NOD/LtSzscid/scid, NOD-SCID; Jackson Laboratories, Bar Harbor, MA) provides an excellent animal model for growing and expanding primary human leukemic cells,25,26 which are normally difficult to grow in culture. The method described by Yan et al27 for growing leukemic cells as subcutaneous nodules provided us with a method of expanding the original leukemic sample containing 1-5 × 10⁷ cells to more than 5 × 10⁸ cells. Because relatively large numbers of cells were required for flow cytometric analyses (see below), especially those involving both pHi and cell-cycle measurements, cells derived from the nodules were used. The NOD-SCID mice were kept under stringent sterile conditions in a Hepa-filtered mouse rack. Mice were injected subcutaneously with 1 × 10⁷ cells suspended in 100 μL Matrigel (Becton Dickinson, San Jose, CA) into untreated NOD-SCID mice as described previously by Yan et al.27 Nodules were usually observed between 4 and 8 weeks after subcutaneous injection and were excised after a maximum of 12 weeks. A single cell suspension was prepared after collagenase/dispase digestion for 45 minutes at 37°C and repeated pipetting. After isolation, the cells were analyzed phenotypically and cytogenetically to determine whether any changes had occurred from the primary inoculum. Phenotypic characterization was performed using the same panel of monoclonal antibodies used to define the original sample. In addition, to differentiate and determine the proportion of mouse-to-human cells present in the nodule, the cells were stained with mouse CD45-fluorescien isothiocyanate (FITC) and human CD45-phycoerythrin (both obtained from Pharmingen, San Diego, CA) and were analyzed by flow cytometry. Figure1 shows a phenotypic analysis of the primary inoculum cells obtained from a patient with ALL and the phenotype of the cells obtained after 3 months growth in a NOD-SCID mouse. With the exception of the loss of the small populations of CD4 and CD8 cells from the primary inoculum to nodule cells, little change has occurred in the phenotype of the leukemic cells. In addition, in this particular sample, human CD45+ cells comprised more than 85% of the sample (Figure 1B). No further purification was performed.
Phenotypic analysis of human acute lymphocytic leukemic (ALL) peripheral blood cells.
Analysis is of cells before (A) and after (B) 3 months of growth and expansion in NOD-SCID mice. Also shown in panel B is the phenotypic characterization of mouse and human CD45+ cells derived from the nodule.
Phenotypic analysis of human acute lymphocytic leukemic (ALL) peripheral blood cells.
Analysis is of cells before (A) and after (B) 3 months of growth and expansion in NOD-SCID mice. Also shown in panel B is the phenotypic characterization of mouse and human CD45+ cells derived from the nodule.
Treatment of normal peripheral blood with phorbol ester
Normal PBMC were incubated for 5 minutes with 10-6mol/L phorbol-12-myristate-13-acetate (Sigma Chemical, St. Louis, MO) to activate the NHE1 nonspecifically. Thereafter the cells were washed with phosphate-buffered saline (PBS).
Measurement of pHi by flow cytometry and fluorescence ratio imaging microscopy
Measurement of pHi for hematopoietic cells has been described in detail elsewhere.21 Briefly, intracellular pH was measured by both flow cytometry and fluorescence ratio imaging microscopy (FRIM) by incubating 1 × 10⁶ cells with a final concentration of 10 μmol/L carboxy SemiNaphthoRhodaFluor-1 acetoxymethyl ester, acetate (carboxy SNARF-1 AM; Molecular Probes, Eugene, OR) for 15 minutes at 37°C. After incubation, the cells were washed twice with PBS. Because the addition of bicarbonate can affect pHi, all incubations and cell washes were performed in bicarbonate-free buffer. SNARF is excited at 488 nm and emits at 580 nm and 640 nm. The ratio of the emission wavelengths 640/580 nm was used to estimate the pHi from a calibration curve.21 The calibration curve was performed using the “nigericin clamp technique.”28 After SNARF labeling, aliquots of cell suspensions were resuspended in a high K+-containing buffer at a specific pH (usually 6.8, 7.0, 7.2, 7.4, 7.6, and 7.8 for flow cytometry or 6.6, 7.0, 7.4, and 7.8 for FRIM). The cell suspensions were then “clamped” at the specific pH value by the addition of 0.03 μmol/L nigericin (Molecular Probes). Nigericin is an ionophore that allows the exchange of H+for K+ ions by abolishing the pH gradient across the cell membrane. Thus, when the internal and external K+concentrations are approximately the same, the pH rapidly equilibrates to the pH of the bathing solution. For flow cytometry, 50 000 events were acquired on a FACSort flow cytometer (Becton Dickinson). Using FRIM, measurements and images were acquired using 2-image intensifying charged-couple device cameras (for 580 nm and 640 nm) attached to an Axiovert 150 microscope (Zeiss, Oberkochen, Germany). Attofluor Ratio Vision software (Atto Instruments, Rockville, MD) was used to acquire and analyze the data. Flow cytometric results were analyzed using WinList Software (Verity Software House, Topsham, ME) to obtain fluorescence ratio measurements. For flow cytometry and FRIM analysis, the fluorescent ratio values obtained for each pH of the calibration reagents were obtained, and a calibration curve was obtained using Table Curve software (SPSS, Chicago, IL), from which the sample pHi values were determined.
Measurement of cell cycle
The proportion of cells in the S-phase of the cell cycle was determined using the propidium iodide technique (CycleTEST Plus DNA reagent kit; Becton Dickinson) on 1 × 10⁶cells/sample according to the manufacturer's instructions. Data were acquired by flow cytometry and analyzed using the ModFit LT software program (Verity Software House).
Measurement of apoptosis by annexin-V and TUNEL
Two methods were used to determine whether reduction in pHi induced apoptosis. The first was annexin-V conjugated to fluorescein isothiocyanate to determine the translocation of phosphatidylserine from the inside to the outside of the plasma membrane. Cells were counterstained with propidium iodide to determine the proportion of necrotic cells. Cell staining was performed according to the manufacturer's instructions. The second technique used terminal deoxynucleotidyl transferase (TdT)–mediated dUTP nick-end labeling (TUNEL) of fragmented DNA. Fluorochrome (FITC)-labeling of DNA (Boehringer-Mannheim, Mannheim, Germany) was performed according to the manufacturer's instructions. Data acquisition was performed by flow cytometry and analyzed using WinList software (Verity Software House).
Treatment of cells with ammonium chloride or 5-(N, N-hexamethylene)-amiloride
To induce intracellular acidosis, cells were incubated in 20 mmol/L ammonium chloride (NH4Cl) solution for varying periods of time. Thereafter, the cells were washed twice in PBS and labeled with SNARF, and the pHi was measured by FRIM. To inhibit the NHE1, the amiloride analogue, 5-(N, N-hexamethylene)-amiloride HMA (Sigma Chemical) was used. A stock solution of 10−2mol/L was prepared by dissolving the solid in dimethyl sulfoxide (DMSO). Further dilutions were prepared in DMEM. Cells were incubated at concentrations ranging from 10−6 mol/L to 10−3 mol/L for varying periods of time specified in “Results.” After incubation, cells were washed and sectioned into aliquots according to the type of measurement (pHi or apoptosis) performed. Controls included cells not treated with HMA. Previous studies demonstrated that the solvent vehicle (DMSO), at the concentrations of HMA added, had no adverse effect on pHi measurements or apoptosis.
Statistics
The number (n) of experiments performed is given in each figure legend. All results are given as the mean ± SEM for the given number of experiments stated in the figure legends. Statistical significance was determined either using the 2-way, unpaired ttest or 1-way analysis of variance.
Results
Steady-state pHi of peripheral blood and bone marrow mononuclear cells
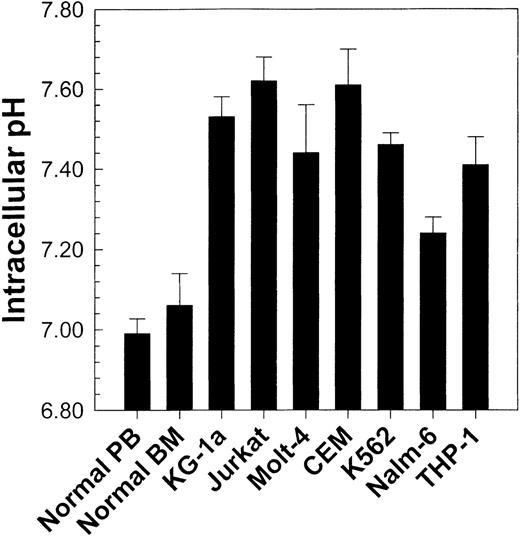
Using flow cytometry and the pH-sensitive fluorescent indicator SNARF, we first determined the pHi of normal human PBMC and BMMC. No significant difference (P > .05) in pHi occurred between PBMC (pHi = 6.99 ± 0.037; n = 25) and BMMC (pHi = 7.06 ± 0.08; n = 10). These results are seen in Figure 2. It should be noted that although the pHi of specific cell subpopulations can be measured, data are presented here for whole populations. This is because specific subpopulations measured in normal cells may not exist in leukemic cell lines or primary leukemic patient samples. Therefore, to compare different samples under the same conditions, measurements were performed on whole populations.
Comparison of pHi values from normal peripheral blood and bone marrow (see Figure 3) with those from 7 different human leukemic cell lines.
Values represent the mean ± SEM of at least 4 experiments for each cell line tested. All cell lines exhibited a statistically higher (P < .01) pHi than normal cells.
Intracellular pH of leukemic cell lines and primary leukemic cells
Having obtained baseline pHi values for normal cells, we then found that various leukemic cell lines exhibited a higher pHi(P < .01) than normal PBMC and BMMC (Figure 2). These observations were concordant with those of previous reports describing intracellular alkalinization of continuously proliferating cell lines,17,22,29 30 but they prompted review of the behavior of primary leukemic samples.
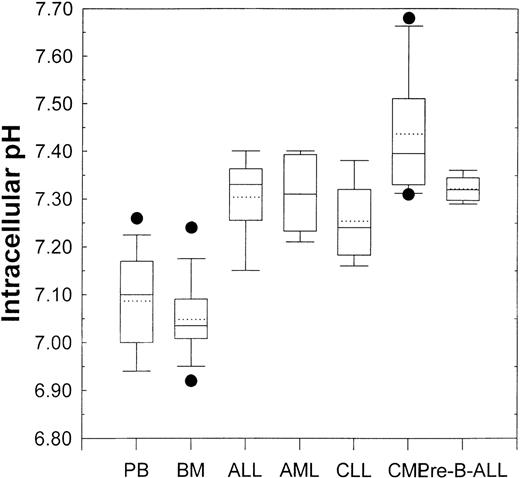
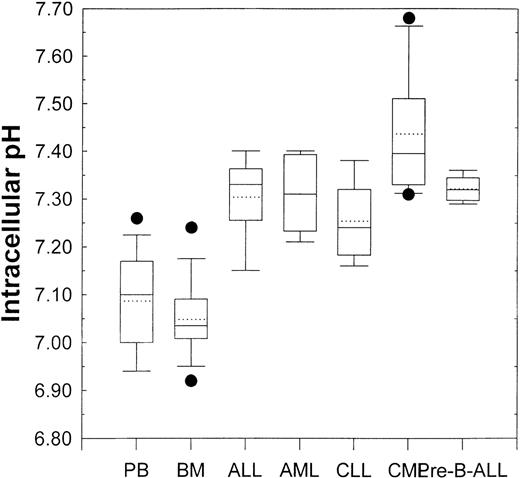
Figure 3 shows the pHi values of samples obtained from patients with different leukemias. The box and whisker plots showing all the relevant statistical information are described in the figure legend. Analysis of variance demonstrated that, compared with that from healthy donors, the pHi values from ALL (P = .005), AML (P = .004), CLL (P = .049), CML (P < .001), and pre-B-ALL (P = .002) patient PBMC were all significantly higher. This implied a correlation between activity of the NHE1 and proliferative status.
Box and whisker plots for normal peripheral blood and bone marrow (see Figure 2) and primary leukemic patient samples.
Lowest and highest boundaries of the box indicate the 25th and 75th percentiles, respectively; the whiskers above and below the box designate the 95th and 5th percentiles, respectively; the solid line within the box represents the median value, whereas the dotted line is the mean value; dots above or below the box indicate outliers. Acute lymphoblastic leukemia (ALL, n = 5), acute myelogenous leukemic (AML, n = 5), chronic lymphocytic leukemia (CLL, n = 5), chronic myelogenous leukemia (CML, n = 6), pre-B-acute lymphoblastic leukemia (pre-B-ALL, n = 5).
Correlation between pHi and cell-cycle status
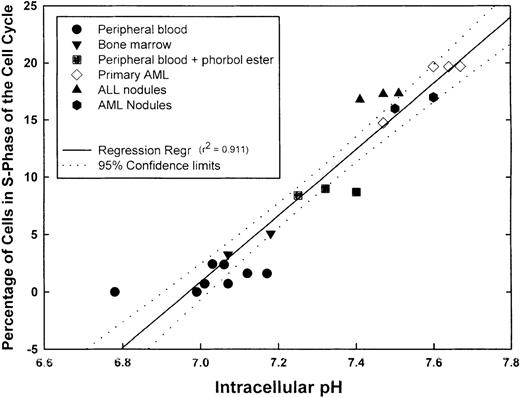
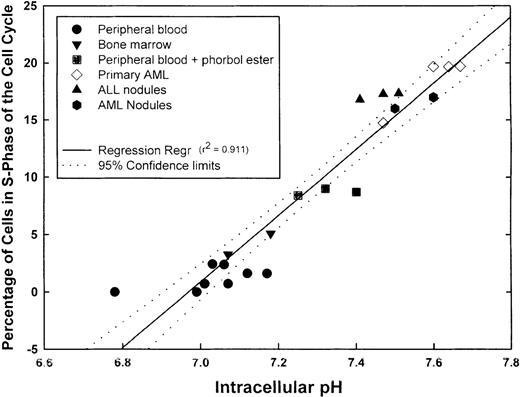
We next measured pHi and simultaneously determined the percentage of cells in S-phase of the cell cycle in aliquots of the same sample using propidium iodide labeling. Before analysis, PBMC was also incubated with phorbol ester to activate the NHE1. Samples incubated with phorbol ester for 5 minutes showed a statistically higher (P = .003) pHi (7.32 ± 0.043) than unstimulated PBMC (7.03 ± 0.04) and showed a statistically greater (P < .001) proportion of cells in S-phase (8.7% ± 0.17%) than untreated PBMC (1.19% ± 0.34%). The proportions of S-phase normal PBMC and BMMC were less than 5%. Fresh primary AML cells demonstrated some variation in the proportion of S-phase cells, but this ranged from approximately 14% to 20%. Each of the 2 patients from whom the fresh AML cells were obtained had blast cell counts of 45% to 50%. The primary ALL inocula used to obtain subcutaneous nodules contained more than 75% blasts in the peripheral blood. Primary AML and ALL cells formed subcutaneous nodules in NOD-SCID animals. When the nodules were excised and cells analyzed for pHi and the percentage in S-phase of the cell cycle, it was found that both parameters were increased above normal values. When pHi and the proportion of S-phase cells were further analyzed for any correlation, a positive linear regression was obtained with a correlation coefficient (r2) of 0.911, indicating that a direct correlation existed between pHi and the proportion of cells in S-phase (Figure4). Although not shown here, leukemic cell lines (KG-1a, CEM, K562, and Nalm-6) exhibited high pHi and a high proportion of cells in S-phase; these parameters were dependent on the growth curve of the cells. Thus, intracellular alkalinization is associated with an increased proliferation. We hypothesized that unregulated proliferation of leukemic cells might, at least in part, be caused by the suppression of normal apoptotic mechanisms. If this were the case, inhibitors of the NHE1 would be expected to reduce the pHi and induce apoptosis in leukemic cells.
Correlation between pHi and cell cycle.
Samples from different normal and leukemic cell suspensions were divided into 2 aliquots, 1 for pHi and the other for cell-cycle measurements. The graph shows the number of values for the individual samples, the linear regression (r2 = 0.911), and the 95% confidence limits of the regression line.
Effect of NHE1 inhibition on pHi and apoptosis of normal peripheral blood mononuclear cells
Normal peripheral blood cells were incubated in the absence or presence of the NHE1 inhibitor HMA at concentrations ranging from 10−6 mol/L to 10−3 mol/L for up to 5 hours. Cells were then sectioned into aliquots so that pHi and apoptotic measurements could be performed. In these experiments, pHi was measured using flow cytometry and FRIM. Figure 5 shows that by using both FRIM and flow cytometry, the induction of PBMC in the absence of HMA for a period of 5 hours results in a very gradual increase in pHi. Figures 5A and 5B show that the greatest inhibition occurred at 5 hours, using the highest HMA concentration (10−3 mol/L). Similarly, the greatest proportion of apoptotic cells, measured by annexin-V and TUNEL labeling, was found after 5 hours' incubation with 10−3 mol/L HMA (Figures 5C, 5D). The proportion of necrotic cells measured by propidium iodide remained constant at approximately 5% in the absence or presence of HMA for each time point measured. Flow cytometric profiles showed that the proportion of annexin-V/propidium iodide–positive cells (Figure 5C) resulted from increasing numbers of cells first becoming annexin-V positive (data not shown) and then double-positive for both dyes. That is, all cells underwent apoptosis before dying and were not necrotic beforehand. Using both annexin-V and TUNEL methods, a maximum of approximately 25% normal PBMC was apoptotic when the pHi was reduced to approximately 6.8. As seen also in the following experiments, a pHi value of approximately 6.8 appears to be critical because below this value, apoptosis is clearly evident.
The effect of HMA on the pHi and apoptosis of normal peripheral blood cells.
Not shown on the graphs are the pHi and apoptosis control time points in the absence of HMA. These are as follows: (A) Fluorescence ratio imaging microscopy (FRIM), 30 minutes = 6.95 ± 0.02, 1 hour = 7.00 ± 0.015, 3 hours = 7.08 ± 0.02, 5 hours = 7.13 ± 0.02. (B) Flow cytometry, 30 minutes = 7.01 ± 0.03, 1 hour = 6.98 ± 0.04, 3 hours = 7.04 ± 0.04, 5 hours = 7.09 ± 0.05. (C) Annexin-V-FITC, 30 minutes = 1.53 ± 0.09, 1 hour = 1.32 ± 0.15, 3 hours = 1.38 ± 0.04, 5 hours = 2.6 ± 0.07. (D) TUNEL, 30 minutes = 0.89 ± 0.31, 1 hour = 0.96 ± 0.16, 3 hours = 0.60 ± 0.29, 5 hours = 1.8 ± 0.48. Results represent mean ± SEM of 3 experiments.
Effect of NHE1 inhibition on pHi and apoptosis of leukemic cell lines
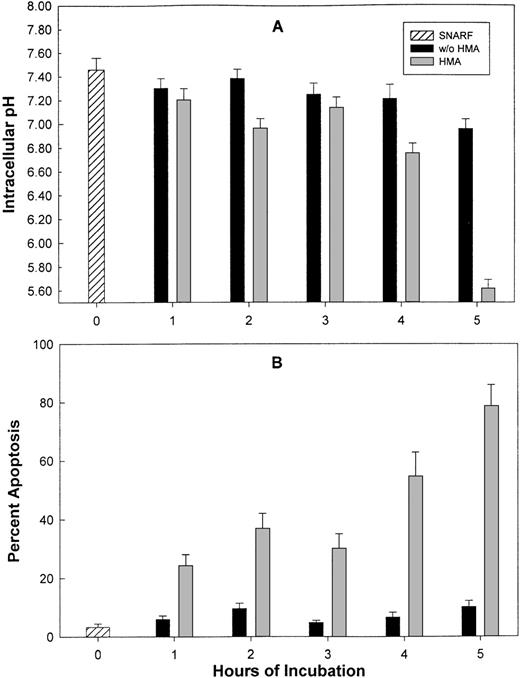
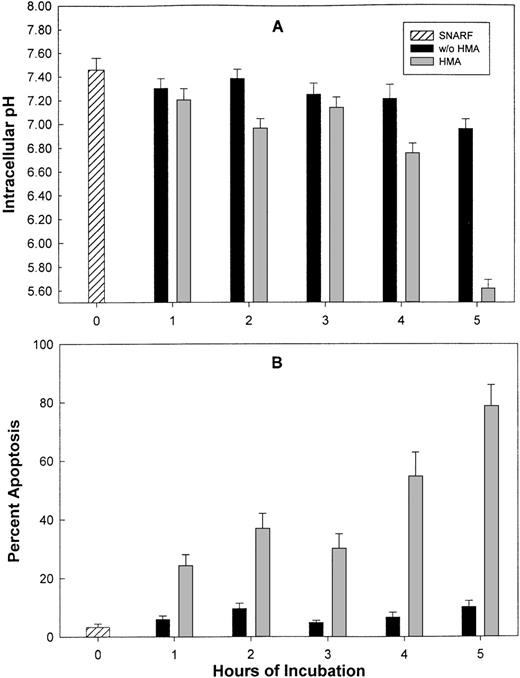
Leukemic cell lines (KG-1a and CEM) were incubated for varying periods of time with 10−3 mol/L HMA, and pHi and apoptosis were measured. Figure6 shows the results for KG-1a cells. For both cell lines, in the absence of HMA, pHi ranged from 7.43 ± 0.1 at time 0 to 6.9 ± 0.08 after 5 hours of incubation. However, after 5 hours with HMA, the pHi decreased to 5.6 ± 0.07 (n = 4) for KG-1a and 6.1 ± 0.06 (n = 4) for CEM cells. In the absence of HMA, the percentage of KG-1a and CEM cells undergoing apoptosis, measured by annexin-V, ranged from 2% to 9% for the duration of the experiment, whereas by 5 hours in the presence of HMA, the percentage of KG-1a or CEM cells undergoing apoptosis ranged from 70% to almost 80%.
The effect of HMA on pHi and apoptosis of KG-1a leukemic cells.
Measurement of pHi (A) was performed using flow cytometry, and apoptosis (B) was detected by annexin-V. Results represent the mean ± SEM of 3 experiments.
The effect of HMA on pHi and apoptosis of KG-1a leukemic cells.
Measurement of pHi (A) was performed using flow cytometry, and apoptosis (B) was detected by annexin-V. Results represent the mean ± SEM of 3 experiments.
To demonstrate that reduction in pHi was caused by specific inhibition of the NHE1 by HMA, KG-1a cells were subjected to intracellular acidosis by treatment with 20 mmol/L NH4Cl for up to 5 hours. Results are shown in Table1 and demonstrate that in contrast to cells incubated in the absence of HN4Cl, there is a gradual but expected decrease in pHi with time. These results demonstrate that HMA is probably not affecting another pathway other than the inhibition of the NHE1. They also indicate that below a critical pHi, apoptosis can be initiated.
Effect of NHE1 inhibition on pHi and apoptosis of primary leukemic cells
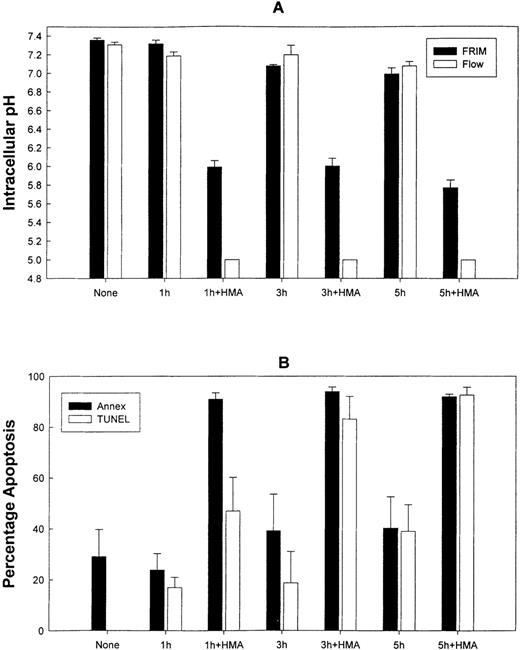
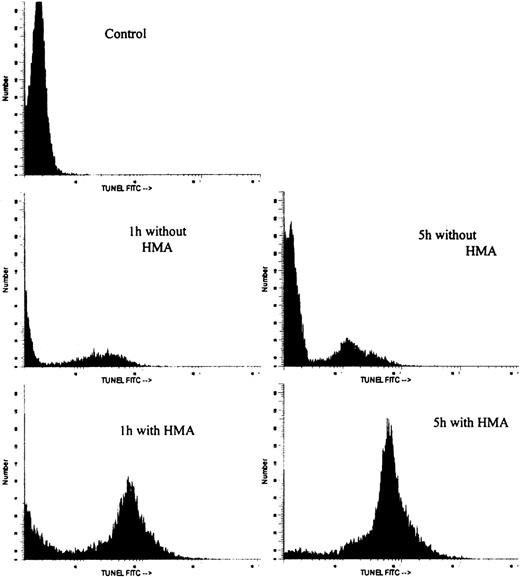
Figure 7 shows the effect on pHi and apoptosis after incubating fresh ALL patient leukemic PBMC with 10−3 mol/L HMA for up to 5 hours. All leukemic samples used in these experiments contained between 85% and 95% blast cells. Intracellular pH was measured by both FRIM and flow cytometry, whereas apoptosis was measured by annexin-V and TUNEL. In the presence of pharmacologic doses of HMA, pHi was rapidly reduced compared with cells incubated in the absence of HMA. In fact, in all experiments, pHi of the cells measured by flow cytometry was too low to measure on the calibration curve. For this reason, pHi values for 1 hour, 3 hours, and 5 hours were set at 5.0. After 1 hour, the proportion of cells incubated with HMA undergoing apoptosis was approximately 85% using annexin-V and approximately 60% using the TUNEL technique. After 5 hours of incubation, both methods indicated that more than 90% of the cells were apoptotic. Figure 8 shows the flow cytometric histogram profiles for a representative sample of ALL cells incubated in the absence or presence of HMA, followed by analysis of apoptosis using the TUNEL method. Thus, primary ALL cells showed greater sensitivity to HMA than normal PBMC, thereby demonstrating an important differential effect between normal and acute lymphocytic leukemic cells.
The effect of HMA on pHi and apoptosis of primary acute lymphoblastic leukemic cells.
(A) Measurement of pHi by FRIM and flow cytometry. (B) Estimation of apoptosis by annexin-V-FITC and TUNEL. Results represent mean ± SEM of 3 experiments.
The effect of HMA on pHi and apoptosis of primary acute lymphoblastic leukemic cells.
(A) Measurement of pHi by FRIM and flow cytometry. (B) Estimation of apoptosis by annexin-V-FITC and TUNEL. Results represent mean ± SEM of 3 experiments.
Flow cytometric histogram profiles of a representative ALL sample incubated in the absence or presence of HMA, followed by measurement of apoptosis by the TUNEL method.
Flow cytometric histogram profiles of a representative ALL sample incubated in the absence or presence of HMA, followed by measurement of apoptosis by the TUNEL method.
Discussion
The results presented here demonstrate a novel method by which primary leukemic cells can be induced into apoptosis by inhibiting the Na+/H+ exchanger protein, a product of a housekeeping gene. They also implicate the NHE1 as playing an integral role in normal and abnormal hematopoiesis. We have previously demonstrated that normal murine bone marrow cells can be stimulated by the interaction of extracellular matrix proteins with the α4-integrin subunit, leading to activation of the Na+/H+ exchanger, an increase in pHi, and proliferation of hematopoietic stem and progenitor colony-forming cells in the absence of growth factors.21This pathway could be inhibited by antibodies to either fibronectin or α4 integrin or by an inhibitor of the NHE1.21From these studies, we hypothesized that whereas nondividing cells would exhibit a low pHi because the NHE1 was inactive and therefore would not be affected by NHE1 inhibitors, continuously proliferating cells would exhibit a higher pHi because of an active but inhibitor-sensitive Na+/H+exchanger. In the case of proliferating leukemic cells, we further hypothesized that because a constitutively higher pHi was demonstrated, sustained activity of the NHE1 would concomitantly suppress apoptosis, thereby potentially allowing NHE1 inhibitors to induce apoptosis.
Both normal PBMC and BMMC exhibit pHi values of approximately 7.0, which correlates with the minimal proportion of S-phase cells (0% to 5%)31 and the low percentage of cells in apoptosis. We predict that those cells that undergo apoptosis as a result of NHE1 inhibition by HMA are in proliferation and as such would comprise the progenitor and precursor populations rather than the stem cell population. In contrast to normal cells, leukemic cell lines and primary leukemic cells exhibit higher pHi values and a higher proportion of cells in S-phase of the cell cycle. Several reports have studied the proportion of leukemic cells in S-phase cells of the cell cycle and percentages range from as low as 1% to as high as more than 40%.32-35 The proportion of S-phase for fresh AML and AML and ALL cells grown and expanded in NOD-SCID mice is certainly within these previously reported ranges.33,35 36The demonstration that primary leukemic cells exhibit a statistically higher pHi than normal hematopoietic cells, together with the direct correlation between pHi and the proportion of cells in S-phase, implies that pHi measurements could be used as a biomarker to distinguish between resting and proliferating cells, in particular proliferating leukemic cell populations.
The direct correlation between pHi and S-phase cells has additional implications. First, a sustained increase in pHimay be one of the mechanisms driving or facilitating neoplastic transformation, proliferation, or both.37-39 Although a statistically higher pHi was observed in leukemic cells than in normal cells, this difference has not been found to be attributable to mutations in the NHE1 gene. Extensive sequence analysis of 10 healthy donors, 4 leukemic cell lines, and 6 leukemic patient samples failed to demonstrate any leukemia-specific mutations in the gene.40 Therefore, the constitutively higher pHi found in leukemic cells probably results from events that have occurred downstream of the NHE1. Second, because expression and activity of the Na+/H+ exchanger have been shown to be required for tumor growth,37 41 it follows that methods to decrease pHi may have potential in the therapy of neoplasms. This possibility prompted us to study the effects of an NHE1 inhibitor on pHi and apoptosis of leukemic cells.
Li and Eastman16 show that a functional Na+/H+ exchanger is required for the process of apoptosis. Indeed, the addition of HMA to normal PBMC even after 1 hour of incubation results in little or no effect (Figure 5) because if the NHE1 is not activated, it cannot be inhibited. Although we did not measure the cell-cycle status in normal peripheral blood during the 5-hour time course of these experiments, the pHi of normal untreated PBMC increases almost imperceptibly (Figure 5). Presumably, the transfer of cells to fresh culture medium and incubation are sufficient to initiate a growth process resulting in activation of the NHE1, which can then be inhibited by HMA and results in a decrease in pHi and concomitant apoptosis. As mentioned earlier, we would expect that the approximate 25% of normal PBMC that are induced into apoptosis comprises differentiating cells and few, if any, hematopoietic stem cells. The cellular composition of this apoptotic population is under investigation.
In contrast to normal PBMC, leukemic cell lines are continuously proliferating and would therefore be expected to demonstrate a constitutively active NHE1 that could be inhibited. This is indeed the case because an almost exponential increase in apoptotic cells amounting to approximately 80% after 5 hours, with a concomitant decrease in pHi, was observed. A similar situation was found with primary ALL cells. However, in this case, a gradual increase in the proportion of apoptotic cells was not seen. Instead, more than 90% annexin-V positive cells were seen within 1 hour of HMA treatment. Using TUNEL, DNA fragmentation was detected in more than 40% of the cells but increased to annexin-V levels after 3 hours of HMA treatment. This considerable antileukemic effect was accompanied by a rapid and drastic decline in pHi. Thus, not only can increased pHi be correlated with an increase in proliferative status, a decrease in pHi can be correlated with an increase in apoptotic activity. From the results presented here and those reported elsewhere,23 42 it appears that there is a critical pHi value that separates the life-maintaining processes from the apoptotic-inducing processes. This critical pHi value appears to be approximately 6.8.
These results are concordant with several reports in which reduced pHi of hematopoietic cells increased levels of apoptosis.22-24 In 1992, Harguindey and Cragoe43 suggested that amiloride analogs could be used to control metastasis and cancer multidrug resistance. Horvat et al44 and Hasuda et al45 demonstrated that after acidification of the extracellular milieu using the ionophore nigericin, the addition of amiloride analogs, notably 5-(N-ethyl-N-isopropyl) amiloride, or EIPA, was able to mediate an antitumor effect. When combined with amiloride analogs, both hypoxia46 and hyperthermia,47 which reduce the extracellular pH, exhibited an antitumor effect.
The amiloride analog HMA is one of many in which substitution of the amino group at ring position 5 of the pyrazine ring has resulted in increased potency and specificity compared with amiloride itself.12,13 Indeed, HMA is more than 500 times more potent than amiloride and exhibits little or no inhibition on the Na+ channel or the Na+/Ca+exchanger.13 In addition, like amiloride, HMA appears to inhibit the exchanger when cells exhibit a high pH (more than 8.0). Therefore, the higher the pHi, the more effective the inhibitor. This is probably also the reason for the lower and differential apoptosis effect of HMA on normal cells compared with leukemic cells. We would also expect that when the intracellular H+ ion concentration increases as a result of NHE1 inhibition by HMA, a concomitant decrease in Na+ ion concentration occurs, and this has indeed been observed.48 49 Finally, studies on the mechanism by which HMA induces apoptosis have indicated that this is a stress-activated process (manuscript submitted).
In summary, we have demonstrated for the first time a clear correlation between modulation of pHi and an increased number of cells in S-phase on the one hand and apoptosis on the other. Although we would expect normal cells, especially proliferating cells, to be affected by treatment with HMA, a differential sensitivity and the pro-apoptotic effect of HMA on leukemic cells was demonstrated. This study therefore lays the groundwork for exploration of the novel and potential antileukemic properties of NHE1 inhibitors.
Supported by the Department of Defense Sponsored Program 18 190-F103, the South Carolina Cancer Center, and Palmetto Richland Memorial Hospital, Columbia, SC.
Reprints:Ivan N. Rich, Division of Transplantation Medicine, South Carolina Cancer Center, Palmetto Richland Memorial Hospital, 7 Richland Medical Park, Columbia, SC 29203; e-mail:ivan.rich@rmh.edu.
The publication costs of this article were defrayed in part by page charge payment. Therefore, and solely to indicate this fact, this article is hereby marked “advertisement” in accordance with 18 U.S.C. section 1734.

