Abstract
In sickle cell disease (SCD), loss of erythrocyte membrane phospholipid asymmetry occurs with the exposure of phosphatidylserine (PS), which provides a docking site for coagulation proteins. In vivo sickling/desickling, with resulting red cell membrane changes and microvesicle formation, appears to be one of the factors responsible for PS exposure. We evaluated children with SCD homozygous for sickle hemoglobin (SS disease) and controls (n = 65) and demonstrate that high levels of fetal hemoglobin (assessed as F cells) are associated with decreased microvesicle formation, PS exposure, and thrombin generation. F cells correlated inversely with both microvesicles and PS positivity (P < .000001) in SS disease. Multiple regression analyses using various hematologic parameters as independent variables, and either microvesicles or PS positivity as the dependent variable, showed a strong relationship only with F cells. Additionally, plasma prothrombin fragment F1.2 levels (a marker for thrombin generation) correlated with both PS positivity (P < .001) and F cells (P < .01). An F-cell level of approximately 70% was associated with normal levels of prothrombin fragment F1.2 and with microvesicle formation indistinguishable from control values. We suggest that the use of such surrogate biologic markers in conjunction with F-cell numbers may provide valuable insights into the biology and consequences of in vivo sickling.
The loss of normal membrane phospholipid asymmetry with the appearance of phosphatidylserine (PS) on cell surfaces is associated with numerous pathophysiologic consequences.1Such changes have been documented to occur in vivo on erythrocytes from patients with hemolytic anemias, including sickle cell disease (SCD)2-7 and the thalassemias.8,9 Potential consequences of erythrocyte PS exposure in these hematologic disorders include an exacerbation of the anemia owing to enhanced phagocytic recognition and removal of PS-positive erythrocytes, cell apoptosis, and activation of coagulation because surface PS provides a “docking site” for the involved hemostatic proteins.1,3,10 In normal red cells, the cooperative action of an adenosine triphosphate–dependent aminophospholipid translocase or flippase (which transports PS and phosphatidylethanolamine from the outer to inner membrane surface)11,12 and a nonspecific floppase13 (which flops phospholipids from the inner to outer monolayer) contributes to the maintenance of normal membrane phospholipid asymmetry.14,15 In contradistinction, scrambling of the phospholipid distribution and PS exposure on the cell surface can be rapidly induced by a calcium-dependent scramblase.12,16 While at physiologic cytoplasmic calcium concentrations, the activities of flippase and floppase maintain membrane phospholipid asymmetry, at high levels of cytoplasmic Ca++, scramblase is rapidly activated, leading to scrambling of the lipid bilayer and consequent PS exposure.1,10 Recent studies, using annexin V (a calcium-dependent phospholipid-binding protein) and flow cytometric analyses, have shown the presence of PS on mature erythrocytes, reticulocytes, and transferrin-receptor–positive “stress” reticulocytes in patients with SCD.6,7,17 While it remains unclear why some precursor cells are released into the circulation with PS on their surface, repeated in vivo sickling/desickling with polymerization/depolymerization of sickle hemoglobin (HbS) and resultant erythrocyte membrane changes and microvesicle or spicule formation are likely to be one of the causes for this abnormal red cell PS exposure.3 Other factors, including reduced flippase activity,18 membrane oxidative damage,19,20 and increased levels of intracellular calcium,21 may also play a role in the disruption of phospholipid membrane asymmetry observed in sickle red blood cells (RBCs).
Fetal hemoglobin (HbF) inhibits polymerization of HbS owing to the glutamine residue at γ-87, which prevents a critical lateral contact in the double strand of the sickle fiber.22 In individuals with SCD and high levels of HbF, in vivo sickling/desickling and, consequently, erythrocyte membrane vesiculation and procoagulant PS exposure should theoretically be prevented. Since infants with SCD manifest high levels of HbF during infancy and early childhood, we have used this physiologically unique period of time to test our hypothesis. We postulate that, in infants with SCD and elevated levels of HbF, procoagulant PS-positive red cells and microvesicles will be absent or markedly decreased. In contradistinction, in the older child, as levels of HbF decline physiologically, PS-positive red cells and red cell vesicles will appear in the circulation, concomitant with activation of coagulation.
Materials and methods
Materials
Phycoerythrin (PE)-labeled mouse monoclonal antibody against human glycophorin A (anti–glycophorin-A PE, clone 11E4B7.6 [KC16]), fluorescein isothiocyanate (FITC)-labeled mouse monoclonal antibody against human HbF (anti-HbF FITC, clone MBF-F), and the isotypic control antibodies (clones 679.1Mc7 and U7.27) were obtained from Immunotec (Beckman-Coulter, Miami, FL) or Wallac-Isolab (Akron, OH). Anti-HbF PE (clone MBF-F) was a generous gift from Dr T. Campbell (Wallac-Isolab). Annexin V–FITC was purchased from R&D Systems (Minneapolis, MN). The calcium ionophore A23187 was obtained from Calbiochem-Behring (La Jolla, CA).
Collection of blood
Venous blood was obtained from 17 to 45 infants and children with SCD homozygous for HbS (SS disease) in steady state (ages 1 month to 19 years) and 20 age-matched controls. Patients were considered to be in steady state if they were afebrile, had not been hospitalized or transfused within 8 weeks, and had had no vaso-occlusive episode for at least 10 days prior to or after blood sampling. Blood was drawn by a well-trained phlebotomist using a 2-syringe technique. This study was reviewed and approved by the Institutional Review Committee for the protection of human subjects at St Christopher's Hospital for Children and Thomas Jefferson University. Blood was obtained from subjects following informed consent. For minors, the patient's assent, where appropriate, was obtained in addition to parental permission. For flow cytometry analyses of red cell microvesicles, PS positivity, and F cells, blood (400 μL) was collected, with sodium heparin used as the anticoagulant, and assessed within 2 to 20 hours after collection. For samples, which were assayed for prothrombin fragment F1.2, blood (300 μL) was collected in sodium citrate (11 mmol/L final concentration). Plasma was separated by centrifugation at 750g for 10 minutes at room temperature, followed by a second spin for 10 minutes at 11 500g at 4°C. All plasma samples were frozen at −80°C until being assayed for F1.2 levels. For measurement of hematologic parameters, including hemoglobin, HbF, white blood cell (WBC) count, and reticulocyte count, blood (300 μL) was collected in EDTA.
Flow cytometric analysis of F cells
F-cells, a subpopulation of erythrocytes containing HbF, were analyzed as previously described.23 24 In brief, a sample of packed red cells (20 to 50 μL) was fixed with 4% formaldehyde (wt/vol) in Dulbecco's phosphate buffered saline (DPBS) for 45 minutes at room temperature. The cells were sedimented at 300g and treated sequentially at −20°C with 1 mL of acetone:water (1:1, vol/vol), acetone, and acetone: water (1:1, vol/vol). One million fixed and permeabilized red cells (in a total volume of 100 μL) were incubated with 5 μL of FITC-labeled anti-HbF for 30 minutes at room temperature in the dark, washed, suspended in 1 mL of DPBS, and analyzed immediately in a Becton Dickinson Flow Cytometer (Becton Dickinson Immunocytometry Systems, San Jose, CA) equipped with a 15 mW, 488 nm, air-cooled argon-ion laser, and formatted for 1-color analysis at a flow rate of 300 to 500 cells per second. Data from 50 000 events were collected and analyzed with the use of CELLQuest software (Becton Dickinson). Nonspecific membrane immunofluorescence was determined with the use of fixed, permeabilized red cells stained with FITC-labeled negative isotypic control antibody.
Flow cytometric analyses of microvesicles and PS-positive erythrocytes
Previous studies have shown the feasibility of using annexin V–FITC as a flow cytometry tool to detect a subpopulation of PS-positive red cells in various hematologic disorders.6,7,9,25 26 We employed this methodology to assess, in whole blood, both PS-positive red cell microvesicles and total numbers of PS-exposing red cells. Anticoagulated whole blood (5 μL) was incubated for 30 minutes at room temperature with 20 μL of anti–glycophorin-A PE and 10 μL annexin V–FITC in the presence of either 2.5 mmol/L CaCl2or 2.5 mmol/L EDTA in a total volume of 100 μL adjusted with HBSS-HEPES buffer (Hanks balanced salt solution [HBSS] buffered with 5 mmol/L HEPES [N-2-hydroxy-ethylpiperazine-N′-2-ethanesulfonic acid]). Incubation mixtures were then diluted with 1 mL HBSS-HEPES buffer containing either 2.5 mmol/L CaCl2 or 2.5 mmol/L EDTA and analyzed in a flow cytometer formatted for 2-color analysis. Annexin V was used as a marker for PS positivity, while anti–glycophorin-A was employed as a marker for intact red cells and red-cell–derived microvesicles. Fluorescence compensation settings were established with the use of blood samples stained with anti–glycophorin-A PE alone, annexin V–FITC alone, PE-labeled isotopic negative control antibody, and annexin V–FITC in the presence of EDTA. Data from 60 000 events were collected and analyzed. Calcium ionophore–activated control red cells (1 × 10⁶PS-positive red cells) that were stained with annexin V–FITC in the presence of either 2.5 mmol/L CaCl2 or 2.5 mmol/L EDTA were routinely used as positive and negative controls for annexin V binding.
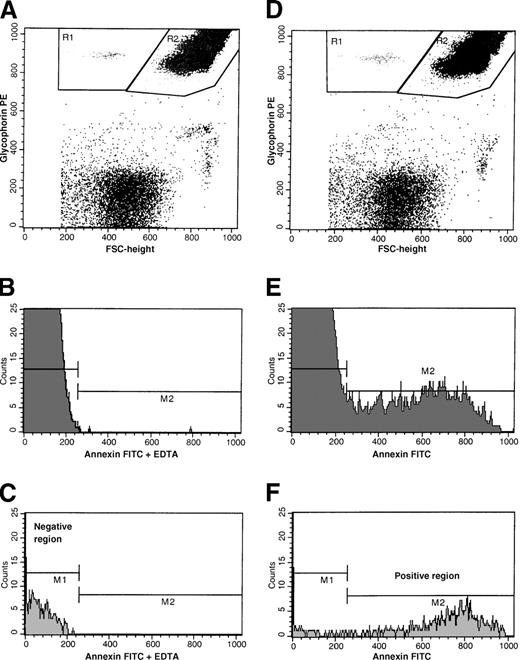
Intact red cells and RBC-derived microvesicles were identified by their size as assessed by forward light scatter and distinct glycophorin-A–positive immunofluorescence. As shown in Figure1A and 1D, with the use of dot plots of PE-fluorescence and forward size scatter, glycophorin-A–positive events were separated from glycophorin-A–negative (ie, non–red-cell) events. Glycophorin-A–associated responses were identified as either microvesicle-, or intact red-cell–associated events (R1 and R2, respectively). Annexin V–positive cells in these regions were determined from the respective histograms of annexin V–FITC fluorescence as shown in Figure 1E-F. Negative histogram regions were set with the use of samples stained with annexin V–FITC in the presence of EDTA (Figure 1B-C). Nonspecific membrane immunofluorescence was determined with the use of cells stained with anti–glycophorin-A PE and annexin V–FITC in the presence of EDTA, and these minimal values were subtracted from the respective sample fluorescence. Red cell parameters evaluated included glycophorin-A–positive microvesicles, PS-positive and glycophorin-A–positive microvesicles, and total glycophorin-A–positive and PS-positive events. These latter parameters were determined with the use of the relationships given below:
Flow cytometric analyses of a whole blood sample from a representative patient with SCD stained with annexin V–FITC and glycophorin-A PE in the presence of either calcium or EDTA.
(A) Dot plot of forward size scatter versus glycophorin-A–PE fluorescence stained in the presence of EDTA. Regions R1 and R2 represent red-cell microvesicle–associated and intact-erythrocyte–associated events, respectively. (B) Histogram of annexin V–FITC fluorescence of intact erythrocytes stained in the presence of EDTA. (C) Histogram of annexin V–FITC fluorescence of red cell vesicles stained in the presence of EDTA. Gate M2 represents annexin V–FITC–positive events. (D) Dot plot of forward size scatter versus glycophorin-A–PE fluorescence stained in the presence of calcium. Regions R1 and R2 represent red-cell microvesicle–associated and intact erythrocyte-associated events, respectively. (E) Histogram of annexin V–FITC fluorescence of intact erythrocytes stained in the presence of calcium. (F) Histogram of annexin V–FITC fluorescence of red cell vesicles stained in the presence of calcium. Gate M2 represents annexin V–FITC–positive events.
Flow cytometric analyses for PS-positive F cells and non-F cells
To assess whether F cells exhibited abnormal PS exposure, in additional studies annexin V–FITC–labeled red cells were stained with anti-HbF PE, as described above and analyzed in a flow cytometer formatted for 2-color analysis. PS-positive F cells and non-F cells were determined with the use of dot plots of FITC and PE fluorescence.
Analysis of prothrombin fragment F1.2
Plasma levels of F1.2 were measured with a commercially available enzyme–linked immunosorbent assay kit (Dade Behring Marburg, Marburg, Germany).
Analysis of hemoglobin, reticulocytes, WBCs, and HbF
Hemoglobin values and WBC counts were obtained by routine measurements in a Coulter Counter, model Stk S (Coulter, Hialeah, FL). Hemoglobin F levels were assayed by means of a commercially available Radial Immunodiffusion Assay Kit (Helena Laboratories, Beaumont, TX). For reticulocyte enumeration, aliquots of blood samples were stained with methylene blue and counted manually by a standard technique.
Data analysis
Statistical evaluation was performed with the Sigmastat Statistical Package (Jandel Scientific, San Rafael, CA). Both Pearson and Spearman correlation tests were employed to determine the relationship between 2 variables. The relationship between HbF and F cells was assessed by means of a polynomial regression. Both forward and backward stepwise regression analyses were performed with the use of rank-transformed data in a multiple regression model to determine the dependency of red cell microvesicle formation or PS exposure on a variety of hematologic parameters.
Results
Glycophorin-A–positive microvesicles and their relationships
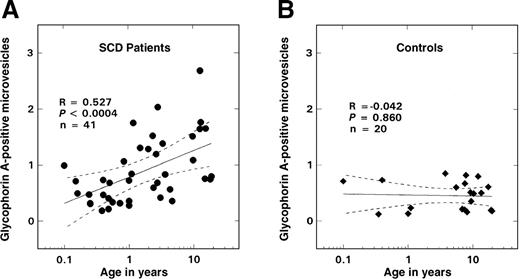
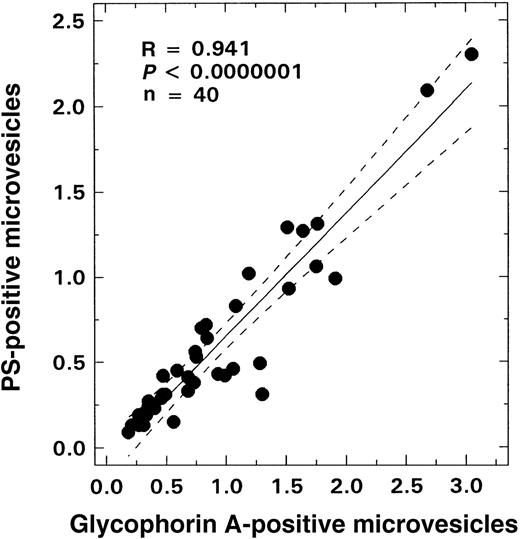
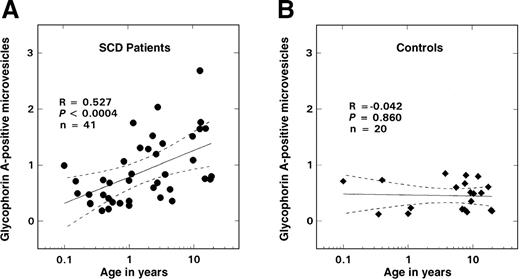
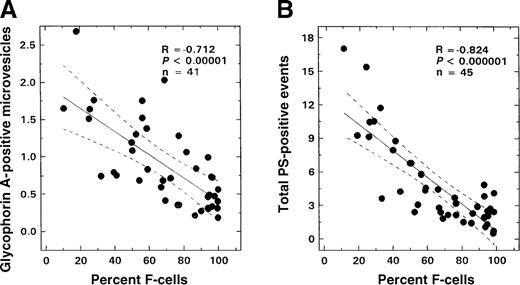
As shown in Figure 2B, there was no age-related change in the number of glycophorin-A–positive vesicles observed in the control population; values remained at basal levels for all ages evaluated (0.45 ± 0.26%, mean ± SD, n = 20). In contrast, in SS disease a positive correlation between age and vesicle formation was noted (Figure 2A; R = 0.527, P < .0004, n = 41), with values similar to controls in the infant and young child but increasing in older children. Almost all of these glycophorin-A–positive vesicles were PS-positive (Figure3; R = 0.94, P < .0001, n = 41). A striking inverse relationship was observed between the levels of vesicles and F cells (Figure 4A; R = −0.712, P < .00001, n = 41). Correlations were also noted between the levels of vesicles and various other hematologic parameters, including hemoglobin (R = −0.48, P < .002), WBC count (R = 0.51, P < .007), and reticulocyte count (R = 0.61,P < .00006) as assessed by means of the Pearson test (n = 41). Similar correlations were also observed when the data were analyzed by means of the Spearman test. Multiple regression analyses were, therefore, performed on rank-transformed data in order to determine the hematologic parameter(s) that modulated the production of microvesicles; the percentage of glycophorin-A–positive vesicles was entered as the dependent variable and F cells, hemoglobin, WBC count, reticulocyte count, and age were entered as independent variables. A significant relationship was noted with F cells (R = 0.713, R2 = 0.509,P < .0001), which was the only independent variable that stayed in the model.
Relationship between glycophorin-A–positive microvesicles and age.
The solid lines represent the linear-regression fit to the data, while the dotted lines represent the 99% confidence interval curves. (A) Patients with SS disease. (B) Controls.
Relationship between glycophorin-A–positive microvesicles and age.
The solid lines represent the linear-regression fit to the data, while the dotted lines represent the 99% confidence interval curves. (A) Patients with SS disease. (B) Controls.
Relationship between glycophorin-A–positive microvesicles and PS-positive vesicles from patients with SS disease.
The solid line represents the linear-regression fit to the data, while the dotted lines represent the 99% confidence interval curves.
Relationship between glycophorin-A–positive microvesicles and PS-positive vesicles from patients with SS disease.
The solid line represents the linear-regression fit to the data, while the dotted lines represent the 99% confidence interval curves.
Relationship between F-cell numbers and glycophorin-A–positive microvesicles or total PS-positive events from patients with SS disease.
The solid line in each panel represents the linear-regression fit to the data, while the dotted lines represent the 99% confidence interval curves. (A) Glycophorin-A–positive microvesicles and F-cell numbers. (B) Total PS-positive events from patients with SS disease and F-cell numbers.
PS-positive red cells and their relationships
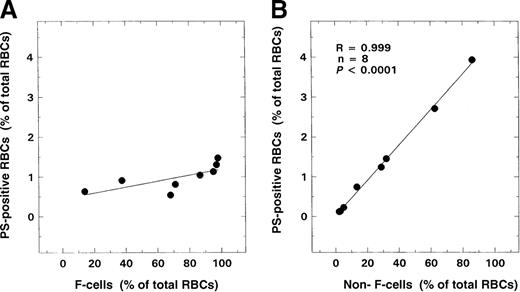
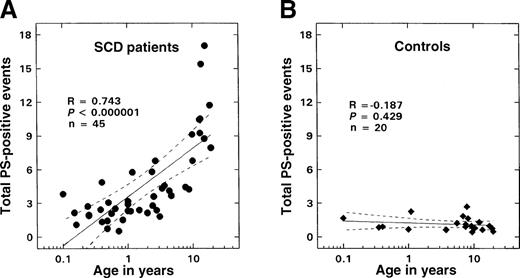
A positive correlation (R = 0.743,P < .000001, n = 45) was observed between the numbers of PS-positive and glycophorin-A–positive cells and age in patients with SCD (Figure 5A). No such correlation was noted in controls (Figure 5B). Minimal numbers of PS-positive erythrocytes were measured in control samples (1.13 ± 0.61%, n = 20). While values in infants and young children with sickle cell disease were not significantly different from those of controls, levels of these PS-positive erythrocytes were significantly increased in the older patient. An inverse relationship was observed between the numbers of PS-positive and glycophorin-A–positive cells and F cells (Figure4B; R = −0.824, P < .000001, n = 45). Correlations were also noted between the levels of PS-positive red cells and various other hematologic parameters including hemoglobin (R = −0.63, P < .0001), WBC count (R = 0.42,P < .005), and reticulocyte count (R = 0.62,P < .0001) as assessed by means of the Pearson test (n = 45). Similar correlations were also observed when the data were analyzed by means of the Spearman test. Multiple regression analyses were, therefore, performed on rank-transformed data with the use of a backward regression model in order to determine parameter(s) that modulated the formation of PS-positive red cells. In this regression model, the percentage of total PS-positive red cells was entered as the dependent variable, and F cells, hemoglobin, WBC count, reticulocyte count and age were entered as independent variables. Both F-cell numbers and age stayed in the model (R2 = 0.674). However, forward regression analyses demonstrated that the predominant variable that influenced the formation of PS-positive red cells was F-cell number (R2 = 0.616). In the additional studies conducted to assess whether F cells exhibited abnormal PS exposure, as shown in Figure 6A, minimal PS positivity (0.8% to 1.5%) similar to the control range was noted in the F-cell fraction. In contrast, a significant positive correlation was noted with the non-F–cell fraction (Figure 6B; R = 0.999,P < .0001).
Relationship between total PS-positive events and age.
The solid lines represent the linear-regression fit to the data, while the dotted lines represent the 99% confidence interval curves. (A) Patients with SS disease. (B) Controls.
Relationship between total PS-positive events and age.
The solid lines represent the linear-regression fit to the data, while the dotted lines represent the 99% confidence interval curves. (A) Patients with SS disease. (B) Controls.
Relationships of F cells and non-F cells to PS positivity.
RBCs from 8 patients with SS disease were analyzed for F-cell and non-F–cell level and their respective relationships to PS positivity. (A) F cells and PS positivity. (B) Non-F cells and PS positivity.
Relationships of F cells and non-F cells to PS positivity.
RBCs from 8 patients with SS disease were analyzed for F-cell and non-F–cell level and their respective relationships to PS positivity. (A) F cells and PS positivity. (B) Non-F cells and PS positivity.
Prothrombin fragment F1.2
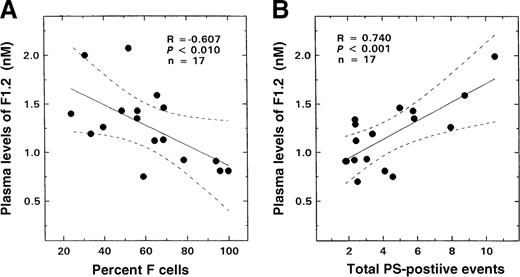
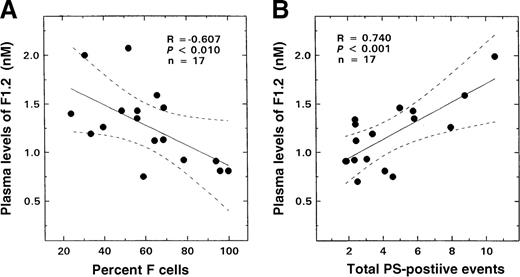
Results similar to those seen with glycophorin-A–positive or red-cell–derived vesicles and total PS-positive erythrocytes were also observed when the F1.2 data were analyzed for F-cell–related correlates. An inverse correlation was noted between F1.2 levels and F-cell numbers (Figure 7A; R = −0.607, P < .01, n = 17). A striking positive relationship was observed between plasma levels of this marker and both glycophorin-A–positive microvesicles (R = 0.607,P < .01, n = 17) and total PS-positive and glycophorin-A–positive events (Figure 7B; R = 0.74,P < .001, n = 17).
Relationship between the plasma levels of F1.2 from patients with SS disease and F-cell numbers and total PS-positive events.
The solid lines represent the linear-regression fit to the data, while the dotted lines represent the 99% confidence interval curves. (A) F-cell numbers and plasma levels of F1.2. (B) Total PS-positive events and plasma levels of F1.2.
F cells
The relationship between F-cell numbers and HbF was best described with a third-order equation, a polynomial fit similar to that previously described.27 As expected, a negative correlation between age and F cells was observed (R = −0.843,P < .000001), with values similar to those previously reported.28
Discussion
The level of fetal hemoglobin has played a key role in the clinical course of the individual with sickle cell disease.29 High levels of HbF have been correlated with longer life expectancy30 and a decrease in vaso-occlusive episode rate.31 Additionally, a landmark randomized double-blind placebo-controlled clinical trial showed that hydroxyurea (which elevates HbF) ameliorated the clinical course of adults with SCD, decreasing both the rate of painful vaso-occlusive crises and the life-threatening complication of acute chest syndrome.32The inhibition of polymerization of HbS by fetal hemoglobin could potentially have several additional beneficial effects in vivo. Since SCD is a thrombophilic state with evidence for in vivo thrombin generation, endothelial activation, and a clinically evident thrombotic predisposition,33-36 any protective effect of HbF on in vivo thrombin generation would be of clinical import. Additionally, since recent preliminary evidence suggests a role for PS in red-cell–endothelial adhesion,37 HbF by inhibiting red cell PS exposure could modulate the adhesion process. Our report details the results of an attempt to use the unique window of opportunity during the life of the individual with SCD when physiologic levels of HbF are high, to assess for any potential relationships between this important “protective” hemoglobin and the previously discussed pathologic markers, ie, erythrocyte PS positivity, red cell microvesicle formation, and coagulation activation. Since HbF in general is not distributed homogeneously throughout all red cells but is restricted to a subpopulation of erythrocytes termed F cells, we have used F-cell numbers in lieu of HbF levels for all studies reported here.
Our results demonstrate that F cells correlated inversely with both microvesicle formation and PS positivity (Figure 4;P < .00001). Multiple regression analyses with erythrocyte vesicle formation as the dependent variable, and age, hemoglobin levels, WBC counts, reticulocyte counts, and F cells as independent variables, demonstrated a strong relationship only with F cells, which was the sole variable that stayed in the model. A similar multiple regression analyses with PS positivity as the dependent variable demonstrated that while both F cells and age showed significant relationships with erythrocyte PS, F-cell numbers were the dominant factor (R2 = 0.616), with age adding only a relatively minor contribution to the correlation observed (δR2 = 0.063). These findings suggest that F cells are less likely to be associated with either vesicle formation or PS positivity. In addition, analyses of both F cells and non-F cells for PS positivity revealed that in individual subjects, increasing PS positivity was observed concomitant with increasing non-F–cell numbers. In contrast, F cells showed minimal PS positivity over a wide range of F-cell levels (10% to 95%) in the individual patient with SS disease (Figure 6).
While a protective effect of F cells on membrane bilayer flip-flop and PS exposure was thus observed, together with more indirect evidence suggestive of an inverse correlation between F cells and microvesicle formation, several other points are worth noting. As demonstrated in Figure 3, whereas the majority of erythrocyte membrane vesicles were PS-positive, these vesicles accounted for approximately 20% of the total number of PS-positive cells, with the majority of annexin V binding sites being present on normal-sized erythrocytes as shown by fluorescence activated cell sorter analyses. Additionally, in the multivariate analyses, since both F-cell numbers and age demonstrated correlations with PS exposure on the red cell surface, the loss of phospholipid asymmetry appears to be due to multiple etiologies of which in vivo sickling/desickling with the release of erythrocyte flip-flopped PS-positive vesicles is only one cause. In their study of erythrocyte PS exposure and membrane phospholipid asymmetry in patients with thalassemia, Kuypers et al9 observed that splenectomized patients had some of the highest levels of PS recorded in their thalassemic patient group, although no definitive conclusion regarding the effect of splenectomy on PS exposure was reached. Since macrophages recognize PS expressed on the surface of the circulating cellular components of blood, the functional hyposplenism observed in patients with homozygous SS disease may permit the circulation of PS-positive cells, which, under normal circumstances, would have triggered specific recognition and removal by macrophages.38 Functional hyposplenism usually manifests itself in homozygous SS disease within the first 2 years of life in the majority of patients.39 Our data (Figure 5A) suggest, however, that abnormal levels of red cell PS progressively increase even beyond the age of 10 years, suggesting a pattern of production not consistent solely with a hyposplenic age-related effect.
The consensus regarding coagulation activation in patients with SCD is that in vivo thrombin generation is present both in steady state and during vaso-occlusive crises, ie, irrespective of the patient's clinical status.33,35,36,40 While the role of coagulation mechanisms in the genesis of the vaso-occlusive crisis is inconclusive, recent evidence suggests that disordered hemostatic mechanisms may play a role in the long-term vascular complications of this disease. While some investigators have shown no relationship between cerebrovascular events and tests of either in vivo thrombin generation or the inhibitors of coagulation,41 another preliminary report has suggested a relationship between an increased risk for stroke (as indicated by high transcranial Doppler velocities) and levels of prothrombin fragment F1.2 and proteins C and S.42 The elegant work of Zwaal and coworkers1,3 10 has delineated the hemostatic consequences resulting from the loss of normal membrane phospholipid asymmetry. Surface PS exposure has provided a “docking site” for hemostatic proteins, such as tenase and the prothrombinase complexes, and the exposure of this reactive anionic phospholipid on the erythrocytes of patients with SCD has been suggested as the main factor responsible for the in vivo activation of coagulation observed both in crises and steady state. Our study has provided the unique opportunity to test this hypothesis. We monitored in vivo thrombin generation (as assessed by prothrombin fragment F1.2) concomitant with levels of F cells, erythrocyte microvesicles, and erythrocyte PS positivity, and our preliminary data suggest a significant correlation between PS positivity and in vivo thrombin generation, with a further inverse relationship between F1.2 levels and F-cell numbers.
Although we have not demonstrated a direct protective effect of HbF against erythrocyte microvesicle or spicule formation and PS exposure, we have shown that patients with higher levels of F cells have a concomitant decrease in the numbers of microvesicles and PS-positive cells. Additionally, in the individual subject, while F cells either were negative for PS or showed minimal PS exposure, PS positivity increased with increasing levels of red cells that were negative for HbF. These data suggest that fetal hemoglobin modulates erythrocyte microvesicle formation, PS exposure, and in vivo thrombin generation. In this regard, it is of interest to note that in our study an F-cell level of approximately 70% in subjects with SS disease was associated with normal F1.2 levels and with red cell microvesicle formation indistinguishable from control values. Whether the use of such biologic markers in conjunction with F-cell numbers will prove relevant to the vascular pathophysiology of SCD can be evaluated only in clinical trials using such agents as hydroxyurea in an attempt to halt the postnatal decline in HbF. Our study attempts to provide a novel approach to the study of the biology and consequences of in vivo sickling, particularly as they relate to the infant and child with homozygous SS disease.
Acknowledgments
The authors thank Dr T. Campbell for his generous gift of anti-HbF; Dr Ling Sun for her technical assistance; and Patricia O'Neal, Miriam Gilday, and Sandra Moss for sample procurement.
Supported by grants HL51497 and 1P60HL62148 from the National Heart, Lung and Blood Institute, National Institutes of Health, Bethesda, MD.
Reprints:B. N. Yamaja Setty, Department of Pediatrics, Thomas Jefferson University, 1025 Walnut St, Suite 727, Philadelphia PA 19107; e-mail: yamaja.setty@mail.tju.edu.
The publication costs of this article were defrayed in part by page charge payment. Therefore, and solely to indicate this fact, this article is hereby marked “advertisement” in accordance with 18 U.S.C. section 1734.


