Abstract
To elucidate the molecular mechanism of all-trans-retinoic acid (ATRA)–induced differentiation of acute promyelocytic leukemia (APL) cells, the gene expression patterns in the APL cell line NB4 before and after ATRA treatment were analyzed using complementary DNA array, suppression-subtractive hybridization, and differential-display–polymerase chain reaction. A total of 169 genes, including 8 novel ones, were modulated by ATRA. The ATRA-induced gene expression profiles were in high accord with the differentiation and proliferation status of the NB4 cells. The time courses of their modulation were interesting. Among the 100 up-regulated genes, the induction of expression occurred most frequently 12-48 hours after ATRA treatment, while 59 of 69 down-regulated genes found their expression suppressed within 8 hours. The transcriptional regulation of 8 induced and 24 repressed genes was not blocked by cycloheximide, which suggests that these genes may be direct targets of the ATRA signaling pathway. A balanced functional network seemed to emerge, and it formed the foundation of decreased cellular proliferation, maintenance of cell viability, increased protein modulation, and promotion of granulocytic maturation. Several cytosolic signaling pathways, including JAKs/STAT and MAPK, may also be implicated in the symphony of differentiation.
Introduction
Acute promyelocytic leukemia (APL) is an interesting model in the study of human cancer because it is the first human malignancy that can be effectively treated with a cell differentiation inducer, all-trans-retinoic acid (ATRA). During the last decade, it was uncovered that the promyelocytic leukemia–retinoic acid response-α (PML/RARA) fusion gene, which was generated as a result of the APL-specific chromosome translocation t(15;17)(q22;q21) (translocation involving breaks at chromosome 15, long arm, band 22, and chromosome 17, long arm, band 21), plays a central role in leukemogenesis.1 On one hand, the creation of PML/RARA disrupts the normal location of the PML nuclear body or oncogenic domains (PODs)2,3 and interferes with the function of PML for growth inhibition and apoptosis regulation.4,5 On the other hand, the RARA/RXR pathway, which is indispensable to the granulocytic differentiation, was also damaged due to the sequestration of RXR by heterodimerization with PML/RARA.6 Moreover, both PML/RARA and RARA can interact with a large ubiquitous nuclear corepressor (N-CoR) complex (N-CoR/mSin3A/HDAC) by forming PML/RARA-CoR or RARA-CoR complexes.
Unlike the RARA-CoR complex, the PML/RARA-CoR complex is more stable and resistant to physiological ATRA treatment. PML/RARA competes with RARA for binding to the retinoic acid response elements (RAREs) of target genes and mediating the transcriptional repression through histone deacetylation by the CoR complex.7-13Pharmacological doses of ATRA could trigger the degradation of PML/RARA and the reassembly of PODs.14 More recently, ATRA has been shown to cause a distinct conformational change of PML/RARA. This results in release of the CoR complex and subsequent recruitment of a coactivator (CoA) complex (CBP/P300, P/CAF, NcoA-1/SRC-1, P/CIP, and ACTR) and converts PML/RARA from transcription repressor to transcription activator. In contrast, the association of CoR with PLZF/RARA, a fusion receptor associated with an APL phenotype resistant to ATRA, could not be modulated by the ligand, even at very high concentrations.7-13 These findings further strengthen the concept that ATRA-induced differentiation is a novel cancer therapy based on transcriptional regulation.
Although the interaction between ATRA and the aberrant and wild type RAR-CoR/CoA complexes was largely elucidated, the molecular events downstream of the RAR complexes were still unclear. Therefore, using the ATRA-sensitive APL cell line NB415 as an in vitro model, we undertook a study based on methods allowing relatively large-scale transcriptional expression analysis to identify gene expression patterns in APL cells upon treatment with ATRA. A total of 169 genes, including transcriptional factors, signal transduction modulators, cell cycle promoters and inhibitors, and protein modulators, were confirmed to be ATRA-modulated and to form a harmonious network in the course of the ATRA-induced NB4cell differentiation.
Materials and methods
Cell culture
Retinoid acid (RA)-sensitive NB4 cells were cultured under conditions previously described.16 The in vitro culture contained 1 μmol/L ATRA. For the cycloheximide inhibition test, NB4 cells were treated with 10 μg/mL cycloheximide for 30 minutes before ATRA addition and throughout the ATRA treatment. Total RNAs were extracted at indicated time-points using the Trizol reagent (Gibco BRL Life Technologies, Grand Island, NY). PolyA+ RNAs were purified using the Oligotex mRNA (messenger RNA) Kit (Qiagen, Hilden, Germany). Cell differentiation was evaluated for cell morphology changes using Wright's staining, CD11b expression, and the nitroblue tetrazolium (NBT, Sigma Chemical Co, St Louis, MO) reduction test.17,18 For the detection of cell cycle, the cells were stained with propidium iodide (PI) (Sigma) and analyzed by a fluorescence-activated cell sorter (FACS).19PML/RARA degradation was studied by indirect immunofluorescence with rabbit antihuman PML polyclonal antibodies.14
Differential display-PCR
Differential display (DD)-PCR was performed with the Delta TM Differential Display Kit (Clontech Laboratories, Palo Alto, CA) following the instructions of the manufacturer. Reverse transcription reaction was performed with 2 μg total RNA, 1 μL complementary DNA (cDNA) synthesis primer (concentration, 1 μmol/L), and ribonuclease (RNase) free water to a total volume of 5 μL. After incubation for 3 minutes at 70°C, 2 μL 5 × first-strand buffer, 2 μL dNTP (deoxy nucleoside 5′-triphosphate) mix (total concentration, 5 mmol/L), and 1 μL MMLV-RT (reverse transcriptase) (concentration, 200 U/mL) were added and incubated for 1 hour at 42°C in an air incubator. The reactions were terminated by incubating for 10 minutes at 75°C before storage at 4°C. PCR amplification of a given reverse transcription reaction was carried out in duplicate. A 1-μL RT product was used for each subsequent PCR in a mixture (total volume, 20 μL) containing 1 × KlenTaq PCR reaction buffer, 50 μmol/L dNTP mix, 50 nmol/L α–33P-dATP (deoxy adenosine 5′-triphosphate), and 0.4 μL Advantage KlenTaq Polymerase with a different combination of 19 primers. The following PCR reactions were performed: 1 cycle of 5 minutes each at 94°C, 40°C, and 68°C; 1 cycle of 30 seconds at 94°C, 30 seconds at 40°C, and 5 minutes at 68°C; 23 cycles of 20 seconds at 94°C, 30 seconds at 60°C, and 2 minutes at 68°C; and an additional 7-minute cycle at 68°C. The amplified cDNAs were separated on 6% polyacrylamide sequencing gels. A total of 30 differentially expressed bands were obtained and subjected to further analysis.
Construction of cDNA libraries using suppression-subtractive hybridization
Suppression-subtractive hybridization (SSH) was performed according to the user's manual (Clontech). The FORWARD library for isolating up-regulated genes was obtained by using cDNA of the NB4 cells treated with ATRA for 48 hours as a “tester,” while cDNA of untreated NB4 cells was used as a “driver.” The REVERSE library for identifying down-regulated genes was constructed by replacing the cDNA of untreated cells as a “tester,” while cDNA of NB4 cells treated with ATRA for 48 hours was used as the “driver.”
Differential screening of subtractive library
As indicated by the manufacturer's protocol, 4 × 96 (384) clones from the FORWARD subtracted library were dotted in duplicate on nylon membranes and hybridized with α–32P–labeled unsubtracted cDNA probes (tester and driver) as well as subtracted cDNA probes (FORWARD and REVERSE) to minimize the false-positive clones before embarking further confirmation. Genes showing equal hybridization signals were ruled out, while genes with different signals or without any signal were further investigated.
cDNA array
Membranes with 588 known genes (Clontech) were used, and hybridization was performed according to the manufacturer's recommendations using the RNA from 3 independent sets of ATRA-stimulated NB4 cells at an indicated time-point. The signals were analyzed on Altasvision software (Clontech) and normalized by the signal intensities of housekeeping genes. Only those genes with signal differences of more than 2-fold were considered as modulated.
Sequencing and bioinformatics analysis
Sequencing reactions were performed on a 9600 Thermal Cycler using the Dye Primer and Dye Terminator Cycle Sequencing Kit (Perkin-Elmer, Foster City, CA). All sequences were searched against GenBank and dbEST databases (version 108) for homology comparison by using the Genetics Computer Group (GCG) program package. The sequences were considered as part of the known genes if they shared 95% or more homology over at least a 100-bp (base pair) DNA sequence on the BLAST search. For those sequences representing previously unknown genes, GenBank and SWISSPROT searches were performed by using BLAST and FASTA. For those ESTs without significant homology, the motif search was carried out using the Blocks database, version 9.0 (http://www.blocks.fhcrc.org).
Northern blot analysis, semiquantitative RT-PCR, andreal-time quantitative RT-PCR
Northern blot analysis was performed as previously described.20 For semiquantitative RT-PCR, G3PDH was used as an internal control with the following primer sets: sense, 5′-TGA AGG TCG GAG TCA ACG GAT TTG GT-3′, and antisense, 5′-CAT GTG GGC CAT GAG GTC CAC CAC-3′. G3PDH and gene-specific primers were placed in a single tube. PCR was performed in 20-mL volumes using the Perkin-Elmer Cycler 480 (Perkin-Elmer) at the following conditions: 1 cycle for 5 minutes at 94°C; 20-30 cycles for 45 seconds at 94°C, 45 seconds at 56°C, and 1.5-2 minutes at 72°C. All RT-PCR reactions were repeated at least 3 times at different numbers of the extension cycle to avoid the false results of the PCR. The signals were normalized against 983-bp G3PDH using a densitometer. Triplicate real-time RT-PCR was performed using the ABI PRISM 7700 Sequence Detection System (Perkin-Elmer) with the same RNA templates of semiquantitative RT-PCR. β-Actin was coamplified as an endogenous control to standardize the amount of the sample RNA added to the reaction. The results of the indicated time-points after the ATRA treatments were plotted relative to the level at time zero.
Full-length cDNA cloning and sequencing
Two methods were used for full-length cDNA cloning: “in silico” cloning and the rapid amplification of the cDNA end (RACE). The in silico cloning started from novel cDNA sequences obtained in the current work, and overlapping dbEST sequences were assembled into contigs to get the open reading frames (ORFs), which were subject to further check by RT-PCR and subsequent sequencing. In RACE, self-made marathon-ready cDNAs were used as templates, and the touchdown PCR reaction was carried out according to the manufacturer's protocol. Candidate bands were cut and cloned into pGEM-T (Promega Company, Madison, WI) or pT-Adv vector (Clontech). The sequences were analyzed for possible ORFs using the Autoassembler and Strider 1.2 program. If necessary, further RACE walking was performed until a complete ORF was obtained.
Results
Identification of the genes modulated by ATRA in NB4 cells
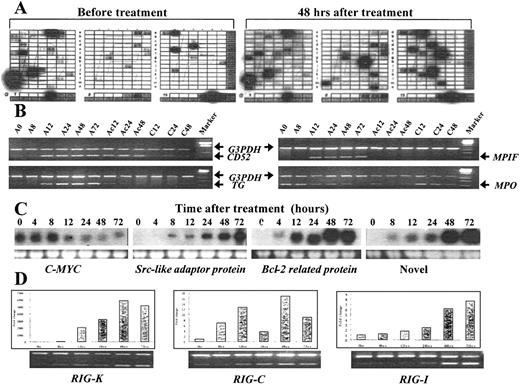
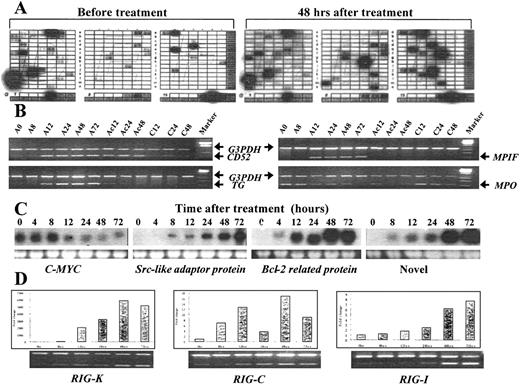
Using 3 techniques, a number of genes and cDNA clones were identified as being regulated in NB4 cells after treatment with ATRA for approximately 8-72 hours. Triplicated cDNA array analysis revealed a total of 99 of 588 (16.8%) “hot spot” known genes to be modulated with more than a 2-fold difference of expression levels between ATRA-treated NB4 cells and untreated cells (Figure1A). Among these 99 genes, 37 presented up-regulated signals, and 62 were down-regulated. The expression of 8 up-regulated genes and 2 down-regulated genes was confirmed by RT-PCR with coherent patterns (data not show). Using DD-PCR, 13 of 30 bands were identified and subsequently confirmed to represent genes with induced expression, while probes prepared from 7 of 30 bands gave signals of equal intensity before and after ATRA treatment, as detected by Northern blot analysis. Using Northern blotting, there were no signals in 10 of 30 bands.
The examples of 4 methods used to confirm ATRA-modulated genes in the differentiation of NB4 cells.
(A) A partial view of a cDNA array result by comparing the transcriptional expression pattern in untreated NB4 cells (left) with that in ATRA-treated NB4 cells (right). The signals of housekeeping genes appeared in the bottom as an internal control. (B) The results of semiquantitative RT-PCR. The up-regulation of CD52 and the down-regulation of myeloperoxidase seem to be protein synthesis–independent, while the up-regulation of transglutaminase and myeloid progenitor inhibitory factor was completely suppressed by the protein synthesis inhibitor cycloheximide. In the figure, A denotes ATRA; C, cycloheximide; and Ac, a combination of ATRA and cycloheximide. The number denotes hours after treatment. (C) The results of Northern blotting, with the lower panel showing the loading control (28s rRNA). (D) Relative mRNA levels of 3 novel genes (RIG-K, RIG-C, and RIG-I) were measured by semiquantitative RT-PCR and the Taq-man real-time quantitative PCR assay using the same samples. Data from theTaq-man analysis were normalized to mRNA concentrations according to the concentration of internal control actin and plotted relative to the level at time zero. The expression profiles of these genes, as measured by these 2 independent methods, were quite similar.
SSH gave rise to a total of 703 clones (660 from FORWARD and 43 from REVERSE). Sequence analysis of these clones led to an assembly of 316 contigs (278 from FORWARD and 38 from REVERSE), of which 159 were known genes; 25 were matched mitochondria DNA, ribosomal RNA, andAlu repeats; and 132 were novel sequence fragments. The 159 known genes were subject to further analysis using differential screening and semiquantitative RT-PCR. Of these 159 genes, 39.6% were confirmed to be modulated (55 induced and 8 repressed), whereas the remainder showed either equal expression patterns or no obvious signals. Among these regulated genes, 10 were further confirmed by Northern blotting, which showed a pattern similar to RT-PCR. All novel sequence fragments were also further examined with differential screening and RT-PCR, and 49 of 132 showed an ATRA-modulated expression.
The expression patterns of 3 novel genes were further studied by real-time quantitative RT-PCR assay, and they turned out to be highly similar to those from the semiquantitative RT-PCR assay (Figure 1D). Moreover, 2 methods, in silico cloning (dbEST version 108.0) and RACE, were carried out to acquire full-length cDNA from novel gene sequences. The sequences were confirmed by RT-PCR and/or Northern blot analysis as being modulated by ATRA. Thus, we obtained 8 cDNA containing putative ORFs according to bioinformatic analysis. Of the 8 cDNA, 5 showed significant homology to known genes with potential structural and/or functional importance, whereas 3 exhibited only limited homology to known genes. Table 1summarizes the major structural features of the 8 novel genes in the present work, temporarily under the name of RIG (retinoic acid–induced gene), and their nucleic acid sequences, as well as deduced amino acid sequences, are now available in GenBank.
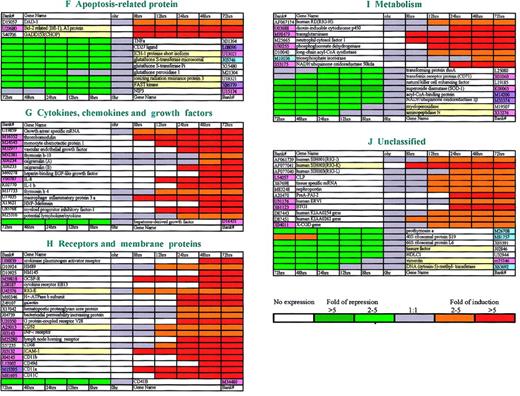
The overall results obtained using these 3 approaches seemed to be quite cohesive and complimentary. For example, RIG-E, RIG-G, and dioxin-inducible cytochrome P450 genes initially discovered by DD-PCR were also found to be up-regulated by SSH, whereas the induction of 16 genes, such as the monocyte chemoattractant protein (MCP), interleukin-8 (IL-8), the Src-likeadaptor protein, and Bfl-1, were revealed by both cDNA array and SSH. The advantage of combining the 3 different methods was based on the concept that each of them might reflect a gene expression profile from a particular angle. The cDNA array used in this work only covers 588 known genes. DD-PCR generates a partial view of gene expression, while SSH may allow a more global approach for identification of both known and novel genes, although the efficiency of the method (in this work, 38.5%) needs to be further improved. After integration of the results by different techniques, a total of 169 genes were identified as ATRA-responsive, including 100 up-regulated and 69 down-regulated genes (Figure2A-J).
Functional classification of genes modulated by ATRA during differentiation of NB4 cells.
A total of 169 ATRA-modulated genes (100 up-regulated and 69 down-regulated) are clustered into 10 groups (groups A-J) according to their functions. The expression pattern of each gene is displayed here as a horizontal strip, with the down-regulated genes on the left-hand side of the graph and the up-regulated ones on the right-hand side. For each gene, the ratio of mRNA levels in NB4 cells at the indicated time after ATRA treatment to its level in untreated (time zero) NB4 cells is represented by a color, according to the color scale at the bottom. Genes whose expression was resistant to cycloheximide are highlighted by using the yellow background in the column for gene names. Regarding genes also existing in Golub's system with Affymetrix chips, different colors were used to label the column of their accession numbers. The genes with the same expression pattern in both systems are painted in rose; those modulated in our system but not in Golub's are painted in sky-blue; while those with opposite patterns are painted in purple.
Functional categories of genes regulated by ATRA
The 100 up-regulated and 69 down-regulated genes by ATRA were classified into 10 categories according to their structures and/or functions (Figure 2A-J). Some transcription factors, such asc-JUN, ETR, ID-2, HOX-A1, and CEBPε, were found to be induced. Interestingly, one component of CoA,ACTR,21 was also included in this group as a relatively early induced gene (12 hours). Genes participating in several important signal transduction pathways, including JAKs/STAT, cAMP/PKA, PKC, and calmodulin, were modulated. Other notable categories of genes included those responsible for protein modulation, such asUAE122 and SUMO-123; for apoptosis resistance, DAD-1,24Bfl-1,25 and GADD15326; and p19INK4d andp21WAF1/CIP1 for cell cycle exit.27,28 A number of genes reported to possess the function of proliferation suppression, includingBTG1,29Src-like adaptor protein,30FGR,31 andLIMK,32 were also positively modified. The induced expression of some neutrophil function-related genes (eg,MCP-1,33 defensin, and X-CGD) may reflect biological activities needed in terminal granulocytic differentiation.
On the other hand, 69 down-regulated genes could be of functional importance in terms of cell growth regulation. Transcription factors known to be capable of promoting cell proliferation, includingc-MYC, NFκB, and GATA2,34 were down-regulated shortly upon effect of ATRA. A cluster of genes responsible for DNA synthesis, repair, and recombination were also down-regulated. With regard to cell cycle checkpoint transition, the expression of both cyclin A35andB136 was repressed. Of note, 3 families of mitogen-activated protein kinases, namely p38, JNK2, and ERK3, were all found with decreased levels of expression, suggesting that the MAPK/SAPK pathways could be transcriptionally modulated in favor of growth arrest. Some apoptosis agonists, such as the ICH-1L and FAST kinases, showed decreased levels of expression. In addition, myeloperoxidase, the cytoenzymatic marker of APL cells, was also down-regulated. It may be interesting to note that the expression of transcription factor AP-1 was biphasic because c-FOS was suppressed within 8 hours. This was followed by an increased expression at 24 hours, which coincided with the induction of c-Jun after 24 hours of ATRA treatment.
Identification of possible direct target genes of ATRA
We tried to find the genes whose transcriptional regulation was protein synthesis–independent and thus most likely represented target genes of RA receptors. By using the cycloheximide inhibition test, the response of 8 up-regulated genes to ATRA was not abolished by protein synthesis antagonist. That all these genes were up-regulated at an early stage (within 12 hours) was also in support of their direct induction by RA receptors. Among these 8 cycloheximide-resistant up-regulated genes, one of them is CEBPε, which has been confirmed by other groups to be very important for the initiation of granulocytic differentiation.37-39 Cell cycle inhibitorp21WAF1/CIP1, apoptosis antagonistsBcl-2–related (Bfl-1) and GADD153(CHOP), and some receptors and membrane proteins (RIG-E, ICAM-1, and CD52) were also confirmed to be in this group. Surprisingly, the transcriptional modulation in 24 of 69 down-regulated genes appeared not to be inhibited by cycloheximide, and the onset of their down-regulation all occurred within 8 hours after treatment with ATRA (Figure2A-J).
Gene expression waves in concert with APL cell differentiation
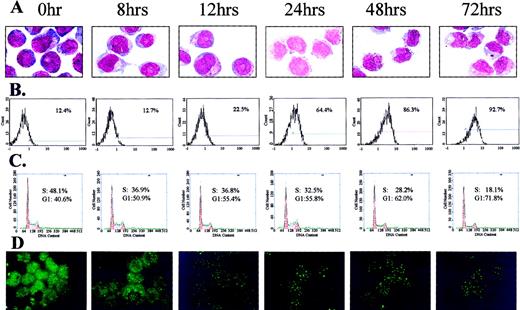
To receive insight into the gene expression network modulated by ATRA, it is important not only to obtain the gene catalog in the network but also to clarify the time course of the transcriptional regulation in each of the modulated genes. To this end, a better definition of the phenotypic changes of NB4 cells upon ATRA, with regard to time course, was necessary. At the early time-points (8 and 12 hours) of the ATRA treatment, there were no obvious morphological changes in the NB4 cells (Figure3). The percentages of CD11b+cells were still at the same level as that of time zero. PML/RARA degradation was not yet distinct. However, the increase of the G0/G1-phase cells and decrease of the S-phase cells were concomitant with the depression of cell proliferation that was started prior to 8 hours of ATRA treatment. After 24 hours of ATRA treatment, the differentiation markers of the NB4 cells began to be observable. CD11b+ and NBT+ cells gradually increased from 24-72 hours after treatment. The ratio of cytoplasm to nucleus was increased, and the chromatin condensation occurred gradually. There was no evident apoptosis observed during the whole course of the treatment. Meanwhile, PML/RARA degradation could be readily observed. Therefore, the time course of differentiation could be roughly divided into 2 phases: before 12 hours and after 12 hours of treatment.
Differentiation status, cell cycle distribution, and PML-staining patterns of NB4 cells at distinct time-points of an ATRA treatment.
Differentiation of the cells was evaluated by (A) morphological changes (Wright's staining) and (B) CD11b expression. (C) The percentages of G1/G2- and S-phase cells at the same time-points were measured by PI staining and FACS analysis. (D) PML/RAR, PML localization in corresponding time-points was studied using immunofluorescence methods with antihuman PML antibodies.
In agreement with the above observation, the expression patterns of the 169 genes were studied using the cDNA array, semiquantitative RT-PCR, and/or Northern blot analysis on NB4 cells prior to ATRA treatment and at 8, 12, 24, 48, and 72 hours after treatment (Figure1B,C). (For some genes, Northern blot analysis was performed as early as 4 hours.) Among the 100 genes with up-regulated expression, 53 genes (53%) were induced within 12 hours, 46 genes (46%) were induced between 24 and 48 hours, and only 1 gene was induced after 72 hours. In contrast, the modulation patterns of the 69 down-regulated genes were quite different because the expression level in 59 genes rapidly declined 8 hours after ATRA treatment, and the expression was suppressed in only 10 genes after 12 hours. Of note, 9 genes suppressed early by ATRA treatment showed increased expression or were restored to basal expression at a late stage (Figure 2 A-J).
The time course of the regulated gene expression patterns was highly associated with the differentiation status of NB4 cells. Genes modulated before 12 hours (such as CEBPε andp21WAF/CIP) were thought to be more important for the initiation of differentiation. Those with modulated expression after 12 hours (such as ICAM1 and neutrophil cytosol factor–1) might be more tightly associated with the progression of differentiation and/or functional adjustment of the maturing cells. The modulation of cell cycle regulators (the up-regulation ofp21WAF/CIP and the down-regulation ofcyclin A, cyclin B, etc), DNA synthesis and/or repair, and recombination proteins (eg, double-stranded RNA binding proteins, ERCC3 and XRCC1) at quite an early time course of ATRA treatment corresponded to the cell cycle arrest and proliferation inhibition. Most of the protein modulators were up-regulated after 12 hours of ATRA treatment, and this was highly related to the degradation of PML/RARA and the restoration of PODs. The apoptosis-related genes were regulated at an early stage (8 hours) and lasted up to 72 hours. The down-regulation of apoptosis agonists and the up-regulation of apoptosis antagonists during the whole course of ATRA treatment could ensure that the cells survive and differentiate terminally.
Discussion
During the last few years, we and several other groups have isolated, in a piecemeal way, RA-regulated genes during ATRA-triggered granulocytic differentiation.1However, there was no systematic survey of gene expression regulation upon the effect of ATRA, and few genes were known to be direct targets of RA in APL cells. Only recently have innovative tools, such as cDNA microarray, allowed a more global approach of the analysis of transcriptional regulation including regulation in APL cells.40 In the present work, which applied several new techniques, 100 genes, including 8 novel ones, were found to be up-regulated by ATRA, while 69 genes were down-regulated. A total of 169 genes were regulated by ATRA, and they may represent approximately 0.8%-1.7% of all genes expressed in APL cells (if the estimation that about 10 000-20 000 genes are expressed in a given cell type holds).41 There are some overlaps between our results and those of Tamayo et al,40 whose group used Affymetrix chips to profile the transcriptional response of NB4 cells to ATRA.
A total of 48 up-regulated and 39 down-regulated genes in our system were also included in the system described by Tamayo et al.40 In addition, 42 of 48 up-regulated genes and 20 of 39 down-regulated genes were found to have similar expression patterns in both systems, which suggests a relatively good overall agreement (73.6%) between the results of these 2 groups with different technical approaches. However, 4 of 48 up-regulated genes and 15 of 39 down-regulated genes picked up in our system were not found to be modulated in the system of Tamayo et al. Moreover, the modulation patterns of 6 genes were contradictory between the 2 systems. It is worth pointing out that for the 2 up-regulated genes with a discrepancy (CD11A and LIMK1), our results of cDNA array were confirmed by RT-PCR. There could be several reasons to explain these differences. Because all genes with disparate results were those with only 2-fold to 5-fold modulation, we deduce that the difference could be caused by distinct sensitivities of the analysis systems employed. Another possibility is that NB4 cells in different laboratories could be subject to slightly distinct culture conditions, which could affect expression of some of the genes.
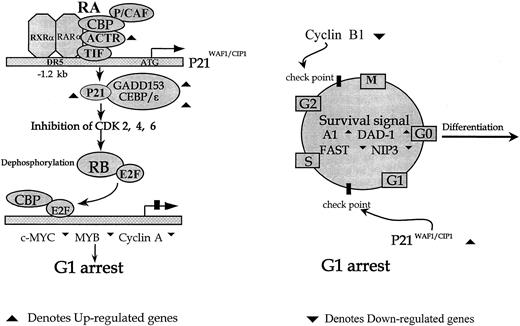
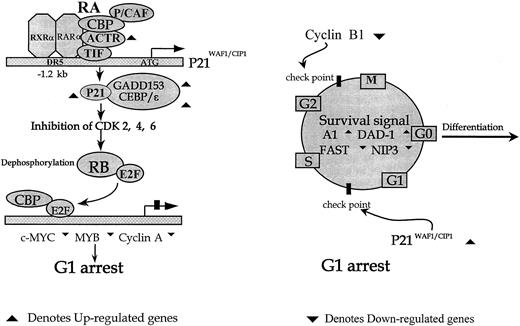
When RA-modulated genes were analyzed for their functions, a picture of well-coordinated choreography emerged, and this may reflect an elegant and intricate cellular program for the commitment to differentiation. For example, many studies suggested that the initiation of differentiation required the transcriptional activation of specific genes leading to proliferation arrest and cell cycle exit. Supporting this notion, indeed, a number of genes known to be able to suppress proliferation and cell cycle progress, such asp21WAF1/CIP1,p19INK4D, GADD153, BTG1, and the Src-like adaptor protein, were up-regulated. Along these same lines, genes favoring DNA synthesis and/or repair and G1-S/G2-M transition, such as c-MYC, c-MYB,GATA2, XRCC1, P55CDC, cyclin A, and cyclin B1, were down-regulated early during ATRA treatment. Another example could be the balance between apoptosis and differentiation. It can be postulated that the apoptosis process, which was favored by the degradation of PML/RARA and the release of PMLs,5,42 should be temporarily inhibited in NB4 cells until the terminal differentiation occurs. Of note, several apoptosis antagonists, such as Bcl-2–related(A1) and DAD1, were up-regulated. Moreover, FGR protein-tyrosine kinase, which had been demonstrated to promote RA-induced granulocytic differentiation of HL-60 cells by preventing programmed cell death, had also been induced.31 Hence, modulated expression of these genes seems to offer a survival signal as an essential prerequisite for the cell maturation process (Figure4). It is a well-established fact that a few transcription factors play important roles in RA signal pathways. The over-expression of these genes could lead cells into differentiation. It is interesting to detect the up-regulation of one of them, namely CEBPε, which is reported to be extremely important for myeloid cell differentiation. Its induced expression is always accompanied by granulocytic differentiation; its over-expression could lead U937 cells to mature granulocytes; and its induction is in a ligand-dependent manner by PML/RARA but not by PLZF/RARA.37-39
The putative mechanism of cell cycle exit in APL cells upon the effect of ATRA.
p21WAF1/CIP1 may function at the upstream differentiation program initiation. Members of the CEBP family, such as CEBP-ε and GADD153 (CHOP), may stabilize the p21WAF1/CIP1 protein from degradation in the current context. The additional member of this family, CEBP-α, has been reported to be implicated in the differentiation of preadipocytes through posttranscriptional stabilization of the p21WAF1/CIP1 protein (left). Additionally, activation of the cell cycle exit and apoptosis-resistant pathways appears to be the prerequisite for the initiation of the differentiation program.
A previous study23 indicated that POD reorganization represented an immediate consequence of PML/RARA degradation, which could be inhibited by lactacystin, a specific inhibitor of proteasome.14 To this end, it is worth noting that 2 enzymes implicated in the step-wise catalysis of binding the ubiquitin polymer to the target protein, the ubiquitin-activating enzyme E1 (UAEE1) and ubiquitin-conjugating enzyme (UCE) genes,22 were up-regulated at 8 hours and 24 hours, respectively, after ATRA treatment. SUMO-1, which encodes a ubiquitin-like protein reportedly to be involved in PML relocalization,23 was induced after 4 hours of ATRA treatment. Interestingly, 2 novel genes isolated in the present work,RIG-A and RIG-B, share, respectively, 55% and 92% amino acid identities with the mouse ubiquitin-conjugating enzyme and cattle leucine aminopeptidase. This suggests that they may also be implicated in the regulation of protein modification.
To distinguish genes as the direct targets of ATRA and as those regulated by the protein products of the direct targets will lead to the dissection of different gene expression “waves” during cell differentiation. The cycloheximide inhibition test suggested that 8 up-regulated genes could be direct targets of RA receptors (Figure 2). The presence of RARE at the promoter regions in 3 up-regulated genes with available 5′-flanking sequences, namelyRIG-E (M.M. and Z.C., unpublished data, August 1998), ICAM-1,43 andp21WAF1/CIP1,44 is in agreement with the current model of ligand-dependent control of the RA receptor activity. In various models of differentiation, the induction ofp21WAF1/CIP1 appeared to be essentially required for the G1-S–phase arrest.45,46 One could therefore image that p21WAF1/CIP1 may act in the upstream of the differentiation course (Figure 4). The puzzle that 24 genes seem to be down-regulated with no requirement for protein synthesis represents a challenge to the current model, which has no explanation for the ligand-dependent transcriptional repression. Several working hypotheses could, nevertheless, be proposed. First, there could be a general competition mechanism for the binding of transcription factors to CoA or CoR molecules.47 Second, the release of wild type PML and PLZF, which were both found to be sequestered by PML/RARA, could restore their function as growth suppressors. Of note, PLZF has been shown to repress the expression of the cyclin A gene.35 Third, there could be an opposition between the effects of RA signaling and AP-1.48-50 It is worth mentioning that the promoter regions of some of the ATRA down-regulated genes, such as TFand DNA (cytosin-5)-methyltransferase, contain AP-1 sites.51 52
The significance of cross-talk or coupling between nuclear and cytosolic signalings in APL cell differentiation has recently drawn much attention. In this work, we found that a number of genes encoding molecules involved in important cytosolic signal transduction pathways were modulated by ATRA. These include cytosolic kinase signal transducers such as cytokine receptors STATs/ISGs, cAMP/PKA, and MAPK/P38/JNK. The functions of the 2 novel genes, RIG-C andRIG-D, should be further studied because they share, respectively, 92.6% and 79% amino acid identities with mouse WSB-1 and hematopoietic intracellular protein tyrosine phosphatase, both being important regulators in signal transduction.53 54
In conclusion, by applying large-scale screening of the differentially expressed genes during ATRA-induced APL cell differentiation, we identified 169 modulated genes, which could be divided into 10 functional groups. A model of gene regulatory network during this process was thus obtained and provided precious datasets for further work to ultimately clarify the mechanism of APL leukemogenesis and ATRA-induced differentiation.
Acknowledgments
The authors thank J. Gu for constructive discussion and Q. H. Huang, J. Zhou, P. M. Jia, Y. P. Yu, and S. H. Xu for excellent technical assistance.
Supported in part by the Chinese High Tech Program 863 (grant no. Z19-02-01-02); the National Natural Sciences Foundation of China (grant no. 39830170); the Shanghai Life Science Center and the Clyde Wu Foundation of the Shanghai Institute of Hematology, Shanghai, China; and the Samuel Waxman Cancer Research Foundation.
T.-X.L., J.-W.Z., and J.T. contributed equally to this work.
The publication costs of this article were defrayed in part by page charge payment. Therefore, and solely to indicate this fact, this article is hereby marked “advertisement” in accordance with 18 U.S.C. section 1734.
References
Author notes
Zhu Chen, Shanghai Institute of Hematology, Rui Jin Hospital, Shanghai Second Medical University, 197 Rui Jin Road II, 200025, Shanghai, China; e-mail: mbshi@stn.sh.cn.

