Abstract
Bone marrow-derived dendritic cells (DC) represent a family of antigen-presenting cells (APC) with varying phenotypes. For example, in mice, CD8α+ and CD8α− DC are thought to represent cells of lymphoid and myeloid origin, respectively. Langerhans cells (LC) of the epidermis are typical myeloid DC; they do not express CD8α, but they do express high levels of myeloid antigens such as CD11b and FcγR. By contrast, thymic DC, which derive from a lymphoid-related progenitor, express CD8α but only low levels of myeloid antigens. CD8α+ DC are also found in the spleen and lymph nodes (LN), but the origin of these cells has not been determined. By activating and labeling CD8α− epidermal LC in vivo, it was found that these cells expressed CD8α on migration to the draining LN. Similarly, CD8α− LC generated in vitro from a CD8 wild-type mouse and injected into the skin of a CD8αKO mouse expressed CD8α when they reached the draining LN. The results also show that CD8α+ LC are potent APC. After migration from skin, they localized in the T-cell areas of LN, secreted high levels of interleukin-12, interferon-γ, and chemokine-attracting T cells, and they induced antigen-specific T-cell activation. These results demonstrate that myeloid DC in the periphery can express CD8α when they migrate to the draining LN. CD8α expression on these DC appears to reflect a state of activation, mobilization, or both, rather than lineage.
Introduction
The generation of most T-cell–mediated immune responses to protein antigens requires the participation of antigen-specific T cells and specialized antigen-presenting cells (APC). APC must be able to capture and process antigens and then migrate from the sites of antigen capture to the T-cell regions of draining lymph nodes (LN) to interact with antigen-specific T cells. They must also be efficient in presenting antigen as major histocompatibility complex (MHC) peptide complexes to the T cells. Dendritic cells (DC) are a family of bone marrow-derived cells uniquely capable of performing these tasks,1 and they are believed to be the main APC responsible for sensitizing naive T cells to their cognate antigens.
Experiments have established that DC can capture antigens in peripheral tissues and then home to the T-cell areas of lymphoid organs.2 For example, afferent lymph DC contain protein antigens that have been administered intradermally,3 4 and DC bearing these antigens can later be isolated from draining LN. Foreign antigens that reach the epidermal barrier are processed and presented to the immune system by skin resident DC known as Langerhans cells (LC). On contact with antigen (for example, allergens), these cells become mobile and gain access to lymphatic vessels and thereby to the T-cell areas of the draining lymph nodes, where they sensitize host T cells to the antigens they have captured and processed.
Experiments performed in murine systems have led to the recognition of 2 main DC subtypes that can be distinguished on the basis of their expression of the myeloid marker CD11b (Mac-1) and the lymphoid marker CD8α.5 For example, epidermal LC express myeloid antigens such as CD11b and FcγR II but do not express CD8α. Thus they have been considered of myeloid origin. Moreover, numerous studies in mice and humans have shown that LC come from a myeloid lineage.6-8 In contrast, the CD8α+ DC in the thymus, which are responsible for the negative selection of T cells, have been demonstrated to be of lymphoid origin (reviewed in Sprent et al9; also see Ardavin et al10). Here we show that CD8α, heretofore thought to be a marker of T cells and lymphoid DC, can be induced on myeloid DC such as LC on their migration from the skin to LN. This phenotypic change is associated with a marked increase in the immunostimulatory properties of these cells.
Materials and methods
Animals
Five- to 7-week-old female C57BL/6 and B10.BR mice were purchased from Harlan Sprague-Dawley (Indianapolis, IN), and C57BL/6 CD8α knockout mice were obtained from Jackson Laboratory (Bar Harbor, ME). The mice were housed in our animal facility.
Cytokines and media
Recombinant murine stem cell factor (SCF), granulocyte macrophage–colony-stimulating factor (GM-CSF), tumor necrosis factor (TNF)-α, and interleukin (IL)-1-β were purchased from Preprotech (Rocky Hill, NJ). Cells were cultured in vitro in the presence of complete medium (CM) that included RPMI supplemented with 10% fetal calf serum (FCS), penicillin (100 U/mL), and streptomycin (100 μg/mL). DC isolation procedures used phosphate-buffered saline (PBS) supplemented with 3% FCS and 5 mmol/L EDTA (PBS-EDTA-FCS). Cell staining and sorting were performed in the presence of PBS-EDTA-FCS and 0.1% azide.
Immunofluorescence analysis and flow cytometry
All cell preparations were preincubated with anti-CD32/16 to minimize nonspecific binding. Three-color analyses were performed on a FACScalibur (Becton Dickinson, Mountain View, CA), and sorting was performed on a FACSVantage (Becton Dickinson). Mouse monoclonal antibodies (mAb) to CD8α chain (Ly-2; IgG2a), CD11c (HL3; IgG1), IA-b (Af6-120.1; IgG2a), Thy-1 (G7; IgG2c), Gr-1 (RB6-8C5; IgG2b), B-220 (RA3-6B2;IgG2a), CD11b (M1/70; IgG2b), CD3ε (145-2C11; IgG1), TCRβ chain (H57-597; IgG2), CD4 (GK1.5; IgG2b), CD86 (GL1; IgG2a), CD40 (HM40-3; IgM), CD16/CD32 (2.4G2; IgG2b), isotype controls, and the second-step antibodies (APC-conjugated streptavidin, phycoerythrin [PE]-conjugated goat antirabbit IgG, and a PE-conjugated antirat IgG) were purchased from Pharmingen (San Diego, CA). Mouse mAb to DEC-205 (NLDC-145; IgG2a) was purchased from Serotec (Raleigh, NC), and a mouse polyclonal antibody recognizing E-cadherin was kindly provided by Dr W. J. Nelson.11 A different clone of mAb recognizing CD8α (CT-CD8a; IgG2a) was purchased from Caltag (Burlingame, CA). In skin painting experiments, the DC-enriched population was stained with biotin-conjugated CD11c and PE-conjugated IA-b, and APC–streptavidin conjugate was used as a second step.
Isolation of epidermal Langerhans cells
LC were obtained from epidermal sheets of mouse ears following a protocol modified from that of Schuler and Steinman.12Briefly, ears were split with the aid of forceps into dorsal and ventral halves and incubated in a Petri dish containing 0.5% trypsin (Gibco BRL, Gaithersburg, MD) in PBS for 20 minutes at 37°C to allow the separation of epidermal sheets from the dermis. The epidermis was separated from the dermis with fine forceps. A suspension of epidermal cells was obtained by filtering the trypsinized epidermal sheets through a stainless steel sieve, followed by washing in PBS with 5% FCS. The resultant cell suspension was resuspended in CM and cultured in a 24-well plate in the presence of 10 ng/mL GM-CSF. Twenty-four hours later, nonadherent cells were collected and washed, and the cell concentration was adjusted to 4 × 10⁶ cells/mL in PBS. Four microliters Nycoprep (Nycomed, Oslo, Norway) was gently layered under 6 mL of epidermal cells and centrifuged for 20 minutes (1800 rpm) at 4°C. The low-density fraction contained more than 30% LC, as assessed by flow cytometry.
Langerhans cell migration assay in vivo
Mice were painted on the shaved abdomens and footpads with 400 μL of 4 mg/mL fluorescein isothiocyanate (FITC) (F-7250; Sigma, St. Louis, MO) dissolved in 1:1 acetone:dibutylphalate (D-2270; Sigma). Draining inguinal and popliteal LN were excised 24 hours, 48 hours, 72 hours, or 4 days after exposure.
Isolation of dendritic cells from lymph nodes
DC were isolated from peripheral LN of normal and painted mice using the following protocol. Briefly, whole LN were injected with collagenase D (1 mg/mL) (Boehringer-Mannheim, Mannheim, Germany) in CM for 20 minutes at 37°C. Digested LN were filtered through a stainless steel sieve, and the cell suspension was washed twice in PBS-EDTA-FCS. EDTA was used throughout the procedure to dissociate DC-T complexes. Cells were resuspended in CM at 1 × 10⁶ cells/mL and layered onto Nycoprep solution (density, 1.068 g/cm3; Nycomed). After centrifugation at 1800 rpm for 20 minutes, cells obtained from the interphase (accounting for 1% of the total) were washed twice in PBS-EDTA-FCS. FITC+CD8+CD11c+ and FITC+CD8-CD11c+ DC were sorted from DC-enriched cells obtained from the draining LN of painted mice.
Immunofluorescence and confocal microscopy
Draining popliteal and inguinal LN were harvested and frozen in liquid nitrogen 24 hours after skin painting and 24 hours after LC injection into the footpads of CD8α knockout mice (see below). Cryostat-cut LN sections (5 μm) were fixed in acetone, air dried, and washed in PBS. Tissue sections were blocked with anti-FCγR II/III (CD16/CD32) antibodies for 30 minutes and then stained with biotin-labeled anti-CD8, followed by streptavidin-PE and FITC-conjugated CD11c where indicated. Sections were analyzed using a confocal microscope equipped with a krypton–argon laser. Separate green and red images were collected for each section analyzed. Final image processing was performed using Adobe Photoshop software (Adobe, Mountain View, CA). To orient the reader to the normal architecture of the LN, adjacent tissue sections were fixed in methanol, air dried, and stained with hematoxylin and eosin. Hematoxylin and eosin-stained sections were analyzed using a bright-field microscope (Microphot-FXA; Nikon).
Generation of bone marrow-derived Langerhans cells in vitro
Bone marrow cells were obtained from the femurs and tibiae of 5- to 7-week-old C57BL/6 female mice. Lineage-negative hematopoietic progenitor cells (HPC) were isolated from bone marrow by negative selection with magnetic beads. The bone marrow cell preparation was stained with a cocktail of biotin-conjugated mAb to CD3, CD4, CD8, Thy-1, B220, IA-b, CD11c, CD11b, and Gr-1, and labeled cells were then depleted with streptavidin microbeads (Miltenyi Biotech, Auburn, CA). A modification of the protocol of Zhang et al8 was used to generate bone marrow-derived LC (BM-LC). Briefly, purified HPC were incubated at 1 × 10⁵ cells/mL in CM in the presence of GM-CSF (5 ng/mL), transforming growth factor (TGF)-β (2.5 ng/mL), and SCF (5 ng/mL). The culture was split on day 4, and fresh medium and cytokines were added on day 7. On day 13, TGF-β was omitted, and GM-CSF (10 ng/mL), TNF-α (10 ng/mL), and IL-4 (10 ng/mL) were added to the cultures for 3 more days. Cell samples obtained at days 13 and 16 were analyzed by flow cytometry. CD8−CD11c+IA-b+ LC were sorted by flow cytometry. The purity of LC after sorting was greater than 90% based on their coexpression of IA-b, CD11c, CD11b, and E-cadherin. Purified LC were resuspended at a concentration of 3 × 10⁶/50 μL in PBS and injected into the footpads of CD8αKD mice (1 footpad per mouse). Twenty-four hours later, the draining and contralateral LN were harvested and analyzed for the presence of CD8+LC.
Induction and measurement of cytokine secretion from migratory Langerhans cells and CD8− dendritic cells
Populations of FITC+CD8+CD11c+, FITC+CD8-CD11c+, and FITC−CD8−CD11c+ cells were isolated by sorting. Within each population, 1 × 10⁵cells were stimulated in vitro with LPS (1 μg/mL) or IL-12 (10 ng/mL). After 48-hour culture, supernatants of LPS-stimulated cells were assayed for IL-12, whereas culture supernatants of IL-12–stimulated cells were assayed for IFN-γ. Cytokine secretion was quantified by enzyme-linked immunosorbent assay (ELISA).
Antigen capture and presentation assay
Ovalbumin (grade VI; Sigma) mixed with complete Freund's adjuvant (DIFCO, Detroit, MA) was injected intradermally into the footpads of mice. Two days later, the skin was sensitized as described above, and the draining lymph nodes were harvested 24 hours later. The purified and sorted FITC+CD8+CD11c+and FITC+CD8-CD11c+ populations were cultured in the presence of an ovalbumin-specific, MHC class I-restricted T-cell hybridoma (B3Z) for 24 hours at a ratio of 1 FITC+ cell:10 B3Z cells. IL-2 release from the hybridoma cells was analyzed by ELISA.
Mixed lymphocyte reaction
Graded numbers of a purified population of FITC+CD8+CD11c+ or FITC+CD8−CD11c+ cells were irradiated (30 Gy) and added to allogeneic (B10.BR) T cells (2 × 10⁵/well) in a final volume of 0.2 mL in 96-well flat-bottom plates (Corning, Corning, NY). Cell proliferation was measured by adding 1 μCi 3H-thymidine/well after 3 days. Cells were harvested 16 to 18 hours later, and the incorporated3H-thymidine was counted in a β-plate counter (Wallac, Gaithersburg, MD). Results are presented as the mean of triplicate cultures.
ELISA
Cytokine secretion was quantified by ELISA adapted from Pharmingen protocols. In brief, ELISA plates (Corning) were coated overnight at 4° with 50 μL antimouse IL-2, IL-12, and IFN-γ antibodies (Pharmingen) diluted in 0.1 mol/L NaHCO3 to a concentration of 2 μg/mL. The plates were then blocked with PBS–5% FCS for 3 to 4 hours and were washed several times with PBS/0.1% Tween 20. Serial dilutions of the standard were made at a starting concentration of 5 ng/mL for IL-2 (R&D, Minneapolis, MN) and 50 ng/mL for IL-12 and IFN-γ (Preprotech). Fifty microliters of the sample or the standard was added to the plate at room temperature. After 4 hours of incubation, the plates were washed, and biotinylated detection antibody (Pharmingen) was added at a concentration of 2 μg/mL. Three hours later, the plates were washed and incubated with streptavidin–horseradish peroxidase (Vector Laboratories, Burlingame, CA) diluted at 1:2000. One hour later, the plates were washed and the bound peroxidase was detected with TMB substrate (Zymed, San Francisco, CA). The amount of reaction product was assessed on an ELISA plate reader (Bio-Rad, Hercules, CA) at an optical density of 650 nm. The detection limit was 50 pg/mL.
Reverse transcription–polymerase chain reaction
Total RNA was extracted from purified FITC+CD8+CD11c+ cells, FITC+CD8-CD11c+ cells, FITC-CD8+CD11c+ (resident DC), and total LN cells using an RNeasy kit (Qiagen, Valencia, CA) and treated with DNase. RNA was quantified by spectrophotometry. First-strand cDNA was synthesized from total RNA using the Superscript II RNase H-reverse transcriptase (Gibco BRL) with random primers, as described by the manufacturer. For all samples, synthesis of cDNA was controlled by reverse transcription–polymerase chain reaction (RT-PCR) using β-actin primers for 30 cycles. CD8α chain mRNA was examined by using the primers (sense primer, cacgaataataagtacgttctcacc; antisense primer, atgtaaatatcacaggcgaagtcca) and CD3ε by using the following primers: gaaagaatcaggctgctcaga (sense) and tggagatggtgatgaccatccga (antisense). CCR6 mRNA was examined by using the primers ctgcagttcgaagtcatc (sense) and gtcatcaccaccataatgttg (antisense). CCR7 mRNA was examined by using the primers acagcggcctccagaagaacagcgg (sense) and tgacgtcataggcaatgttgagctg (antisense). Thymus and activation-regulated chemokine (TARC) mRNA was examined by using the primers caggaagttggtgagctggtata (sense) and ttgtgttcgcctgtagtgcata (antisense). Monocyte-derived chemokine (MDC) mRNA was examined using the primers gtggctctcgtccttcttgc (sense) and ggacagtttatggagtagctt (antisense).
Results
Migratory Langerhans cells in draining lymph nodes, but not in skin, express CD8α
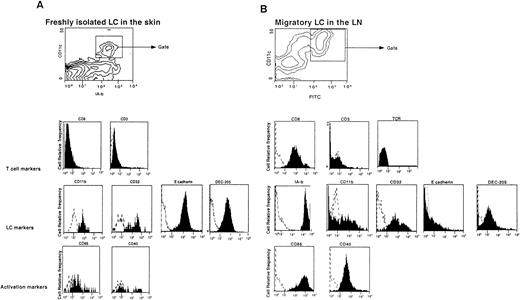
LC isolated from the skin, as described in “Materials and methods,” were subjected to FACS analysis. As described in previous studies, these cells express CD11c13 and the myeloid markers CD11b and FcγR, the DEC-205 multilectin receptor,14 and the epithelial marker E-cadherin15 (Figure 1A). These LC, however, do not express CD8α. After skin sensitization by FITC painting, the FITC+ cells found in the draining LN express a similar phenotype to LC isolated from the skin (Figure 1B). However, all FITC+ cells found in the LN had high levels of MHC class II and costimulatory molecules, suggesting that these cells represent LC that encountered FITC in the skin, became activated, and migrated to the LN. Surprisingly, these cells expressed CD8α on their surfaces but did not express other T-cell markers, such as CD3 or TCR (Figure 1B). The level of CD8α staining was similar, with 2 different anti-CD8 antibodies, and was stable from day 1 through day 4 after FITC painting (data not shown). To evaluate the distribution of CD8α on migratory LC, DC were isolated from the draining LN of painted mice, and FITC+CD8+CD11c+ cells were purified by FACS. Sorted cells were then assessed by confocal microscopy to determine whether any doublet cells, composed of LC and adherent lymphocytes, were present. No doublets were found, and, as shown in Figure 2, panel A, the FITC staining pattern was diffusely intracellular, whereas CD8α was evenly distributed on the surface. This distribution of staining was typical of all the cells examined.
Migratory LC in the LN, but not in the skin, express CD8α.
(A) LC were isolated from skin and immediately analyzed by FACS. Contour plots represent IA-b versus CD11c profiles, and the histograms show the phenotypes of IA-b+ CD11c+ cells. (B) Four days after skin painting with FITC, DC were isolated from LN using density-gradient centrifugation. Contour plots represent FITC versus CD11c profiles of the DC-enriched population, and the histograms show the phenotypes of the FITC+CD11c+ gated cells. Dashed lines give the background fluorescence obtained with an isotype control.
Expression of CD8α protein and mRNA in migratory LC.
(A) DC were isolated from the draining LN 1 day after FITC painting and were stained with PE-conjugated CD8 antibody. FITC+CD8+ cells were purified using a cell sorter and were analyzed by confocal microscopy. Magnification, 60×. (B) FITC+CD8+CD11c+cells (lane 1), FITC−CD8+CD11c+ cells (lane 2), and FITC+CD8−CD11c+ cells (lane 4) were sorted to more than 90% purity from a DC-enriched population isolated from the draining LN of FITC-painted mice and were subjected to RT-PCR analysis. A suspension of total LN cells (lane 3) served as positive control. For all samples, synthesis of cDNA was controlled by RT-PCR using β-actin primers for 30 cycles. One of 3 experiments with identical results is shown.
Migratory Langerhans cells express CD8α mRNA but not CD3 mRNA
To determine whether CD8α was synthesized by the FITC+ DC or was acquired passively from T cells that might have shed CD8 molecules, the presence of the CD8α chain message in sorted FITC+ DC (more than 90% purity) was assessed by RT-PCR analysis. As shown in Figure 2 panel B, the sorted FITC+CD8+CD11c+ DC expressed a clear CD8α chain message but no CD3 message. The production by DC of CD8 mRNA makes it highly unlikely that CD8 antigens detected by flow cytometry were passively acquired, and the absence of the CD3 message confirms that the sorted cells were not contaminated by T cells.
Bone marrow-derived Langerhans cells injected into CD8α knockout mice express CD8α when they reach the lymph nodes
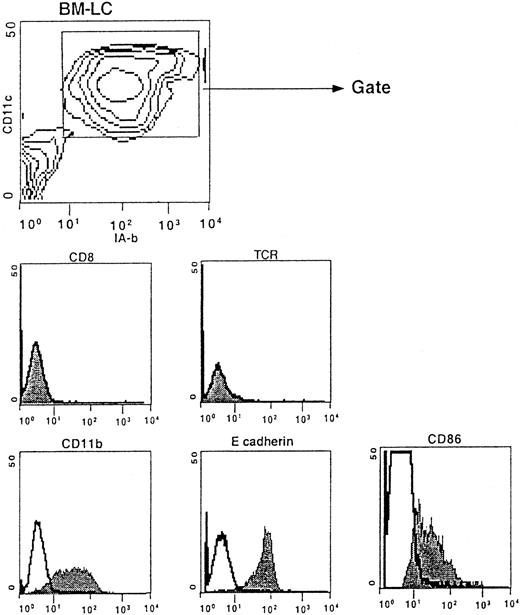
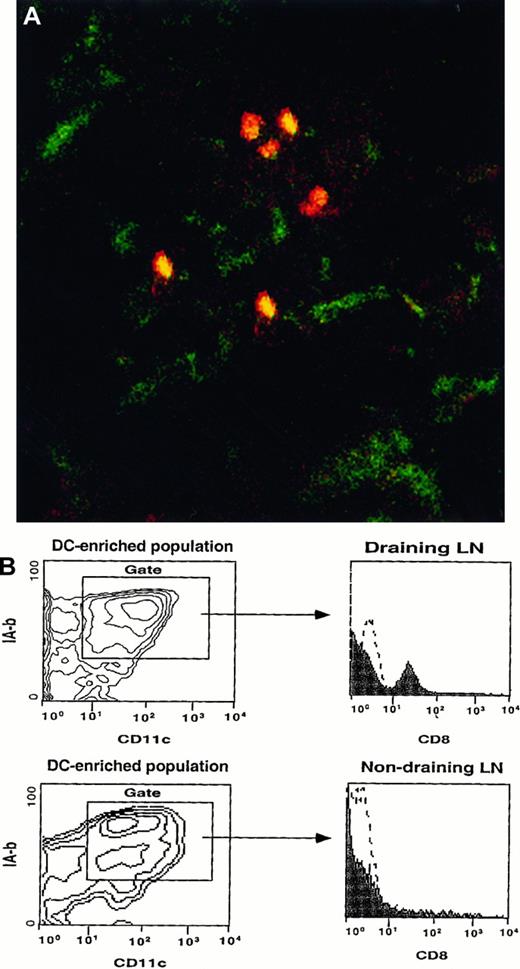
BM-LC were generated from C57BL/6 mice and injected subcutaneously into the footpads of syngeneic CD8α knockout mice. As described in “Materials and methods,” these cells were generated in vitro from lineage-negative HPC cultured in the presence of cytokines, including GM-CSF, TGF-β, and SCF. Cells obtained at day 13 were typical monocytes, as evidenced by their morphology and endocytic activity (data not shown). After 3 additional days of culture in the presence of GM-CSF, TNF-α, and IL-4, most cells differentiated into DC. They expressed high levels of MHC class II molecules, CD11c and CD11b antigens, the epithelial marker E-cadherin, and costimulatory molecules, whereas a small subset of the cells (less than 10%) differentiated into macrophages (data not shown). None of these cells expressed CD8 or TCR molecules (Figure3). Purified CD8−CD11c+ IA-b+ LC were injected subcutaneously into the footpads of CD8α knockout mice. Twenty-four hours after injection, a subset of DC from the draining LN expressed CD8α (Figure 4A,B) but no other T-cell markers (not shown), whereas none of the DC from the contralateral LN expressed CD8α (Figure 4B).
Phenotype of BM-LC.
Bone marrow cells were harvested from CD8 wild-type mice and cultured for 13 days at 1 × 10⁵ cells/mL in CM containing GM-CSF, TGF-β, and SCF and then cultured in the presence of TNF-α and GM-CSF and IL-4 for 3 additional days. Contour plots show the CD11c versus IA-b profile of the cells obtained at day 16 of culture. Histograms show the phenotypes of the CD11c+IA-b+-gated cells.
BM-LC from wild-type mice express CD8 when they reach the LN of a CD8α knockout mouse.
(A) 3 × 10⁶ sorted CD8−CD11c+IA-b+ BM-LC were injected subcutaneously into the footpad of a CD8α knockout mouse. Twenty-four hours later, the draining LN were harvested, sectioned, fixed in acetone, and stained with biotin-labeled anti-CD8 antibody followed by streptavidin–PE and FITC-conjugated anti-CD11c. Tissue was analyzed by confocal microscopy. CD8+ cells (red), which correspond to the injected BM-LC, coexpress CD11c (yellow). Magnification, 20×. (B) Contour plots show CD11c versus IA-b profiles of a DC-enriched population isolated from the draining and nondraining LN of a CD8α knockout mouse injected subcutaneously with BM-LC generated from wild-type CD8 mice. Histograms show the phenotypes of the CD11c+ IA-b+DC-enriched cells. Twenty-four hours after injection, DC expressing CD8 were detected in the draining LN, whereas no CD8+ cells were detected in the contralateral (nondraining) LN. Identical results were obtained in 2 separate experiments.
CD8+ Langerhans cells express CCR6 and CCR7 receptors, migrate to the T-cell zones of lymph nodes, and secrete chemokines that attract T cells
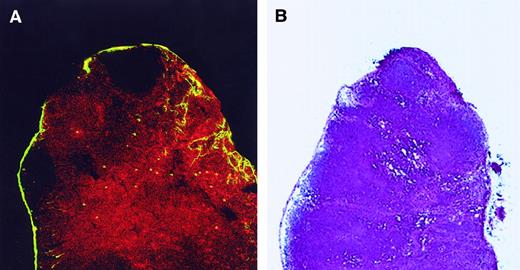
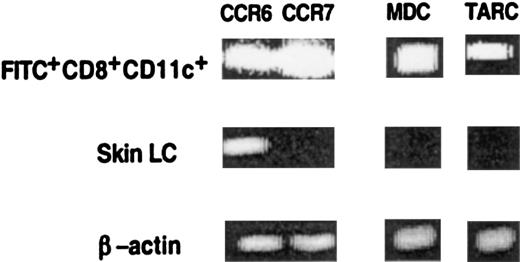
To generate an immune response, antigen-loaded DC must rapidly interact with antigen-specific T cells in lymphoid organs. Mechanisms that would be expected to increase encounters between DC and T cells include the localization of migratory DC to T-cell areas of the LN or their production of T-cell attracting chemokines. To address these possibilities, we analyzed the geographic localization, chemokine receptors, and chemokine expression of FITC+CD8+ cells present in the LN and freshly isolated LC from the skin. Twenty-four hours after skin sensitization with FITC, the draining LN were harvested and analyzed by immunohistochemistry. Frozen sections of the LN were stained to identify the T-cell zone and examined by confocal microscopy. As shown in Figure 5A, most FITC+cells in the LN expressed CD8α antigen and were located in the T-cell zone and not in the follicles. Using an RT-PCR assay, we then analyzed the expression of chemokine and chemokine receptor mRNA. RNA was extracted from a sorted population of FITC+CD8+cells isolated from the LN and from LC freshly isolated from the skin. As shown in Figure 6, FITC+CD8+ LC expressed CCR6 and CCR7 and the T-cell attracting chemokines MDC and TARC. In contrast, freshly isolated LC from the skin express CCR6 but not CCR7, MDC, or TARC.
CD8+ LC are localized in the T-cell area of LN.
(A) Twenty-four hours after skin painting with FITC, draining LN were harvested, sectioned, fixed in acetone, and stained with biotin-labeled anti-CD8 antibody and then by streptavidin–PE to determine the localization of the CD8+ LC. Tissue was analyzed by confocal microscopy. Red cells represent CD8+ T cells. Most FITC+ cells (yellow) coexpress CD8 and are present in the T-cell region. Magnification, 10×. Adjacent cryostat sections (5 μm) stained with anti-CD4 revealed the CD4+ T cells to be localized in the same regions as the CD8+ cells (data not shown). (B) Adjacent tissue sections were fixed in methanol, air dried, and stained with hematoxylin and eosin to orient the reader to the normal architecture of the LN. Stained sections were analyzed using a bright-field microscope. Magnification, 10×.
CD8+ LC in LN, but not in skin, express the chemokine receptor CCR7 and the T-cell attracting chemokines MDC and TARC.
LC were isolated from ear skin as described in “Materials and methods,” and FITC+CD8+CD11c+cells were isolated from the LN of painted mice. The presence of CCR6, CCR7, MDC, and TARC mRNA was assayed by RT-PCR using specific primers. For each sample cDNA synthesis was controlled by RT-PCR using β-actin primers for 30 cycles. Results of 1 of 3 representative experiments are shown.
CD8+ Langerhans cells capture, process, and present antigens to T cells
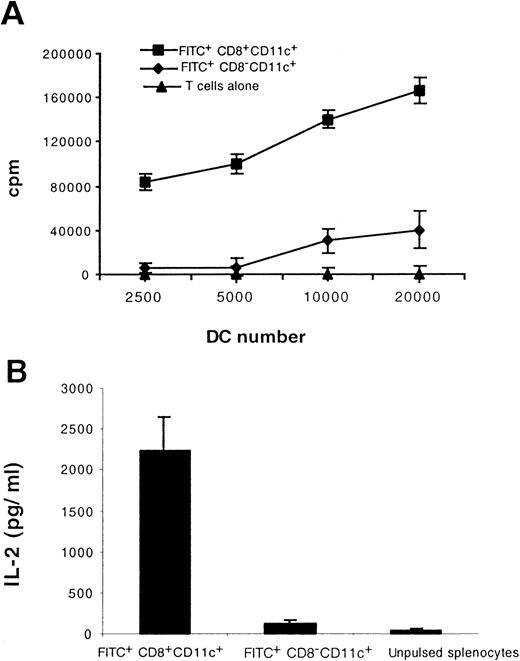
To assess the capacity of migratory LC to stimulate allogeneic T cells, we isolated FITC+CD8+CD11c+and FITC+CD8−CD11c+ cells from the LN of painted mice and cocultured them with freshly isolated allogeneic T cells. As shown in Figure 7, panel A, the CD8+ LC stimulated allogeneic T cells to proliferate vigorously in the mixed lymphocyte reaction. To assess the capacity of migratory LC to process and present external antigen in association to MHC class I molecules, we injected ovalbumin mixed with complete Freund's adjuvant intradermally into the footpads of mice and subsequently painted the mice with FITC. Twenty-four hours later, FITC+CD8+CD11c+ and FITC+CD8−CD11c+ cells isolated from the draining LN were cultured with the ovalbumin-specific, MHC class I-restricted T-cell hybridoma, B3Z. As shown in Figure 7 panel B, in the presence of CD8+ LC, the B3Z cells secreted high levels of IL-2. However, FITC+CD8−CD11c+ cells failed to stimulate either B3Z hybridoma cells or allogeneic T cells (Figure 7A,B).
Functional maturation accompanies CD8 induction on migratory LC.
Mice were immunized intradermally with ovalbumin and then painted with FITC. Twenty-four hours later FITC+CD8+CD11c+ and FITC+CD8−CD11c+ cells in the draining LN were isolated and tested for their ability to stimulate 2 × 10⁵ allogeneic T cells (A) and to process and present antigen to 5 × 10⁴ class I MHC-restricted, ovalbumin-specific T hybridoma cells. (B). Results shown are representative of 2 separate experiments.
CD8+ LC secrete a higher level of Th1 cytokines than CD8− DC
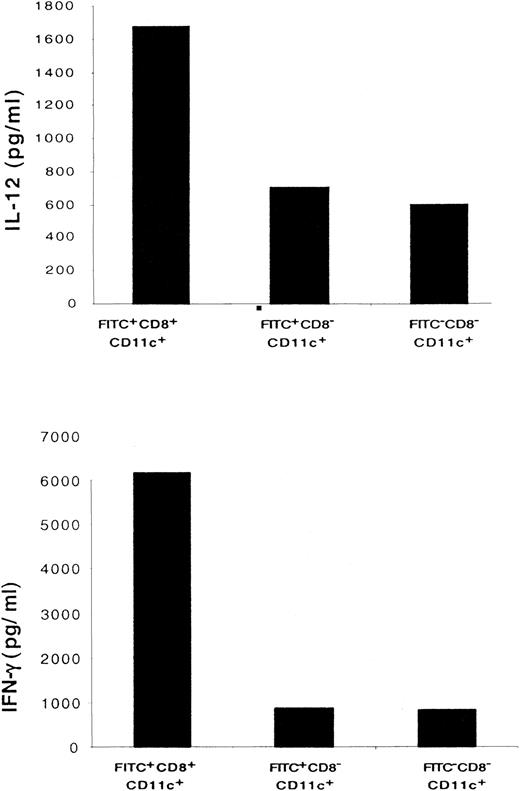
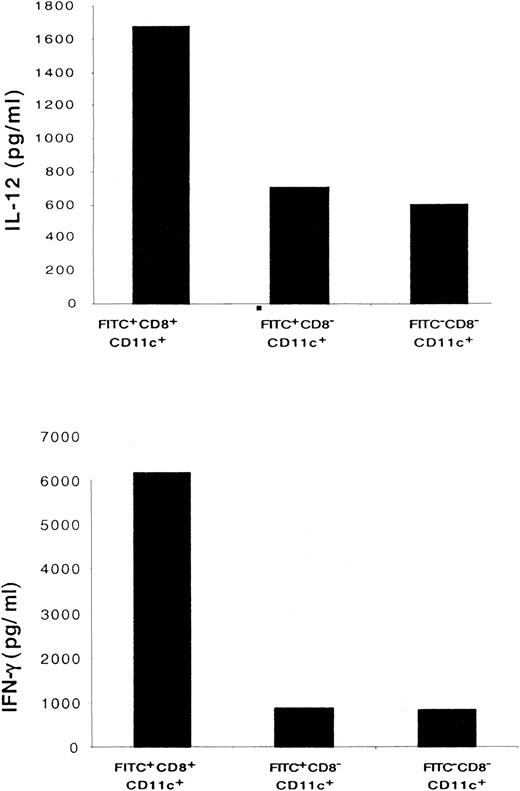
To characterize the cytokine profile of the migratory LC, FITC+CD8+CD11c+, FITC+CD8−CD11c+, and FITC−CD8− CD11c+ cells were purified from LN and stimulated in vitro overnight with lipopolysaccharide or IL-12. As shown in Figure8, significant amounts of Th1 cytokines, such as IFN-γ and IL-12, were secreted by CD8+ DC. The amount of IFN-γ and IL-12 secreted by CD8+ DC was greater than that secreted by CD8− DC.
CD8+ LC secrete higher levels of IL-12 and IFN-γ than CD8− DC.
Sorted populations of 1 × 10⁵FITC+CD8+CD11c+, FITC+CD8−CD11c+, and FITC−CD8−CD11c+ DC were cultured in the presence of IL-12 to induce IFN-γ secretion or in the presence of lipopolysaccharide to induce IL-12 secretion. Forty-eight hours later, the cytokine profile of each population was determined by ELISA. Results of 1 of 3 representative experiments are shown.
Discussion
Although the lymphoid origin of CD8+ thymic DC has been conclusively demonstrated (reviewed in Sprent et al9; also see Ardavin et al10), the lineage of CD8+DC in peripheral lymphoid organs has not yet been determined. CD8+ DC were initially identified by Ardavin et al in the thymus of mice, in which they appear to develop from an endogenous precursor rather than to arrive preformed from the circulation.10 On transfer to irradiated mice, this precursor gave rise to T, B, and natural killer cells and to CD8+ DC.16 In a subsequent study the same investigators identified CD8α+ DC in the spleen and the LN of mice.5 This observation led to the concept of a second CD8α+ DC lineage that comprises subsets of DC in peripheral lymphoid organs and in the thymus. However, despite their phenotypic similarity, these 2 populations can be distinguished from one another on other grounds. For example, thymic CD8+ DC express BP-1, a glutamyl aminopeptidase not expressed by splenic or LN CD8+ DC.17 Thymic DC express other lymphoid markers, such as Thy-1, that are not present on CD8+ DC in lymphoid organs.17 Functionally, thymic DC induce the negative selection of thymocytes but do not have a role in positive selection.18 In contrast, peripheral CD8+ DC are potent stimulators of T-cell proliferation and induce the secretion of high levels of Th1 cytokines.19 20 These differences suggest that peripheral and thymic CD8+ DC represent developmentally distinct cell types.
We show here that freshly isolated LC and LC derived from HPC do not express the CD8 antigen. However, when LC are activated in vivo with a skin sensitizer that results in their migration to the draining LN, CD8 expression is induced on the surfaces of the cells. In our studies CD8 expression on migratory LC was not caused by the presence of contaminating cells or the passive absorption of CD8 molecules shed by T cells because migratory LC in the LN did not express CD3 or TCR antigen. Moreover, these cells expressed CD8 mRNA, showing that they are able to synthesize CD8 despite their lack of any detectable CD3 mRNA. Finally, we showed that CD8− LC generated in vitro from the bone marrow cells of CD8 wild-type mice and injected into syngeneic CD8α knockout mice21 expressed CD8α when they reached the draining LN. Because the LC were injected into mice that had been rendered incapable of expressing CD8, the CD8 expression detected in the draining LN could only have been expressed by the injected cells. These results show clearly that classical myeloid DC, such as LC, can express CD8α when they migrate to draining LN.
The results presented here also demonstrate that CD8+LC are uniquely equipped to attract and interact with T cells. They express the chemokine receptors CCR6 and CCR7, facilitating their recruitment in the periphery and their migration to the T-cell zones of secondary lymphoid organs. CCR6 is the receptor for MIP-3α,22,23 a chemokine induced by inflammatory stimuli and expressed mainly by keratinocytes, fibroblasts, and endothelial cells.24,25 CCR6 is also the only known receptor of β defensins, a family of small peptides expressed by keratinocytes and released on microbial invasion.26 The presence of CCR6 on LC allows their recruitment to sites of inflammation in response to danger signals, thereby enhancing the role of these cells in innate and adaptive immunity. The expression of CCR6 by migratory DC was assessed 18 hours after FITC activation, and it would be expected to decline at later time points.25 CCR7 is the receptor of SLC,27 a chemokine expressed by stromal cells in the T-cell areas of LN, high endothelial venules, and lymphatic vessels.28,29 SLC attracts both activated DC30in the lymphatic vessels31,32 and naive T cells,29 suggesting that it may have a role in the colocalization of migratory CD8+ LC and naı̈ve T cells. Our studies also showed that CD8+ LC in LN produce MDC33,34 and TARC,35 2 recently discovered β chemokines involved in T-cell attraction. The expression of CCR7 and T-cell–attractant chemokines by CD8+ LC may explain their exclusive localization in T-cell areas of LN.
CD8+ and CD8− DC share a number of properties, including dendritic morphology and elevated surface expression of MHC class II. However, there are significant differences between these 2 populations. Although CD8− DC are found in nonlymphoid tissues and in lymphoid organs, CD8+ DC are found only in lymphoid organs. More important, CD8+ DC are present only in the T-cell areas of the spleen and LN.36However, CD8− DC are absent from the thymus and are present outside the T-cell zones of secondary lymphoid organs.36 CD8+ DC express higher amounts of peptide MHC complexes on their surfaces,37,38 secrete higher levels of IL-12 when stimulated with Staphylococcus aureus Cowan I strain or IFN-γ, induce T-cell stimulation, and drive Th1 differentiation.20,21 In contrast, CD8− DC express lower levels of MHC peptide complexes, secrete higher levels of IL-10, and drive Th2 differentiation.20 In our studies, freshly emigrant CD8+ DC secreted 3 times more IL-12 and 6 times more IFN-γ than CD8− DC. These findings suggest that CD8+ LC may play a fundamental role in the induction of immunity by priming Th1 responses. Thus, Reis e Sousa et al39 showed that after in vivo challenge withToxoplasma gondii, CD8+ DC were the predominant APC producing IL-12, suggesting an important role for these cells in microbial immunity. More recently, Ohteki et al40 showed that CD8+ DC, but not CD8− DC, were capable of secreting significantly more IFN-γ than natural killer cells at an early stage of Listeria monocytogenes infection or after IL-12 administration.40
The findings presented here, together with previous results, suggest that CD8− DC in the periphery and outside the T-cell zones of secondary lymphoid organs are ordinarily immunologically inactive. These cells capture and process antigens in the environment and, in the presence of a danger signal, migrate to the T-cell zones of lymphoid organs, where they present the antigen to specific T cells. CD8 is expressed on DC either during migration or on their arrival in LN. Although the trigger for CD8 expression remains unknown, the presence of this molecule appears to reflect a stage of differentiation or activation rather than lineage.
Acknowledgments
We thank Tomoharu Sugie for critical discussion, Patricia Lovelace for help with flow cytometry, Claudia Benike for critical review of the manuscript, and Donna Jones for formatting the manuscript.
Supported in part by National Institutes of Health grants CA71725, HL57443, and CA72103. M.M. was supported by a grant from the Association Francaise Contre le Cancer. L.F. was supported by a Physician–Scientist Award from the National Cancer Institute (K23 CA82584-01).
The publication costs of this article were defrayed in part by page charge payment. Therefore, and solely to indicate this fact, this article is hereby marked “advertisement” in accordance with 18 U.S.C. section 1734.
References
Author notes
M. Merad, Stanford Blood Center, 800 Welch Rd, Palo Alto, CA 94304; e-mail: meradm@leland.stanford.edu.

