Abstract
The effects of early antiretroviral therapy on the peripheral CD8+ T-cell population were assessed by sequentially determining the T-cell receptor (TCR) repertoire complexity in a cohort of 15 individuals recently diagnosed with human immunodeficiency virus infection. Analysis was based on quantitative TCR variable B gene (TCRBV) usage and complementary-determining region 3 length assessment. Repertories were assessed at baseline and at weeks 2, 4, 12, 24, and 72 after initiation of therapy. Early administration of highly active antiretroviral therapy has a positive effect on the preservation and homeostasis of the CD8+ cell repertoire. Nevertheless, differences from average baseline and control TCR profiles and initial development of repertoire perturbations were observed. The findings suggest that additional therapeutic protocols will be required during primary infection to significantly prevent long-term erosion of the T-cell–mediated immune response.
Introduction
Exposure to the human immunodeficiency virus (HIV) often results in an acute influenza-like illness associated with the production of a large number of virus particles and killing of CD4+ T cells.1 Typically, a vigorous adaptive HIV-specific CD8+ cell response follows, which controls the acute illness, and CD4+ T-cell numbers return to nearly normal levels.2 This response does not eradicate the virus, and circulating CD4+ T cells remain infected, usually containing a single copy of the viral genome. This phase is often referred to as the asymptomatic state because patients are relatively symptom free. During this phase, however, HIV is actively replicating in lymphoid tissues and other sites in the body.
The CD8+ cell population initially responds to infection by expanding selected HIV-specific memory cells or clonotypes, which may translate into permanent alterations of the T-cell repertoire.3-6 Although the clinical consequences of these expansions remain uncertain, a clonally restricted CD8+cell antiviral repertoire and activity may impair the ability to recognize a broader range of HIV epitopes and emerging mutant species of the virus. The recovery of peripheral lymphocyte homeostasis and maintenance of a diverse T-cell repertoire appear to correlate with a long-term asymptomatic state.4,5,7-10 Hence, a main objective of HIV therapy should be to rapidly restore and maintain a diverse T-cell population that will respond promptly to multiple viral epitopes. Highly active antiretroviral therapy (HAART) can reduce plasma viral RNA below the limits of standard quantification and restore the peripheral T-cell CD4/CD8 cell ratio and function.11 There is an increase in T-cell production and turnover and normalization of the CD4+ cell repertoire.9,12,13 However, HIV DNA remains detectable, suggesting that established reservoirs are not extensively affected.11 To determine the effect of these changes in the peripheral CD8+ T-cell population, we sequentially assessed the repertoire complexity in a cohort of 15 individuals with early HIV infection who had been treated with HAART immediately after diagnosis. Analysis was based on quantitative T-cell receptor variable B gene (TCRBV) usage and complementary-determining region 3 (CDR3) length assessment. Early initiation of HAART has an overall positive effect on preventing the polarization of the CD8+cell repertoire. Nevertheless, substantial distance from average baseline TCR profiles and initial development of repertoire perturbations were observed, suggesting that additional therapeutic protocols will be required to show a substantial effect on HIV pathogenesis.
Materials and methods
Study subjects
Individuals with acute or recent HIV-1 infection were enrolled in the Options Project at San Francisco General Hospital (http://hivinsite.ucsf.edu/options/opt.html). Participants were recruited through referrals from physicians, HIV-1 testing and counseling sites, community-based organizations, community health centers, and self-referral. Participants were eligible for this study if the initial evaluation indicated that they met one or more of the following criteria for recent HIV-1 infection: (1) detectable HIV-1 RNA in blood plasma and a negative or indeterminate Western blot assay for anti–HIV-1 antibodies; (2) a positive enzyme-linked immunosorbent assay (ELISA) with Western blot confirmation within 12 months of a documented negative HIV-1 antibody test; or (3) an optical density ratio of less than 0.75 using a less sensitive/standard dual ELISA testing system with a history compatible with recent HIV infection.14 Demographic characteristics of the study group are shown in Table 1. Once eligibility was determined, subjects were begun on therapeutic regimens as detailed in Table 2. No untreated HIV-infected individuals were available as controls because all participants preferred to initiate antiviral therapy. HIV-negative controls were recruited from laboratory personnel. The accrual of samples and all experiments were performed with approval of the Committee of Human Research at the University of California at San Francisco.
TCR spectratyping
Total RNA was isolated with the Trizol reagent (Life Technologies, Bethesda, MD) from CD8+ cells positively selected with anti-CD8 antibody–coated magnetic beads (Dynal, Great Neck, NY). Purity of selected samples was assessed by flow cytometry. First-strand cDNA was synthesized with the SuperscriptII kit (Life Technologies) primed with random hexamers. Conditions for the generation of CDR3 size spectratypes and oligonucleotide primer sequences have been reported elsewhere.15 Briefly, the common TCRCB primer was end-labeled with γ32P-(dATP) and T4 polynucleotide kinase (New England Biolabs, Beverly, MA), and polymerase chain reaction (PCR) amplifications were performed in separate tubes (one per TCRBV family). Reactions were carried out in 25 μL PCR buffer (100 mmol/L Tris-HCl, pH 9.0, 500 mmol/L KCl, 1% Triton X-100, and 0.2% bovine serum albumin) containing 0.1 μmol/L each primer, 0.2 mmol/L dNTPs, 1.5 mmol/L MgCl2, and 2 U of Taq Polymerase (Perkin Elmer, Norwalk, CT). After 5 minutes of denaturation at 95°C, we performed 25 cycles of 94°C for 1 minute, 55°C for 1 minute, and 72°C for 1 minute, followed by a final extension of 45 minutes at 72°C. Typically, 4-μL aliquots were subjected to electrophoresis on 5.5% acrylamide:bisacrylamide (19:1) gels for 2 hours at 100 W. The gels were dried and exposed to high-sensitivity radiographic film (Hyperfilm; Amersham, Buckinghamshire, England) for 48 hours. Signals were quantified by digitizing the films with a scanner (UMAX Data Systems, Hsinchu, Taiwan). Molecular weights of individual bands (spectratypes) were assigned by analyzing the digitized images of the spectratypes in comparison with the Sequamark molecular-weight marker (Research Genetics, Huntsville, AL) with the Gelbase/Gelblot Pro 3.3 software (Ultra Violet Products, Upland, CA).
Statistical methods
Intensities of each spectratype for individual TCRBVfamilies were standardized to add to 100 so that the standardized intensity for each CDR3 length, in steps of 3 nucleotides, is interpretable as a percentage of the total profile. While potentially entailing some loss of information, this standardization eliminates uninformative variability in intensities arising from assay procedures. Based on these standardized intensities, the distance between samples was computed by summing half the absolute difference in intensity for each CDR3 length.9 In this computation, the intensity of an unrepresented CDR3 length was set at 0. These distances range from 0 to 100, in which 0 represents the distance between 2 identical samples and 100 represents 2 samples with no overlapping CDR3 profiles.
To assess divergence of the study participants from HIV-uninfected individuals, we computed composite control profiles for each TCRBV family by averaging the intensities at each CDR3 length across spectratypes for controls, including all samples from baseline to the end of their follow-up. The intensities for the composite control profiles also necessarily sum to 100. Then the distance between each spectratype and the composite profile for thatTCRBV family was computed. For the 4 controls, the composites used for comparison were based on data for the other 3 controls only; this procedure avoided comparing any control profile with a composite to which it had contributed information. In addition, to provide a measure of change within individuals over time, we calculated the distance between each follow-up sample and the baseline sample. Distance between sequential samples was also calculated as a means of assessing stabilization.16 We also analyzed the number of visible bands as an indirect measure of expansion or contraction of the repertoire.
Repeated-measures regression models17 were used to assess the associations of distances and band numbers with case or control status, time, and other predictors of interest. These models take into account the correlation between repeated measures for individual study participants and model the effect of TCRBVfamily in a parsimonious way. To normalize distances, the log transformation was used, with 1 point added to each raw distance before transformation to retain 0 values in the analysis. The log transformation was also used to normalize CD4+ and CD8+ cell numbers. To take into account within-subject correlation, all models included random effects for subject andTCRBV family, as well as correlations within subject andTCRBV family that were assumed to depend on the time separating the paired samples. Models for distances between sequential samples controlled for time between collection dates and for the author (A.S., M.K.E., or both) who performed the spectratyping of the paired samples. The analysis was performed using Proc Mixed in SAS, Version 6.12 (SAS Institute, Cary, NC).
Results
Patient demographics
Among the 15 cases, the mean age was 35 years (range, 24-53 years); 2 were women and 3 were from minority groups (one Asian, 2 Latino) (Table 1). The 4 uninfected controls ranged in age from 25 to 45 years and included one woman; all controls were white. Table 2 shows individual therapeutic protocols and CD4+ cell, CD8+ cell, and HIV-1 RNA values at time 0 (before initiation of therapy).
CD8+ TCR repertoire
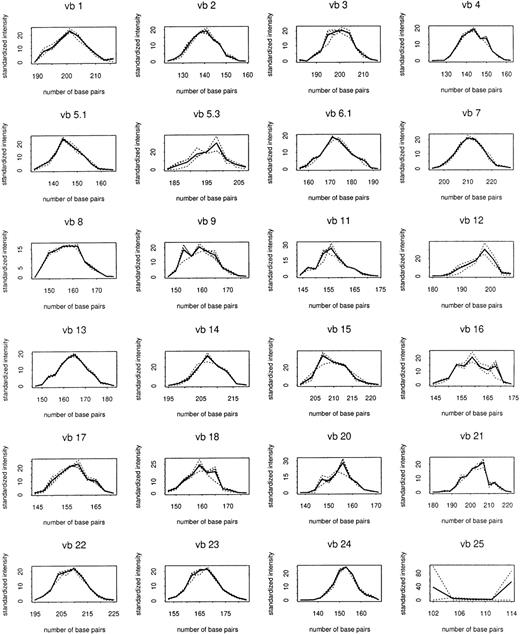
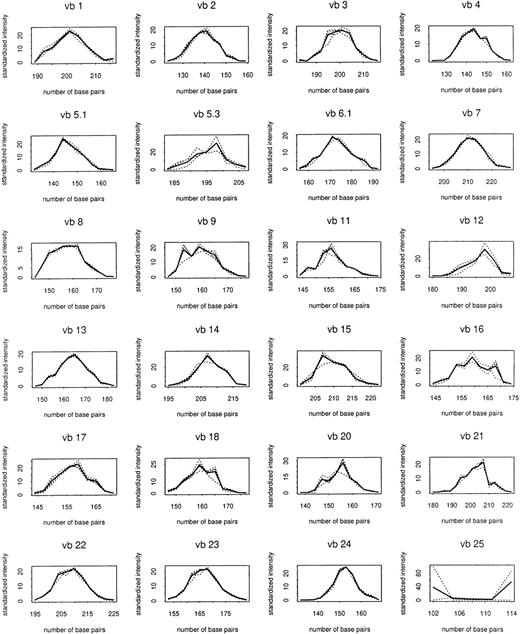
Total RNA was extracted from 125 CD8+cell–enriched samples sequentially obtained from patients and controls followed up to 72 weeks after entrance into the study. TCRBVgene diversity was analyzed by semiquantitative PCR of reverse-transcribed rearranged TCRβ-chain transcripts. Preliminary experiments showed that PCR replications of the same cDNA samples yielded almost identical results (data not shown). These initial experiments also indicated that PCR products accumulated exponentially for the first 30 to 35 cycles (data not shown). Therefore, in subsequent experiments the abundance of TCR transcripts was analyzed after 30 cycles of enzymatic amplification. Figure1 shows the composite control profiles for each TCRBV family and demonstrates the longitudinal stability of the CD8+ cell repertoire in uninfected individuals.
Composite control profiles for each
TCRBV family. Solid line shows profile averaged for 4 uninfected control subjects. Dashed lines show composites used in making comparisons with individual controls, which are averaged over the other 3 controls.
Composite control profiles for each
TCRBV family. Solid line shows profile averaged for 4 uninfected control subjects. Dashed lines show composites used in making comparisons with individual controls, which are averaged over the other 3 controls.
Repertoire profile and distances from composite control profiles
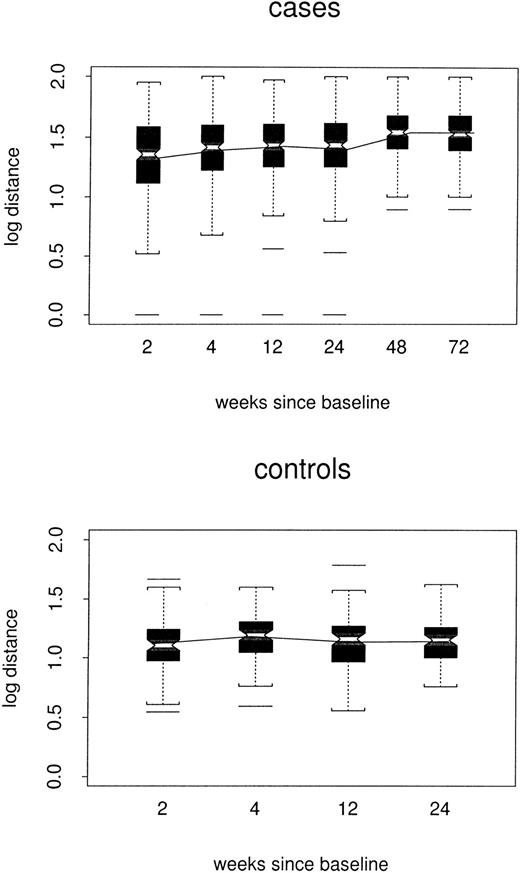
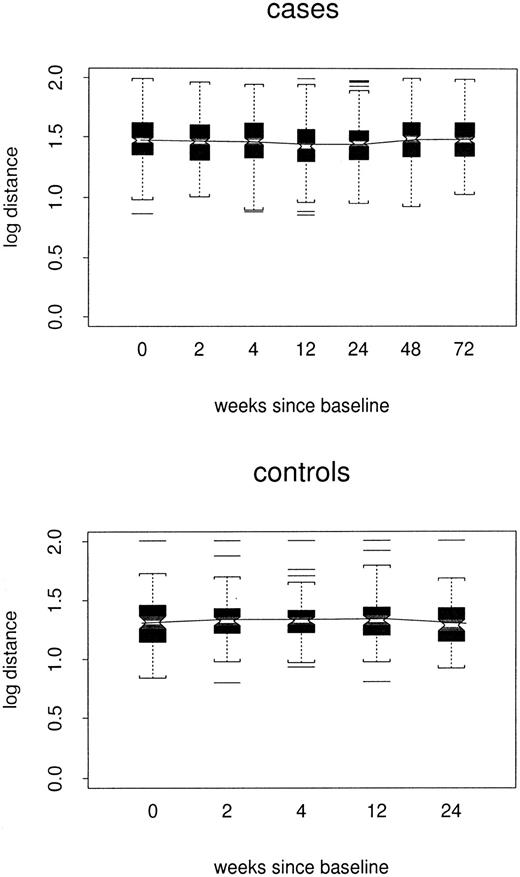
Log distances between repertoire profiles for individual samples and the composite control profile for corresponding TCRBVfamilies are shown by case/control status and week in Figure2. In the repeated-measures model, estimated log distance at week 24 was 0.16 point greater in cases than in controls1 (48 versus 1.32, P < .0001). At week 72, the estimated case/control difference remained 0.16 point. However, there was little evidence for any trend among either cases or controls (P = .11 and P = .32, respectively); nor did the 2 trends differ from each other (P = .20). Thus, the cases did not become either more or less like the composite control profiles over time.
Box plots of log distance from composite control profiles, by case/control status and week.
All TCRBV families are included. In each box plot, median values are marked by the notched horizontal bar. The box extends from the lower to the upper quartile of the distribution, thus giving the interquartile range (IQR). Dashed vertical lines extend from each end of the box for at most 1 IQR, or to the most extreme value. Outliers more than 1 IQR from the ends of the box are marked. The continuous line connects the mean values at each time point.
Repertoire profile and distances from baseline sample
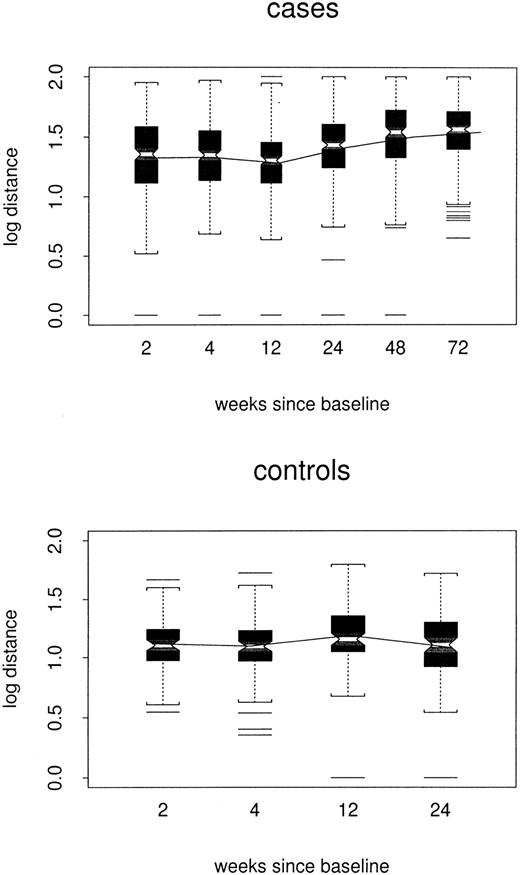
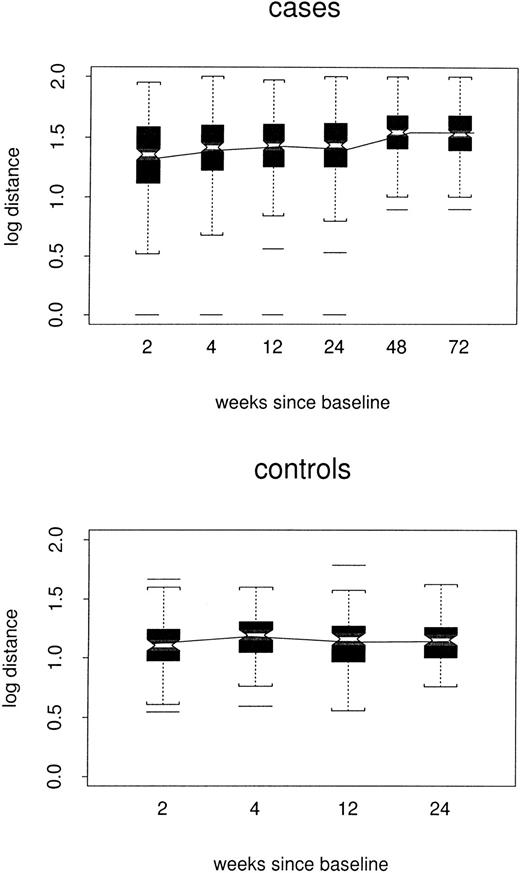
Log distances between baseline repertoire and follow-up samples are shown by week of follow-up and case/control status in Figure3. By week 24, estimated log distance in the repeated-measures model was 0.24 point higher among cases than among controls (1.38 versus 1.14, P < .0001) and increased slowly (0.002 log per week, P < .0001) to 0.33 point at week 72. There was no evidence to support a changing distance in controls (P = .67). Thus, among the cases, profiles slowly but progressively became less like the baseline profile, without becoming either more or less like the composite control profiles.
Box plots of log distance between baseline and follow-up samples, by case/control status and week of the follow-up sample.
All TCRBV families are included. The composite profile used for each control is based only on data for the other 3 controls.
Box plots of log distance between baseline and follow-up samples, by case/control status and week of the follow-up sample.
All TCRBV families are included. The composite profile used for each control is based only on data for the other 3 controls.
Repertoire profile and distances between sequential samples
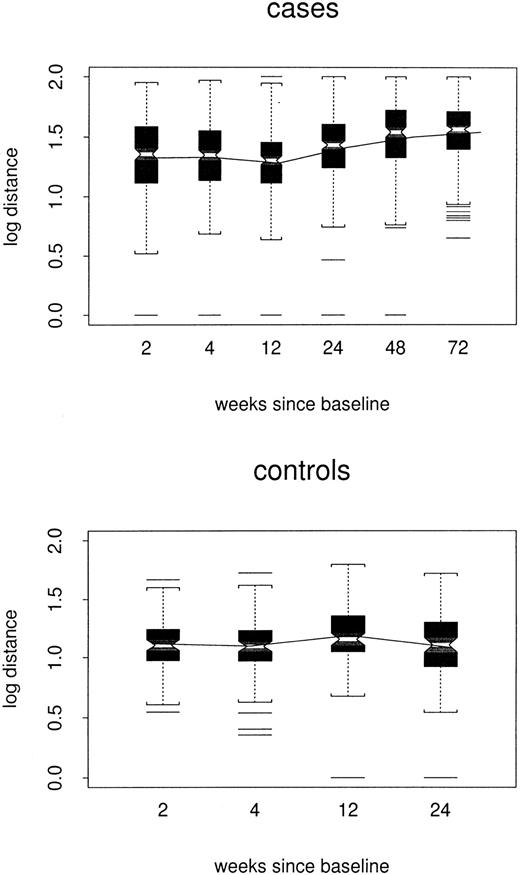
Log distance between sequential samples is shown by week of the later sample and case/control status in Figure4. In the repeated-measures model, estimated week-24 log distances were 0.16 point greater among cases than controls (1.26 versus 1.10, P = .02). After controlling for the time between the sequential visits, distances increased slowly in the case group (0.001 log per week,P = .03) but did not appear to change among controls (P = .47); by week 72, the estimated case/control difference was 0.21 point (P = .004). Thus, the data suggest that week-to-week changes in case profiles accelerated slightly over time.
Box plots of log distance between sequential individual samples, by case/control status and week of the later sample.
All TCRBV families are included.
Box plots of log distance between sequential individual samples, by case/control status and week of the later sample.
All TCRBV families are included.
Repertoire profile and distances in relation to CD4+and CD8+ cell numbers, viral load, and treatment
Trends in log distances from baseline and from composite control profiles were analyzed among cases using repeated-measures models controlling for the most recent CD4+ and CD8+ cell numbers, baseline log viral load, and changes in log viral load. Table 3 shows average values of these HIV progression markers by weeks since baseline. As expected, after initiation of treatment at week 0, log viral load decreased steadily; mean CD4+ cell numbers increased and CD8+ cell numbers decreased, although not uniformly.
Repeated-measures analyses of CD4+ and CD8+cell numbers, viral load, and treatment were calculated for 3 categories: (I) distance between each follow-up sample and the baseline sample for each participant, (II) distance between each follow-up sample for each participant and the composite profile of control uninfected individuals, and (III) distance between sequential samples for each participant as a means of assessing stabilization. For the first analysis, higher CD4+ cell numbers were associated with lower distances from the baseline repertoire (0.41 log per log CD4, P < .0001). CD8+ cell numbers and baseline viral load were not associated with this outcome. Notably, however, there was weak evidence of an association between decreasing current viral loads and higher distances from baseline (0.04 log per log viral load, P = .10). The increasing time trend found in the model contrasting cases and controls was unchanged by these adjustments. Lower distances between sequential samples were associated with both lower CD8+ cell count (0.21 log per log CD8,P = .02) and higher CD4+ cell count (0.19 log per log CD4, P = .04), but not with either measure of viral load. The increasing time trend in this measure was also unchanged after adjustment. Finally, lower distances from the composite control profiles were associated with higher CD4+ cell count (0.28 log per log CD4, P < .0001) and lower CD8+ cell count (0.25 log per log CD8,P < .0001), but not with viral load.
Six of 15 cases began treatment at baseline with a regimen of stavudine, didanosine, nelfinavir, and hydroxyurea (Table 2). The remaining 9 started on zidovudine, lamivudine, and either nelfinavir (n = 8) or indinavir (n = 1). Treatment regimen did not account for patterns in the distance from baseline, between sequential samples, or from average control profiles.
Repertoire profile and distances by V-beta family
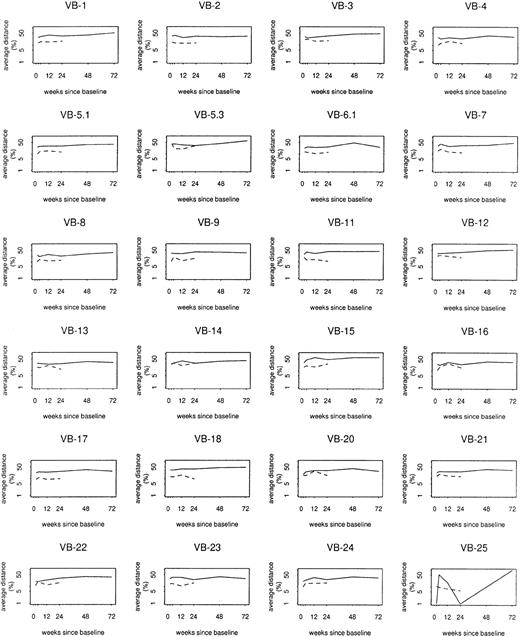
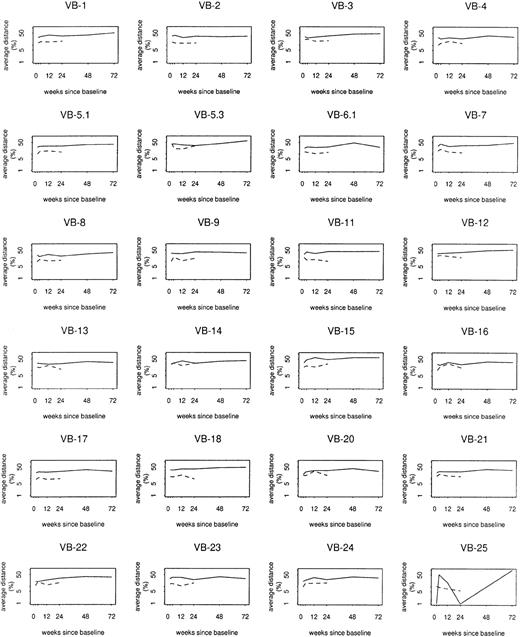
Mixed models were also used to assess case/control differences by individual TCRBV family. Whereas overall log distances from baseline, between sequential samples, and from composite control profiles varied at least weakly in relation to TCRBV family (P = .06, P = .05, and P = .002, respectively), case/control differences or trends in distance among cases did not vary significantly by TCRBV family (Figure5). At baseline, cases on average had 1.4 fewer bands than controls (P = .0002). However, there was an average increase of 0.26 band from baseline to week 72 (P = .04), accompanied by an average decrease of 0.48 band among controls during their 24 weeks of follow-up (P = .03). Thus, by week 24, the average case/control difference was reduced to 0.9 band (P = .03). Changes in multiple clonotypes, rather than a small number of specific expansions, most likely contributed to the overall perturbation detected in the study group.
Log distance from baseline by
TCRBV family. Solid lines show average profile changes for cases; dashed lines show average profile changes for controls.
Log distance from baseline by
TCRBV family. Solid lines show average profile changes for cases; dashed lines show average profile changes for controls.
Discussion
Analysis of the CD8+ T-cell response in experimental models of viral infection showed that antigen-specific naive CD8+ T cells divide vigorously after the viral challenge and increase in frequency up to 105-fold.18This massive CD8+ T-cell response normally will be resolved within a few days after the antigen has been cleared, leaving an enriched population of memory cells.18,19 The peripheral expansion of high-affinity CD8+ T cells that follows HIV infection appears to create a cellular pool large enough to control and eliminate virus-infected cells. However, the virus is not cleared completely, and a chronic infection develops with varying degrees of persistent viral replication. This state of ongoing latency, together with the fact that components of the immune system are actually the viral target, substantially affects the expansion/contraction homeostatic capability of CD8+ T cells, leading to serious deficiencies in the ability to sustain an adequate response against HIV. HAART can rapidly reduce the viral load and restore the peripheral CD4/CD8 T-cell ratio. Such effects are translated into a substantial decrease in disease progression and death rates from acquired immunodeficiency syndrome (AIDS).20 21 Starting treatment during primary infection may offer a better opportunity to preserve helper and effector immune functions. This study was designed to assess the integrity of the CD8+ cell compartment when antiretroviral therapy is applied very early in infection.
The molecular organization of the TCR genes and the rearrangement process that takes place during T-cell differentiation can be used for evaluation of T-cell diversity and therefore antigen reactivity.22 Early studies on T-cell repertoires focused on patients with full-blown AIDS and demonstrated the deletion from the peripheral circulation of T-cell subfamilies expressing particular TCRβ chains.7,23 Perturbations in the repertoire were also reported during the acute viremic and asymptomatic phases of HIV infection.4,16,24 Yet, some researchers have shown an activated but intact TCR repertoire during acute infection.25 Our population-based analysis of CD8+ cells isolated from individuals with primary infection treated with HAART showed changes in the repertoire, as measured by increasingly greater distances from baseline samples in cases versus controls. The distributions of distances between repertoire profiles for individual samples and a composite control profile for the corresponding TCRBV family were also clearly greater among cases than among controls.
In trying to uncover the variables affecting the CD8+ cell repertoire, we observed that higher CD4+ cell counts were associated with lower distances from the baseline sample, between sequential samples, and from composite control profiles. This finding is consistent with the recognition that the CD4+cell–mediated helper function is critical for the evolution of an effective cytotoxic T-lymphocyte response.26,27 Rosenberg et al28 demonstrated that in individuals who controlled viremia in the absence of antiviral therapy, polyclonal, persistent, and vigorous HIV-1–specific CD4+ T-cell proliferative responses were present, resulting in the elaboration of interferon-γ and -β chemokines. In addition, normalization of the CD4+cell repertoire has been observed in good responders to antiviral therapy.9 Preventing the destruction of or restoring the HIV-specific CD4+ T-cell responses appears fundamentally important for the development of therapeutic protocols and vaccines.
In their study, Rosenberg et al28 included 3 individuals treated with combination antiretroviral therapy before seroconversion. The lowering of plasma viral load was strongly associated with the generation of p24-specific CD4+ cell proliferative responses. In our study, viral load was not significantly associated with lower distance between either sequential samples or composite control profiles. Of interest, baseline viral load was not found to be associated with repertoire changes, but a counterintuitive weak association was detected between higher HIV-1 RNA levels and integrity of the repertoire, as measured by lower distance from baseline values in the CD8+ cell samples. Although not statistically significant, these data may reflect the complex and dynamic balance in the interaction between viral and host CD4+ and CD8+ T-cell responses. In a model of fluid T-cell homeostasis, antigen availability is an important factor in determining the fitness of competing clonotypes and the differential response to encounters with ubiquitous versus sporadic pathogens.26 29 A minimal critical degree of viral or vaccine-induced stimulation may be necessary to maintain adequate repertoire diversity in HIV-infected subjects. However, very little of the overall variance in the repertoire distances is explained by the HIV-1 RNA values, and further investigation is required to rule out a confounding effect of patient heterogeneity and other host factors.
The T-cell repertoire is rapidly compromised after HIV infection.30 Given the substantial oligoclonal expansions previously reported during primary infection, our data suggest the significant compensatory effect of early HAART treatment. This finding is in agreement with recent studies demonstrating the increase in production rates and half-life times of circulating lymphocytes13 and repertoire and function stabilization31 32 after the initiation of HAART. We also observed the sequential increase in the number of CD8+T-cell spectratypes. Yet there is a slow but consistent increase in distances between sequential samples, and substantial perturbations in the repertoire are evident 72 weeks after initiation of therapy. The long-term clinical significance of these perturbations remains uncertain, but they suggest a persistent effect of the virus on the immune system even when therapy is begun during primary infection. In addition to interfering with the cycles of HIV replication, immuno-enhancing strategies that prevent the disruption of homeostasis in the immune system may be needed to further affect the natural history of the disease. We suggest that immunomodulation will be most effective if administered early after infection, concomitant with HAART therapy.
Supported by National Institute of Allergy and Infectious Diseases grant 5U01AI41531. F.M.H. and J.O.K. are also supported by UCSF Center for AIDS Research grant P30MH59037.
The publication costs of this article were defrayed in part by page charge payment. Therefore, and solely to indicate this fact, this article is hereby marked “advertisement” in accordance with 18 U.S.C. section 1734.
References
Author notes
Jorge R. Oksenberg, Dept of Neurology, University of California at San Francisco, 513 Parnassus Ave, San Francisco, CA 94143-0435; e-mail: oksen@itsa.ucsf.edu.

