Abstract
Mutations affecting the conversion of spectrin dimers to tetramers result in hereditary elliptocytosis (HE), whereas a deficiency of human erythroid α- or β-spectrin results in hereditary spherocytosis (HS). All spontaneous mutant mice with cytoskeletal deficiencies of spectrin reported to date have HS. Here, the first spontaneous mouse mutant,sphDem/ sphDem, with severe HE is described. The sphDem mutation is the insertion of an intracisternal A particle element in intron 10 of the erythroid α-spectrin gene. This causes exon skipping, the in-frame deletion of 46 amino acids from repeat 5 of α-spectrin and alters spectrin dimer/tetramer stability and osmotic fragility. The disease is more severe insphDem/sphDem neonates than in α-spectrin–deficient mice with HS. Thrombosis and infarction are not, as in the HS mice, limited to adults but occur soon after birth. Genetic background differences that exist between HE and HS mice are suspect, along with red blood cell morphology differences, as modifiers of thrombosis timing.sphDem/sphDem mice provide a unique model for analyzing spectrin dimer- to-tetramer conversion and identifying factors that influence thrombosis.
Introduction
The human diseases severe hereditary spherocytosis (HS) and severe hereditary elliptocytosis (HE) are defined by pronounced hemolysis, splenomegaly, and abnormally shaped red blood cells (RBCs).1 The presence of elliptocytes and poikilocytes as well as spherocytes in peripheral blood smears differentiate HE from HS.1 Mutations that cause HS and HE disrupt the cytoskeleton, a multiprotein complex responsible for the elasticity and durability of the circulating RBCs. Spectrin tetramers that comprise the cytoskeletal framework are composed of heterodimers of α and β subunits. These are tethered to the plasma membrane proteins AE1 (band 3) and glycophorin C through the ankyrin/protein 4.2 complex and through protein 4.1R and its associated actin filaments, respectively.1 Mutations that decrease spectrin concentration or disrupt the association of spectrin with the plasma membrane result in HS.2 Mutations that affect the conversion of spectrin dimers to spectrin tetramers result in HE.2
To date, all spontaneous mutations in α-spectrin (Spna1sph, Spna1sph-2BC, and Spna1sph-J, hereafter, sph,sph2BC, and sphJ) and β-spectrin (Spnb1ja, hereafter, ja) that affect the RBC cytoskeleton in mice cause severe HS.3These mice have been instrumental in elucidating the genetic basis of the disease,3 the distribution of red cell proteins,4 and potential therapeutic measures.5 Recently, we have shown that, as adults, the mutant mice develop thrombosis in many tissues.5,6 Despite these thromboses, the mutant mice usually die of kidney failure accompanying progressive increases in hemosiderin.5
Until now, no spontaneous mutant mouse with HE has been described. This is unfortunate for 2 reasons. First, although the structural basis of spectrin dimerization and tetramerization has been elucidated in vitro, spectrin mutation sites in humans with HE suggest that lateral interactions in the heterodimer may affect tetramerization in vivo. A mouse model in which cell components have been genetically manipulated within cells with an otherwise identical genetic background could offer new insights into these interactions. Second, although the tissue distribution of erythroid spectrins is fairly well characterized, the pathologic differences between cells with an aberrant spectrin and those with a spectrin deficiency are not. In this report, we describe the first spontaneous mutation for HE in the mouse and compare its histopathology to mutants with HS.
Materials and methods
Animals
The sphDem mutation arose spontaneously on the CcS3/Dem recombinant congenic background. The CcS3/Dem colony is maintained through sib matings that generate wild type (+/+), heterozygous (sphDem/+), and homozygous (sphDem/sphDem) mice. Theja, sph, sph2BC, andsphJ mutations are maintained as heterozygotes on both the WB/Re (WB) and C57BL/6J (B6) genetic backgrounds. Homozygous (sph/sph,sph2BC/sph2BC, andsphJ/sphJ) mutant mice are produced as WBB6F1 hybrids. Mice are housed and cared for according to Association for Assessment and Accreditation of Laboratory Animal Care (AAALAC) specifications.
Complementation tests
Heterozygous sphDem/+ females were mated to male mice heterozygous for mutations in α-spectrin (sph, sph2BC,sphJ) and β-spectrin (ja). Affected offspring were an indication that the mutation was an allele of the test gene.
Blood parameters and scanning electron microscopy
RBC count, hematocrit, hemoglobin, mean cell volume (MCV), and mean corpuscular hemoglobin concentration (MCHC) were obtained by standard methods.7 Preparation of peripheral blood smears, reticulocyte enumeration, and scanning electron microscopy of RBCs were performed as previously described.7 Mice were between 1.5 and 5 months of age at the time of hematologic assessment.
Osmotic gradient ektacytometry
Fresh blood samples were continuously mixed with a 4% polyvinylpyrrolidone solution of gradually increasing osmolality (from 60-600 mOsm). The deformability index was recorded as a function of osmolality at a constant applied shear stress of 170 dyne/cm2 using an ektacytometer (Bayer Diagnostics, Tarrytown, NY).8
Sodium dodecyl sulfate-polyacrylamide gel electrophoresis (SDS-PAGE) and immunoblot analyses
RBC ghosts were prepared from packed red cells as previously described.3 Equal amounts of ghost proteins were electrophoresed on 4% stacking/10% separating Laemmli SDS-PAGE gels. Duplicate gels were run; one was stained with Coomassie Brilliant Blue9 and the other was transferred to Immobilon-P membranes (Millipore, Bedford, MA).9,10 Immunostaining was performed using the Alkaline Phosphatase Conjugate Substrate Kit (Bio-Rad, Hercules, CA). Two different rabbit polyclonal antibodies to mouse purified erythroid spectrin were used: the first (used in Figure2B) reacts similarly to α- and β-spectrin; the second (used in Figure 2E) reacts more strongly with α-spectrin than with β-spectrin.11
Spectrin extraction and PAGE separation of spectrin species
Spectrin extracts were prepared by incubation of RBC ghosts overnight at 0°C in low ionic strength buffer, followed by centrifugal separation of supernatant extracts and ghost residues.12 Dimer and tetramer spectrin species were separated by electrophoresis on 2% to 4% gradient nondenaturing polyacrylamide gels and visualized by Coomassie Brilliant Blue staining.13 Band intensities in both native and denaturing PAGE gels were quantified using a Molecular Dynamics (Sunnyvale, CA) Densitometer and Imagequant software.
Preparation of RNA
Reticulocytes from phenylhydrazine-treated normal14and mutant mice were isolated from heparinized blood collected by cardiac puncture. Spleens were obtained after transcardial perfusion of cold 1X phosphate-buffered saline (PBS; Gibco/BRL, Grand Island, NY). Total RNA was isolated using TRIZOL reagent (Gibco/BRL).
Northern analyses
Northern analyses were performed using the NorthernMax kit (Ambion, Austin, TX). Total RNA (5 μg) was separated by electrophoresis on 1% formaldehyde-based agarose gels in MOPS/sodium acetate/EDTA running buffer (Ambion) and transferred to BrightStar Plus membranes (Ambion). Equivalency of RNA loading was verified by UV shadowing.15 Antisense RNA probe corresponding to nucleotides 7065 to 7322 of the murine erythroid α-spectrin complementary DNA (cDNA) sequence (GenBank accession no. AF093576) was produced by the Lig'n'Scribe kit (Ambion) and32P-labeled, using the StripEZ labeling kit and SP6 RNA polymerase (Ambion). Filters were hybridized at 65°C in NorthernMax hybridization buffer (Ambion). Final filter wash was at 65°C in 0.1X sodium chloride/sodium citrate (SSC), 0.1% SDS.
Reverse transcriptase-polymerase chain reaction (RT-PCR) and sequencing of normal and mutant α-spectrin alleles
RT-PCR was performed as previously described on total spleen RNA from CcS3/Dem-+/+ and CcS3/Dem-sphDem/sphDemmice.16 Twelve overlapping RT-PCR fragments were generated to span the α-spectrin cDNA sequence. Fragments were sequenced by the dideoxynucleotide chain termination method,17using M13 forward and reverse primers and T7 DNA polymerase (TaqFS, ABI, Foster City, CA). Sequence data were analyzed using the Sequencher DNA analysis software package (ABI).
Genomic PCR and sequencing
Isolation and PCR of genomic spleen DNA from wild type (+/+), heterozygous (sphDem/+), and homozygous mutant (sphDem/sphDem) mice were performed as previously described.18 PCR products were electrophoresed on 1% agarose gels. PCR products were sequenced and analyzed as described above. Long PCR of genomic DNA with primers 67 (5′-CCCTGGCTCTTCTAGTCT-3′) and 35 (5′-CTCTTGTCTGCTCATCCAAC-3′) was carried out with the DyNAzyme EXT PCR system (Finnzyme).
Genomic DNA was isolated from tails of +/+ andsphDem/+ mice as previously described.19 Tail DNA PCR was performed in 2 reactions, one using primers 67 and 35 (defined above), the other containing primers 67 and 69r (5′-TCCCTGATTGGCTGCAGCCCA-3′). The first reaction detects the wild type allele of Spna1; the second reaction detects the insertion in the sphDem allele. PCR products were electrophoresed on 2% SeaPlaque-GTG (FMC) agarose gels.
Histology
Heart, liver, kidney, and spleen were removed from euthanized adult mice after transcardial perfusion with 1X PBS followed by Bouin fixative. Neonates were fixed whole after euthanization. Embedded and sectioned tissues were stained with hematoxylin and eosin (H&E) or Gomori iron stain for nonhemoglobin iron.
Results
The new mutation, its origin, and allelism to α-spectrin mutations
The CcS3/Dem strain is one of 20 recombinant congenic strains produced between the BALB/cHeA and STS/A inbred strains.20-22 In 1991, a recessive mutation arose spontaneously on the CcS3/Dem background in the colonies of Dr P. Demant at The Netherlands Cancer Institute. Initial observations identified normocytes and stipple cells in neonatal blood. Mutant neonates were jaundiced and had liver degeneration. Older mutants exhibited hyperplastic erythropoiesis in spleen and bone marrow, splenomegaly, and liver and kidney degeneration. The mutant mice were imported to The Jackson Laboratory by Dr Barker in 1996.
Initial observations suggested the mutant mice had hemolytic anemia. Matings between heterozygotes for the new mutation and heterozygotes for the sph, sph2BC, andsphJ mutations in α-spectrin, but not the ja mutation in β-spectrin, produced mutant offspring (Table 1). The new mutation in the erythroid α-spectrin gene, Spna1, was designatedsphDem to reflect its allelism to existing α-spectrin mutations.
Hematologic analysis ofsphDem/sphDemmice is consistent with severe HE
sphDem/sphDem mice suffer from severe anemia characterized by RBC counts, hematocrits, and hemoglobins that are 48%, 57%, and 38% of normal, respectively (Table2). MCV is increased and MCHC is decreased in the mutants, most likely reflecting the marked reticulocytosis (50%). Blood parameters in heterozygous (sphDem/+) mice mirrored those seen in +/+ mice (data not shown).
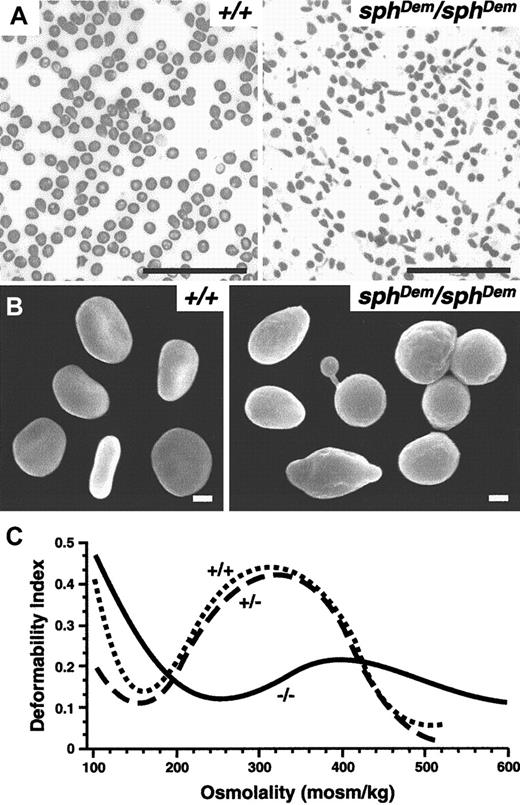
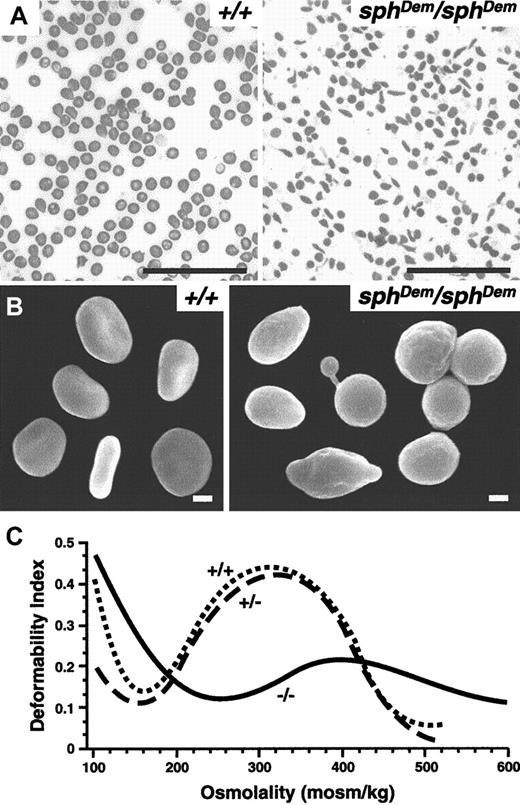
Peripheral blood smears reveal the presence of elliptocytic as well as spherocytic and occasional poikilocytic RBCs insphDem/sphDem mice (Figure1A). Scanning electron microscopy confirms the variability in RBC shapes (Figure 1B). The variety of RBC shapes observed in sphDem/sphDemmice are in stark contrast to the strictly spherocytic RBCs observed in all other mice described to date with cytoskeletal defects.3 7 The observations insphDem/sphDem mice are consistent with observations made in peripheral blood smears from humans with severe HE. Blood smears and scanning electron microscopy of RBCs from heterozygous mice revealed no abnormalities (data not shown).
sphDem/sphDemmice have severe HE.
(A) Wright-stained peripheral blood smears from +/+ (left panel) andsphDem/sphDem (right panel) mice. Note the presence of spherocytic, elliptocytic, poikilocytic, and fragmented RBCs in the mutant mice. Bar, 5 μm. (B) Scanning electron microscopy of RBCs from +/+ (left panel) andsphDem/sphDem (right panel). Note the abnormally shaped RBCs in the mutant. Bar, 1 μm. (C) Osmotic deformability profiles of RBCs from wild type (+/+), heterozygous (sphDem/+), and homozygous (sphDem/sphDem) mice.
Osmotic deformability profiles of blood samples from wild type (+/+), heterozygous (+/−) and homozygoussphDem/sphDem (−/−) mice are shown in Figure 1C. The maximum value of the deformability index attained at physiologically relevant osmolality (DImax) is quantitatively related to the mean surface area of the cells.8 The osmolality at which the deformability index reaches a minimum in the hypotonic region of the gradient (Omin) is a measure of the osmotic fragility of the cells.8 RBCs from heterozygotes do not have significantly different osmotic deformability profiles than wild type RBCs. In contrast, RBCs fromsphDem/sphDem mice exhibit a profound decrease in surface area (decreased DImax) and a marked increase in osmotic fragility (increased Omin). The decrease in surface area is consistent with the marked fragmentation of thesphDem/sphDem RBCs and is slightly less than the decrease in surface area observed in sph/sphRBCs (relative decrease in DImax compared to wild type of 54% versus 70% for sph/sph).16
Hereditary pyropoikilocytosis (HPP) is distinguished from severe HE in humans by increased thermal sensitivity of HPP RBCs relative to HE (or HS) RBCs.23 Accordingly, we attempted to use established protocols to determine whethersphDem/sphDem RBCs exhibited increased thermal sensitivity. Unfortunately, mouse RBCs do not react in these tests in the same manner as human RBCs, and we were unable to measure the thermal sensitivity ofsphDem/sphDem versus +/+ RBCs (data not shown).
sphDem/sphDemmice are deficient in erythroid spectrin
Coomassie Blue-stained SDS-PAGE gels of RBC ghosts show an extreme deficiency of spectrin and ankyrin insphDem/sphDem mice: α-spectrin:band 3 is 1.3% of normal, β-spectrin:band 3 is 4.4% of normal, and ankyrin:band 3 is 10% of normal (Figure2A and Table3). Immunoblot analyses (Figure 2B) of RBC ghosts with an antibody that reacts similarly to α- and β-spectrin confirm thatsphDem/sphDem mice are deficient in both α- and β-spectrin. An aberrant 65-kd immunoreactive protein is seen in sphDem/sphDem ghosts that is not observed in other mutant mice. Immunoblot analyses with an antibody that detects α-spectrin more efficiently than β-spectrin suggest that this aberrant protein is a fragment of α-spectrin (see below).
sphDem/sphDemmice have defective dimer/tetramer complexes.
(A) SDS-PAGE of RBC ghost proteins from +/+ (lanes 1, 6) and mutant (lanes 2, 3, 4, 5) mice. Strain background and genotype of mice are indicated above each lane. Size markers indicated on left; relative positions of α-spectrin (α), ankyrin (ANK), β-spectrin (β), and band 3 (b3) indicated on right. Ratios of α, ANK, and β to b3 are listed in Table 3. (B) Immunoblot of RBC ghost proteins from +/+ (lanes 1, 6) and mutant (lanes 2, 3, 4, 5) mice. Strain background and genotype of mice are indicated above each lane. Primary antibody detects α- and β-spectrin equally. Size markers indicated on left; relative positions of α- and β-spectrin indicated on right. Arrow on right marks position of the 65-kd immunoreactive protein insphDem/sphDem mice (lane 2). (C) Representative native PAGE of 0°C low ionic strength spectrin extracts from RBC ghosts of +/+ (lane 1) and mutant (lanes 2, 3) mice stained with Coomassie Blue. Genotype of mice is indicated above each lane. Positions of spectrin dimers [D] and tetramers [T] are indicated on right. Densitometric values (in pixels): +/+[D] = 60;+/+[T] = 425; +/+[D]:[T] ratio = 0.14:1;sphJ/sphJ[D] = 11;sphJ/sphJ[T] = 109;sphJ/sphJ[D]:[T] ratio = 0.10:1. (D) SDS-PAGE of RBC ghost (lanes 1, 3, 5) and spectrin extract (lanes 2, 4, 6) proteins from +/+ (lanes 1, 2) and mutant (lanes 3-6) mice. Genotype of mice is indicated above each pair of lanes. Size markers indicated on left; positions of α- and β-spectrin indicated on right. (E) Immunoblot of RBC ghost (lanes 1, 3, 5) and spectrin extract (lanes 2, 4, 6) proteins from +/+ (lanes 1, 2) and mutant (lanes 3-6) mice. Genotype of mice is indicated above each pair of lanes. Primary antibody detects α-spectrin more efficiently than β-spectrin. Size markers indicated on left; positions of α- and β-spectrin indicated on right. Arrow on right marks 65-kd immunoreactive protein insphDem/sphDem mice (lanes 3, 4).
Native and denaturing PAGE suggests defective dimer/tetramer stability in sphDem/sphDemmice
Humans with HE show an increase in the spectrin dimer-to-tetramer ratio.1 Spectrin dimer-to-tetramer ratios were compared in extracts from +/+, sphDem/sphDem,sph/sph, sph2BC/sph2BC, and sphJ/sphJ RBC ghosts. These extracts were analyzed by native PAGE (Figure 2C). Spectrin extracts from the negative controls, sph/sph andsph2BC/sph2BC, do not have detectable α-spectrin monomer (Figure 2A,B) and do not contain either spectrin dimers or tetramers (data not shown). The dimer-to-tetramer ratio is similar in +/+ andsphJ/sphJ extracts (0.14:1 and 0.1:1, respectively; Figure 2C legend). In contrast, distinct dimer and tetramer bands are not resolved fromsphDem/sphDem spectrin extracts (Figure 2C, lane 2). SDS-PAGE analyses (Figure 2D) reveal no increase in protein bands in spectrin extracts (lanes 2, 4, 6) as compared to RBC ghosts (lanes 1, 3, 5). The amount of apparently full-length α- and β-spectrin monomer insphDem/sphDem spectrin extract is similar to the monomer amounts insphJ/sphJ spectrin extracts, suggesting that sufficient monomers are present to generate detectable dimers and tetramers. Immunoblot analyses with an antibody that reacts more strongly to α- than β-spectrin (Figure 2E) confirm the presence of immunoreactive fragments in +/+,sphDem/sphDem, andsphJ/sphJ spectrin extracts. The segregation of presumed proteolytic fragments immediately below β-spectrin in sphDem/sphDemspectrin extracts but not insphJ/sphJ spectrin extracts raises the possibility that these fragments may interfere with proper association of full-length monomers. The strong labeling of the 65-kd protein in both sphDem/sphDem ghosts and spectrin extracts with this antibody suggests that it is a fragment of α-spectrin that segregates with the spectrin fraction in extracts.
Identification of the molecular defect in the α-spectrin gene in sphDem/sphDemmice
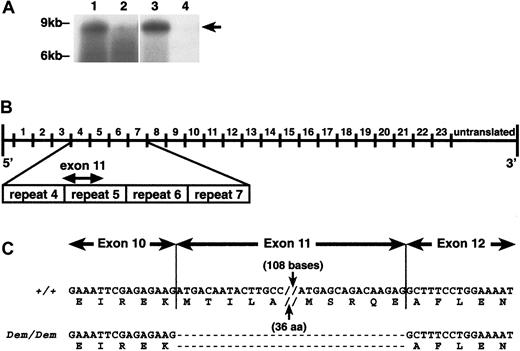
The erythroid α-spectrin transcript levels insphDem/sphDem spleen and reticulocytes are decreased when compared to transcript levels in +/+ tissues (Figure 3A). The decrease in mutant α-spectrin transcript is more pronounced in reticulocytes than spleen. This suggests that the mutant α-spectrin transcript is unstable and is degraded as erythroid precursors mature. Transcripts encoding the 65-kd protein seen on immunoblots could not be clearly resolved.
Analysis of
sphDem/sphDem cDNA sequence. (A) Northern blots of total RNA from spleen (lanes 1, 2) and reticulocytes (lanes 3, 4) of +/+ (lanes 1, 3) andsphDem/sphDem(lanes 2, 4) mice. UV shadowing was used to check RNA loading. Size markers are indicated on the left. Arrow on right identifies the +/+ 8-kb transcript. (B) Schematic representation of the Spna1 cDNA with numbers above the line corresponding to the repeats of 106 aa that comprise the α-spectrin protein. Shown below the cDNA schematic is an enlargement of repeats 4 through 7 of α-spectrin, with the location of exon 11 identified. (C) α-Spectrin cDNA sequence obtained from spleen RNA of wild type (+/+) and sphDem/sphDem(Dem/Dem) mice. Shown directly below each cDNA sequence is the corresponding protein sequence. Note the lack of exon 11 sequence in the cDNA from sphDem/sphDem mice and that this deletion does not alter the translational reading frame.
The presence of α-spectrin mRNA insphDem/sphDem spleen allowed us to utilize RT-PCR techniques to identify the sphDemmutation. Comparison of cDNA sequence from +/+ andsphDem/sphDem mice indicated that exon 11 was absent in sphDem/sphDemα-spectrin messenger RNA (mRNA). This 138 nucleotide (nt) deletion results in the in-frame deletion of 46 amino acids (aa) from repeat 5 of the α-spectrin protein (Figure 3B,C). No other anomalies were found in the mutant α-spectrin cDNA sequence.
Amplification of genomic spleen DNA using exon 11-specific primers showed that exon 11 is present in the genomic DNA ofsphDem/sphDem mice (data not shown). This suggested a mutation within exon 11 or flanking introns resulting in aberrant splicing and the skipping of exon 11 in the mature mRNA. Sequencing of exon 11 and intron 11 from genomic DNA revealed no discrepancies between normal and mutant sequences (data not shown). Sequencing of all but the most 3′ portion of intron 10 did not identify sequence abnormalities insphDem/sphDem genomic DNA (data not shown). Attempts to amplify the 3′ end of intron 10 from mutant DNA failed, suggesting a large insertion was present.
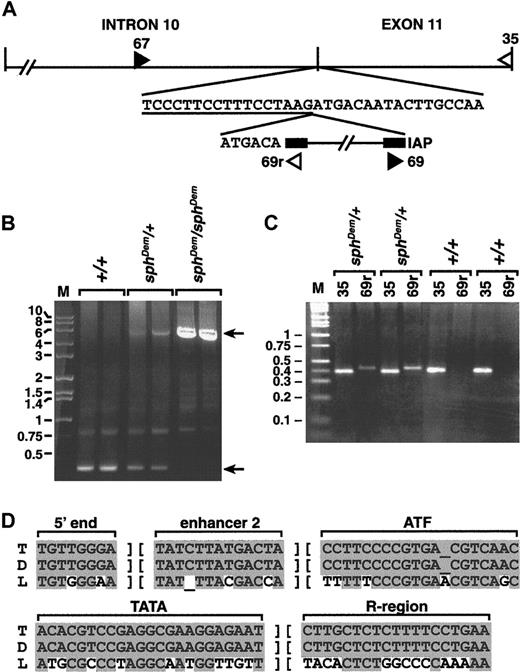
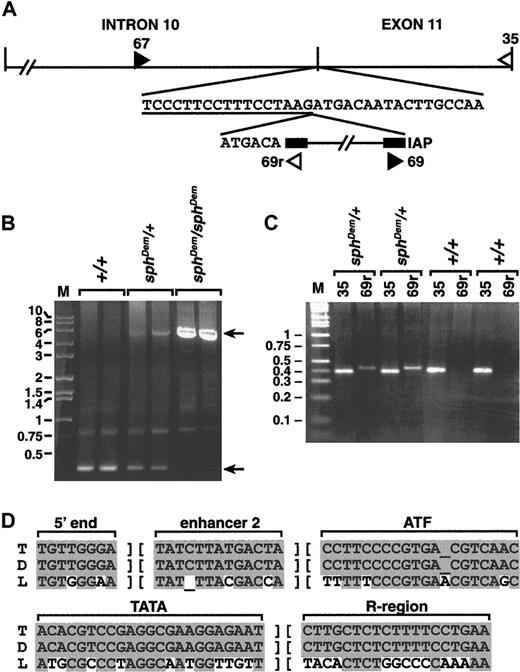
Southern blot analyses indicated that the insertion in thesphDem allele was between 3 and 6 kilobases (kb) in length (data not shown). Standard genomic PCR using primers 67 and 35 (Figure 4A), only 350 base pairs (bp) apart in the normal allele, failed to yield a product fromsphDem/sphDem DNA (data not shown). Long-range genomic PCR produced a product of approximately 5.75 kb from heterozygous (sphDem/+) and mutant (sphDem/sphDem) DNA, and the expected 350 bp product from wild type (+/+) and heterozygous (sphDem/+) DNA (Figure 4B).
Analysis of
sphDem/sphDem genomic DNA. (A) Top line, schematic of intron 10 and exon 11 of theSpna1 gene. Vertical lines denote exon/intron boundaries. Second line, normal sequence at the intron 10/exon 11 boundary; intron sequence is underlined. The IAP element present in thesphDem allele is shown on the third line, flanked by its LTR sequences (black boxes). The 6 bases preceding the IAP element on the third line represent exon 11 sequence duplicated by insertion of the element. Double hatch (//) marks denote sequence not represented in the figure. Filled and open triangles show the location of forward and reverse PCR primers, respectively. Sequence of PCR primers 67, 35, and 69r is found in the “Materials and methods” section; primer 69 is the complement of primer 69r. (B) Long PCR of genomic DNA from +/+ (lanes 2, 3), sphDem/+ (lanes 4, 5), and sphDem/sphDem(lanes 6, 7) mice with primers 67 and 35. M, marker lane, sizes of markers in kb are indicated on left. Top arrow on right identifies the 5.75-kb band resulting from amplification of the insert-containingsphDem allele of Spna1. Bottom arrow on right identifies the 0.35-kb band resulting from amplification of the normal allele of Spna1. (C) Genomic PCR of tail DNA from 2 different +/+ and sphDem/+ mice. Lane M is marker; sizes in kb are shown on left. Lanes ‘35’: PCR products from a reaction containing primers 67 and35 that will amplify the wild type allele of Spna1. Lanes ‘69r’: PCR products from a reaction containing primers (67 and 69r) designed to identify the IAP insertion in the sphDem allele. Genotype of mice is noted above each bracketed pair of reactions. (D) ThesphDem IAP is in the T subclass. Sequences of LTR elements derived from LS-type (‘L’, bottom line)24and T-type (‘T’, top line)25,26 IAP elements compared to that of the IAP element inserted in intron 10 of thesphDem allele of Spna1 (‘D’, middle line). The regions of sequence shown are used to classify IAP elements.24 Shaded bases represent sequence identity; nonshaded bases represent sequence divergence.
The size of the insert is similar to that reported for ETn transposons and deleted type I intracisternal A particle (IAP) elements.24-28 Genomic PCR with primers 67 or 35 paired with primers specific for the long terminal repeat (LTR) of ETn transposons (kindly provided by V. Letts, The Jackson Laboratory) failed to yield products (data not shown). Amplification using primers 67 or 35 paired with primers specific for IAP LTRs (69 and 69r, Figure 4A; kindly provided by B. Gwynn, The Jackson Laboratory) generated products fromsphDem/sphDem andsphDem/+ DNA, but not from +/+ DNA (data not shown). To confirm that the insertion of the IAP element is thesphDem mutation, genomic PCR of tail DNA from known +/+ and sphDem/+ mice was performed. PCR with primers designed to identify the normal α-spectrin allele yields a product in both +/+ and sphDem/+ mice (Figure4C, lanes 35). Amplification with primers designed to identify the α-spectrin IAP insertion is successful only insphDem/+ mice (Figure 4C, lanes 69r). These data confirm that the insertion of the IAP element segregates with thesphDem mutation.
Additional sequencing identified the exact location of the insertion of IAP element within the α-spectrin gene. The IAP element is at the junction between intron 10 and exon 11; a target site duplication of the first 6 bp of exon 11 occurs at the 5′ junction of the IAP insertion (Figure 4A). In Figure 4D, portions of the LTR sequence obtained for the IAP element in thesphDem α-spectrin allele (middle line) are compared with consensus LTR sequences of IAP elements in the T (top line) and LS (bottom line) subclasses. The LTR sequences of the IAP element inserted intosphDem α-spectrin allele are identical to those of the T subclass of IAP elements.
Pathology of neonatalsphDem/sphDemmice differs from that in sph/sph mice
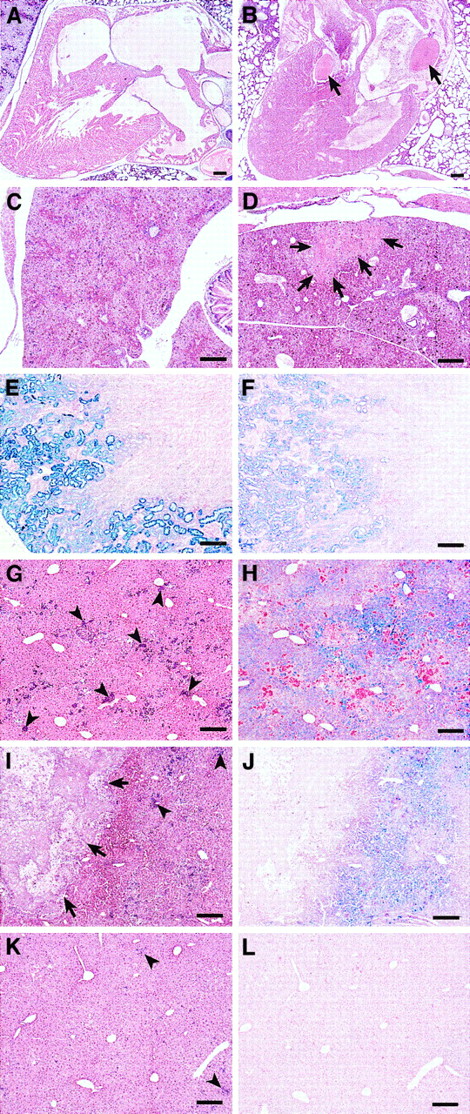
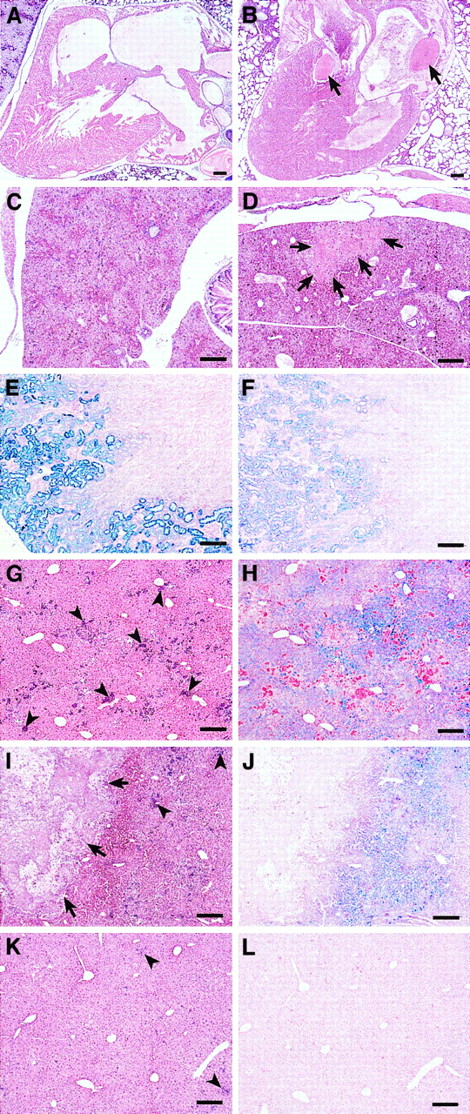
A high percentage ofsphDem/sphDem mice do not survive the neonatal period; only 32% ofsphDem/sphDem neonates survive to weaning at 4 weeks of age, compared with 70% of sph/sphneonates (Table 4). Unlikesph/sph and +/+ neonates, cardiac or liver thrombi are present in approximately 69% ofsphDem/sphDem neonates, whereas liver infarctions are observed in 88% ofsphDem/sphDem neonates (Table 4, Figure 5A-D, and data not shown).
Histopathology of neonatal and adult
sphDem/sphDem mice.Histological sections of heart, liver, and kidney fromsph/sph and sphDem/sphDemmice. Bars = 20 μm. (A, C, E, G, H): sph/sph. (B, D, F, I, J, K, L): sphDem/sphDem. (A,B): Heart sections of neonates stained with H&E. Note the presence of thrombi (indicated by arrows) in the valve and atrium of (B). (C,D): Liver sections from neonates stained with H&E. Note the presence of an infarcted region (identified by arrows) in (D). (E,F): Kidney sections from adult mice, stained with Gomori iron stain, which stains nonhemoglobin iron blue. (G,I,K): Liver sections from adult mice stained with H&E. Clusters of extramedullary hematopoiesis (arrowheads) stain purple. Arrows in (I) identify a large calcified lesion indicative of earlier infarction. (H,J,L): Identical regions of liver as shown in (G,I,K), stained with Gomori iron stain.
Pathology of adultsphDem/sphDemmice
The average life span ofsphDem/sphDem mice that survive to weaning is 2.5 months, compared to 6.7 months for sph/sphmice (Table 4) and approximately 24 months for normal mice. Spleen-to-body weight, heart-to-body weight, and liver-to-body weight ratios are all increased insphDem/sphDem mice, and the spleens are highly erythroid, comparable to observations made insph/sph mice.5 6 Similar to sph/sphmice, a high percentage of adultsphDem/sphDem mice have cardiac thrombi. Unlike sph/sph mice, cardiac thrombi are observed in sphDem/sphDem mice younger than 6 weeks of age (data not shown).
The kidneys of sphDem/sphDem mice show glomerulonephritis and accumulation of hemosiderin-laden casts in the renal tubules. The concentration of renal hemosiderin is less insphDem/sphDem mice (Figure 5F) than in sph/sph mice (Figure 5E). Similarly, extramedullary hematopoiesis in the liver ofsphDem/sphDem mice (arrowheads, Figure 5I,K) is less than that observed in sph/sph mice (arrowheads, Figure 5G).sphDem/sphDem mice frequently have calcified lesions in the liver (arrows, Figure 5I) that are indicative of infarctions that likely occurred in the neonatal period. Such calcified lesions are not seen in the livers ofsph/sph mice (Figure 5G). Unlike sph/sph mice, which show pervasive hemosiderin deposition in hepatocytes (Figure 5H),sphDem/sphDem mice show little or no hemosiderin (Figure 5L), except in regions of liver immediately surrounding calcified lesions (Figure 5J). The histopathology noted in both sph/sph andsphDem/sphDem mice is not seen in +/+ mice.5 6
Discussion
In the present study, we describesphDem/sphDem mice with a mutation in erythroid α-spectrin that represents the first mouse model for severe HE in humans. The lack of HE in mice with cytoskeletal deficiencies until this point has prompted many to presume that physiologic and/or physical differences in mouse RBCs prevent the assumption of an elliptocytic or poikilocytic shape. It is possible that mice with mild or asymptomatic HE would remain undetected unless a blood smear was performed. Reanalysis in light of the current discovery and the molecular definition of preexisting mutations causing HS provide another explanation for the lack of HE in previous mouse mutants. HS results from spectrin deficiency; HE results from disruption of dimer-to-tetramer conversion through mutations in protein 4.1R, β-spectrin, or α-spectrin.2 Mouse protein 4.1R-deficient RBCs, in contrast to human protein 4.1R-deficient RBCs, are also deficient in spectrin, which may explain their spherocytic rather than elliptocytic appearance.29β-Spectrin-deficient ja/ja mice have a nonsense mutation in β-spectrin repeat 9, causing complete deficiency of both α- and β-spectrin.4
Three α-spectrin mouse mutants, sph/sph,sph2BC/sph2BC, andsphJ/sphJ, have HS. Thesph2BC and sphJ mutations are in the 3′ end of α-spectrin, distant from the self-association site,30 and do not affect tetramerization (Figure 2). In fact, sphJ α-spectrin tetramerizes, but the α-spectrin is not stably bound to the membrane, resulting in spectrin deficiency.3 The sph mutation is a single-base deletion in repeat 5 of α-spectrin, resulting in a complete absence of α-spectrin.16 The sphDemmutation, although near the sph mutation, produces different effects. The IAP insertion leads to the in-frame deletion of 46 amino acids from repeat 5 of α-spectrin; the apparently full-length product observed in immunoblot analyses is most likely the deleted protein. The location of the sphDem mutation is similar to the location of several mutations associated with human HE that produce in-frame deletions in α-spectrin.2 LikesphDem, one of these human HE mutations, spectrin Dayton, is also the result of the insertion of a mobile DNA element.31 The insertion of mobile DNA elements does not always lead to a mutant phenotype. In sphDem and spectrin Dayton, the location of the mobile element likely disrupts normal scanning and splicing, leading in both cases to exon skipping and protein disruption.
The RBC morphology seen insphDem/sphDem mice is consistent with that seen in human severe HE.2 Several human α-spectrin mutations associated with severe HE, notably αAlexandria, αSt Claude, αOran, and αBarcelona, occur at equivalent or greater distances from the tetramerization site assphDem.32-35 The severe effect of mutations distant from the minimal tetramerization site suggests that structural flexibility in vivo affects spectrin dimer-to-tetramer conversion. The sphDem mutation provides an easily accessible model system in which to examine structural integrity and dimer-to- tetramer conversion in vivo. Although thesphDem mutation is 3′ to the previously described minimal α-spectrin tetramerization site,36 37the deletion in the sphDem protein nevertheless destabilizes both dimer and tetramer structure, suggesting that the deleted amino acids are central to tetramerization. Additional immunoblot analyses with region-specific antibodies as well as direct sequencing of the aberrant 65-kd protein seen on Western blots will provide information on the nature and identity of this fragment and possible contributions to the mutant phenotype.
The difference in pathology betweensphDem/sphDem and sph/sphmice may be related to disparate pathologic effects of elliptocytic versus spherocytic RBCs, respectively. Alternatively, genetic differences between the strain background of thesphDem and sph mutations (CcS3/Dem versus WBB6F1, respectively) may affect the pathology of the mutant mice. The latter possibility is being addressed by transferring thesphDem mutation onto the WBB6F1 background and assessing any changes in the pathology ofsphDem/sphDem neonates or adults. The most intriguing difference in the pathology ofsphDem/sphDem mice is the much earlier initiation of thrombosis as compared to sph/sph mice (neonatal versus 6 weeks of age, respectively). Neonatal thrombosis has also been noted in one line of band 3 knockout mice maintained on yet another mixed genetic background.38 Thrombotic events affect a small number of patients with HS but a much larger percentage of patients with β-thalassemia or sickle cell disease.39-43 Analyses of the pathophysiologic and/or genetic factors responsible for the earlier initiation of thrombosis insphDem/sphDem mice will increase our understanding of thrombogenesis in the context of hemolytic anemia and will provide a means to identify those patients at increased risk for developing thrombotic complications.
Acknowledgments
The authors thank Luanne Peters, David Serreze, and Babette Gwynn for critical review of the manuscript. We thank Verity Letts and Babette Gwynn for sharing ETn-specific and IAP-specific primers, and Katherine John for discussions on dimer/tetramer analyses. We greatly appreciate the technical assistance of Lesley Bechtold in Biological Imaging, Amy Lambert and Andrea Ried in Microchemistry Services, and Jennifer Smith in Graphics Services at The Jackson Laboratory.
Supported by European Commission grants CHRXCT-930181 and BIO4-CT97-4850 to P.D., National Institutes of Health (NIH) grant R01 HL29305 to J.E.B., NIH grant R01 DK26263 to N.M., NIH grant NRSA F32 DK09482 to N.J.W., and NIH Core Grant CA34196 to The Jackson Laboratory.
The publication costs of this article were defrayed in part by page charge payment. Therefore, and solely to indicate this fact, this article is hereby marked “advertisement” in accordance with 18 U.S.C. section 1734.
References
Author notes
Jane E. Barker, The Jackson Laboratory, 600 Main St, Bar Harbor, ME 04609; e-mail: jeb@jax.org.

![Fig. 2. sphDem/sphDem mice have defective dimer/tetramer complexes. / (A) SDS-PAGE of RBC ghost proteins from +/+ (lanes 1, 6) and mutant (lanes 2, 3, 4, 5) mice. Strain background and genotype of mice are indicated above each lane. Size markers indicated on left; relative positions of α-spectrin (α), ankyrin (ANK), β-spectrin (β), and band 3 (b3) indicated on right. Ratios of α, ANK, and β to b3 are listed in Table 3. (B) Immunoblot of RBC ghost proteins from +/+ (lanes 1, 6) and mutant (lanes 2, 3, 4, 5) mice. Strain background and genotype of mice are indicated above each lane. Primary antibody detects α- and β-spectrin equally. Size markers indicated on left; relative positions of α- and β-spectrin indicated on right. Arrow on right marks position of the 65-kd immunoreactive protein insphDem/sphDem mice (lane 2). (C) Representative native PAGE of 0°C low ionic strength spectrin extracts from RBC ghosts of +/+ (lane 1) and mutant (lanes 2, 3) mice stained with Coomassie Blue. Genotype of mice is indicated above each lane. Positions of spectrin dimers [D] and tetramers [T] are indicated on right. Densitometric values (in pixels): +/+[D] = 60;+/+[T] = 425; +/+[D]:[T] ratio = 0.14:1;sphJ/sphJ[D] = 11;sphJ/sphJ[T] = 109;sphJ/sphJ[D]:[T] ratio = 0.10:1. (D) SDS-PAGE of RBC ghost (lanes 1, 3, 5) and spectrin extract (lanes 2, 4, 6) proteins from +/+ (lanes 1, 2) and mutant (lanes 3-6) mice. Genotype of mice is indicated above each pair of lanes. Size markers indicated on left; positions of α- and β-spectrin indicated on right. (E) Immunoblot of RBC ghost (lanes 1, 3, 5) and spectrin extract (lanes 2, 4, 6) proteins from +/+ (lanes 1, 2) and mutant (lanes 3-6) mice. Genotype of mice is indicated above each pair of lanes. Primary antibody detects α-spectrin more efficiently than β-spectrin. Size markers indicated on left; positions of α- and β-spectrin indicated on right. Arrow on right marks 65-kd immunoreactive protein insphDem/sphDem mice (lanes 3, 4).](https://ash.silverchair-cdn.com/ash/content_public/journal/blood/97/2/10.1182_blood.v97.2.543/5/m_h80210573002.jpeg?Expires=1769119264&Signature=Rfi13ynmEU-G~uAaar34ECesJnkxbd0PYWmR6curRbjQAgmywqGbZv4cU9s47cV07GlKlH6ecg945SkCz6fiAuh5sHI-G8Cb4LqEn6thE1EoCkKE75yWzzrGXaWK9BY2bRUaIrzi3TA8Pg~z5dMzgJwLQVUv8XTOFephrdVyNPzccAGgTo43tWRBslRd1URltQVUxT4wC6Zek4QoulHoCpHDW7xocnwJKh2d9qfZT2UI2DbQnfrYJy2I-isrc4uJD1V1WYtg5TvVyT7vpoMTNUpsP~wDu~8YSMoxcV~yGgaH6wMdVcz-UklC1iRZ0sQ9jb15l1oclGHy18ocsLIGLw__&Key-Pair-Id=APKAIE5G5CRDK6RD3PGA)

![Fig. 2. sphDem/sphDem mice have defective dimer/tetramer complexes. / (A) SDS-PAGE of RBC ghost proteins from +/+ (lanes 1, 6) and mutant (lanes 2, 3, 4, 5) mice. Strain background and genotype of mice are indicated above each lane. Size markers indicated on left; relative positions of α-spectrin (α), ankyrin (ANK), β-spectrin (β), and band 3 (b3) indicated on right. Ratios of α, ANK, and β to b3 are listed in Table 3. (B) Immunoblot of RBC ghost proteins from +/+ (lanes 1, 6) and mutant (lanes 2, 3, 4, 5) mice. Strain background and genotype of mice are indicated above each lane. Primary antibody detects α- and β-spectrin equally. Size markers indicated on left; relative positions of α- and β-spectrin indicated on right. Arrow on right marks position of the 65-kd immunoreactive protein insphDem/sphDem mice (lane 2). (C) Representative native PAGE of 0°C low ionic strength spectrin extracts from RBC ghosts of +/+ (lane 1) and mutant (lanes 2, 3) mice stained with Coomassie Blue. Genotype of mice is indicated above each lane. Positions of spectrin dimers [D] and tetramers [T] are indicated on right. Densitometric values (in pixels): +/+[D] = 60;+/+[T] = 425; +/+[D]:[T] ratio = 0.14:1;sphJ/sphJ[D] = 11;sphJ/sphJ[T] = 109;sphJ/sphJ[D]:[T] ratio = 0.10:1. (D) SDS-PAGE of RBC ghost (lanes 1, 3, 5) and spectrin extract (lanes 2, 4, 6) proteins from +/+ (lanes 1, 2) and mutant (lanes 3-6) mice. Genotype of mice is indicated above each pair of lanes. Size markers indicated on left; positions of α- and β-spectrin indicated on right. (E) Immunoblot of RBC ghost (lanes 1, 3, 5) and spectrin extract (lanes 2, 4, 6) proteins from +/+ (lanes 1, 2) and mutant (lanes 3-6) mice. Genotype of mice is indicated above each pair of lanes. Primary antibody detects α-spectrin more efficiently than β-spectrin. Size markers indicated on left; positions of α- and β-spectrin indicated on right. Arrow on right marks 65-kd immunoreactive protein insphDem/sphDem mice (lanes 3, 4).](https://ash.silverchair-cdn.com/ash/content_public/journal/blood/97/2/10.1182_blood.v97.2.543/5/m_h80210573002.jpeg?Expires=1769119265&Signature=ojAcD5o9yUITjWck1Wj7Yf094iPP7d8At0vp20OzLUgtOMPUnDI1i24Xrp7FhwAprhuuMiddAi6Mha~MUKPQkytAYojUJnHxc9x-3~kDLCFXye6blLkIgGvehhmCUmFuAJDE~uGhxe1NHA8i-bLcI48g3OJFGPuqA9Wm5V~ona3ltMGqIraqIh6LGyUwYAmQLsOdWf9FLWiVQBX6H5xeXsuP4dftqNbv-9sBKqj9jdl70pZjXVqosHWFmSMGEuxkjvFeDgs0vt89EmkRws8wXcV225~wB9zONt7OEnD8J2FnDr3jXYOjU~IfB5B-irlM26r0T1iicPcftizO6OY3Lg__&Key-Pair-Id=APKAIE5G5CRDK6RD3PGA)

