Abstract
Bone marrow hematogones (B-lymphocyte precursors) may cause problems in diagnosis because of their morphologic and immunophenotypic similarities to neoplastic lymphoblasts. The purposes of this prospective, multiparametric flow cytometry study were to quantify hematogones across age groups and a spectrum of clinical conditions, to identify factors that affect the relative quantity of hematogones, and to compare their immunophenotype with that of neoplastic lymphoblasts. A total of 662 consecutive marrow specimens were analyzed for hematogones using one of two 4-color antibody combinations; hematogones were identified in 528 (79.8%). There was a significant decline in hematogones with increasing age (P < .001), but a broad range was found at all ages and many adults had a relatively high number. Specimens processed by density gradient had a higher mean percent hematogones than those processed by erythrocyte lysis (P < .001). There was a direct decline in hematogones with increasing marrow involvement with neoplastic cells. A total of 8% of the 662 specimens contained 5% or more hematogones: 24.6% of specimens from patients aged less than 16 years and 6.3% from those 16 and older (P < .000 01). Increased hematogones were observed most often in patients with lymphoma, marrow regenerative states, immune cytopenias, and acquired immunodeficiency syndrome. Hematogones always exhibited a typical complex spectrum of antigen expression that defines the normal antigenic evolution of B-cell precursors and lacked aberrant expression. In contrast, lymphoblasts in 49 cases of precursor B-ALL showed maturation arrest and exhibited 1 to 11 immunophenotypic aberrancies. Four-color flow cytometry with optimal combinations of antibodies consistently distinguishes between hematogones and neoplastic lymphoblasts.
Introduction
Hematogones (B-lymphocyte precursors), originally recognized by their morphologic features in bone marrow smears,1,2 are found in small numbers in most marrow specimens analyzed by flow cytometry. They are reported to occur in large numbers in some healthy infants and young children and in a variety of diseases in both children and adults.3-10Hematogones may be particularly prominent in the regeneration phase following chemotherapy or bone marrow transplantation and in patients with autoimmune and congenital cytopenias, neoplasms, and acquired immunodeficiency syndrome (AIDS).3,7,11-24 In some instances they constitute 5% to more than 50% of cells.3,5,8,25 26
Increased numbers of hematogones may cause problems in diagnosis because of the morphologic features they commonly share with the neoplastic lymphoblasts of acute lymphoblastic leukemia (ALL) and lymphoblastic lymphoma.3 Their immunophenotype also has features in common with neoplastic B-cell precursor lymphoblasts.5 Single- and 2-color flow cytometry do not reliably differentiate hematogones from leukemic lymphoblasts.4,5,8,17,27-30 However, appropriately applied, 3- and 4-color multiparametric flow cytometry are reported to distinguish between these cell populations in nearly all instances.10 31-33
While several studies on small populations of patients have demonstrated increased numbers of bone marrow hematogones in young children relative to other age groups, no comprehensive prospective study of a large population across all ages has been published. The reports of increased hematogones in specific diseases are mostly retrospective studies based on relatively small patient cohorts, lacking broad control populations.3-5,9,13 Furthermore, in most flow cytometry studies hematogones have been reported as the percent of total lymphocytes or of B lymphocytes8,17,26,34-36 and in only a few reports as a percent of total events.9,10 37 Finally, prior studies have not addressed the effects of the specimen-processing method and marrow involvement with neoplastic cells on the percentage of hematogones.
In this prospective study, 4-color flow cytometry was used to quantify hematogones as a percentage of total events in 662 consecutive marrow specimens across all age groups and a spectrum of clinical conditions. The percent hematogones was compared for density gradient and lysis cell processing methods. The immunophenotype of hematogones was determined using one of two 4-color combinations of antibodies and compared with that of neoplastic lymphoblasts.
Patients, materials, and methods
Patients and specimens
A prospective 4-color flow cytometry analysis of hematogones was performed during an 8-month period at the University of Texas Southwestern Medical Center Flow Cytometry Laboratory. During this period, 706 marrow specimens were submitted; 44 of these could not be assessed for hematogones for a variety of technical reasons, including lack of adequate numbers of viable cells in the sample, omission of appropriate antibody combinations to assess hematogones, or because they were obscured by a predominant population of neoplastic lymphoblasts. The remaining 662 specimens formed the cohort for this study. Clinical information was obtained from patient demographics, submitted clinical diagnoses, and interpretation of the flow cytometry results. Patients were separated by gender and age group of younger than 2 years, 2 to 5 years, 6 to 15, 16 to 50, and 50 years and older. A total of 53 specimens from 49 patients with newly diagnosed or residual/relapsed precursor B-ALL were analyzed during the time frame of the study; 28 of these were assessable for hematogones and are included in the 662 specimens. The other 25 ALL specimens could not be assessed for hematogones for reasons detailed above and were excluded from further analysis of hematogones. However, the immunophenotypes of the lymphoblasts in these 25 cases along with those of the other 28 ALL specimens were compared with the immunophenotype of hematogones.
Flow cytometry methods
Cell isolation and staining procedures.
Prior to staining, samples were processed using either density gradient separation (345 specimens) or erythrocyte lysis (317 specimens). In the density gradient separation technique, the specimen was diluted 1:5 in phosphate-buffered saline (PBS) and then underlaid with 10 mL Histopaque-1077 (Sigma, St Louis, MO) with subsequent centrifugation for 25 minutes at 1200 rpm. In the lysis technique, erythrocytes were lysed using a standard ammonium chloride lysing solution at a ratio of 1 part sample to 5 parts lysing solution and incubated for 10 minutes or up to 20 minutes if needed for complete lysis.38 Following either technique, the samples were washed twice with a PBS, 0.0455% sodium azide, 0.1% bovine serum albumin solution (PAB), and resuspended in 5% newborn calf serum in RPMI 1640 culture medium. In a few cases processed by density gradient separation, a red cell button was noted during the washing step, indicating inadequate erythrocyte clearance. For these samples a lysis step, as described above, was also performed. Cell counts were performed, and 500 000 cells were washed with PAB and stained with a 4-color combination of antibodies.
Antibodies.
Antibodies to the following antigens were used to specifically profile B-cell precursors: CD10 (W8E7) fluorescein isothiocyanate (FITC), CD19 (SJ25C1) phycoerythrin (PE), CD20 (L27) peridinin chlorophyll protein (PerCP), CD22 (S-HCL-1) PE, CD34 (8G12) allophycocyanin (APC), and CD38 (HB7) APC (Becton Dickinson, San Jose, CA). One of two 4-color combinations was used in each case. One consisted of CD10, CD20, CD22, and CD34 and the other CD10, CD20, CD19, and CD38. Additional antibodies were used to characterize the lymphoblasts in cases of ALL. These included CD1a (HI149) PE, CD3 (SK7) PerCP, CD4 (SK3) APC, CD5 (L17F12) PE, CD7 (4H9) FITC, CD8 (SK1) FITC, CD11b (D12) APC, CD13 (L138) PE, CD14 (MØpq) PE, CD15 (MMA) FITC, CD33 (P67.6) PE, CD45 (2DI) PerCP, CD61 (RUU-PL7F12) FITC, HLA-DR (L243) PerCP (Becton Dickinson), CD36 (CB38) FITC (Coulter-Immunotech, Hialeh, FL), CD64 (10) PE (Ancell, Bayport, MN), myeloperoxidase (MPO-7) FITC (Dako, Glostrup, Denmark), and terminal deoxynucleotidyl transferase (TdT) FITC (Supertech, Bethesda, MD). In 38 specimens from 34 patients with ALL, all or most of the antigens listed above were assessed, but in 15 cases a limited panel of antibodies was used. In 13 cases the analysis consisted of only two 4-antibody tubes: CD45, CD3, CD5, and CD7 and CD33, CD10, HLA-DR, and CD19. In one case the study included the above plus CD20, and in another only CD10, CD5, CD34, and CD19 were assessed. A portion of every specimen was stained with isotype-matched fluorescent control monoclonal antibodies.
The amount of antibody added was determined by the manufacturer's recommendations, with titration used when needed. Specimens were incubated at 2°C to 8°C in the dark for 20 minutes. They were then washed with PAB and resuspended in 1% paraformaldehyde in PBS. Data were acquired using a FACSCalibur flow cytometer (Becton Dickinson) with CellQuest software (Becton Dickinson). Data analysis was performed using Paint-a-Gate software (Becton Dickinson).
Flow cytometry interpretation.
Distinct cell populations (clusters) were identified based on any combination of forward and orthogonal light scatter properties and fluorescence intensity with various antibody combinations. Each specimen's event clusters were considered positive or negative compared with the degree of fluorescence of the same specimen stained with the isotypic control antibody, with distinct population shifts interpreted as a positive result. Percentages of cell types were determined based on total events. Immunophenotypic abnormalities within leukemic blast populations were determined on the basis of deviation from normal patterns of B-lymphoid development.37
Statistical analysis
Associations of percentage of bone marrow hematogones with age, sex, method of specimen processing, and degree of marrow involvement by neoplastic cells were analyzed using the Spearman rank correlation coefficient. The categorical variables were analyzed with 2-tailed χ2 tests. Continuous variables were analyzed with independent-sample t tests. A P value of less than .05 was considered statistically significant.
Results
Patients and specimens
A total of 662 consecutive bone marrow specimens from 598 patients (312 males and 286 females) were analyzed for hematogones using one of two 4-color antibody combinations (see “Patients, materials, and methods”). A total of 551 patients (90.3%) had 1 and 47 (9.7%) had 2 to 5 bone marrow analyses; 54.2% of the specimens were from males, 45.8% from females. Ages ranged from 2 months to 92 years (mean 51 years, median 56 years).
Eleven specimens were from patients aged less than 2 years, 18 from patients aged 2 to 5 years, 32 from 6- to 15-year-olds, 231 from 16- to 50-year-olds, and 370 from patients older than 50. In most cases the marrow was obtained to assess for neoplastic disease in patients with known or suspected leukemia or lymphoma and, in a few cases, for evaluation of blood cytopenias or assessment of a nonhematopoietic neoplasm or infectious disease.
Morphologic features
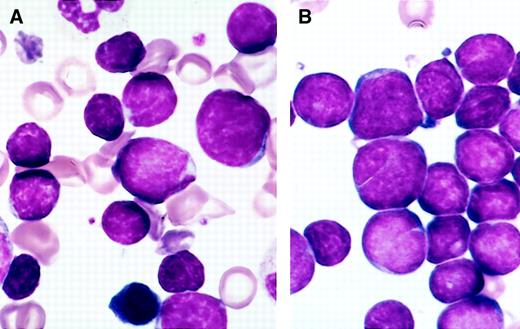
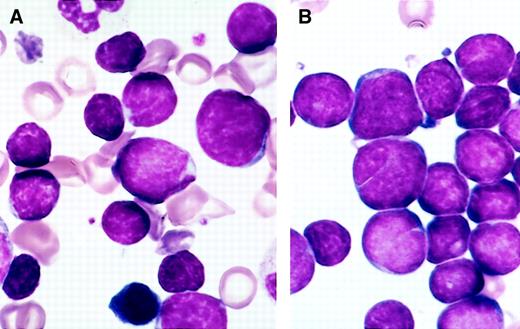
The specimens submitted for flow cytometry were not systematically studied for morphology, but in most instances Wright Giemsa–stained marrow smears were available; hematogones were frequently present in sufficient number to be recognized. They varied from 10 to 20 μ in diameter, with smaller cells predominating. The nucleus was round or oval and sometimes exhibited one or more indentations or shallow clefts. The nuclear chromatin was condensed but homogeneous. Nucleoli were absent or small and indistinct. There was scant or no discernible cytoplasm; when present, cytoplasm was moderately to deeply basophilic and devoid of inclusions, granules, or vacuoles. There was often a spectrum of size and cytologic features that blended with those of mature lymphocytes. In many instances a portion of the hematogones exhibited features indistinguishable from lymphoblasts of ALL (Figure 1).
Comparison of the morphology of hematogones and neoplastic lymphoblasts in bone marrow smears.
(A) Several hematogones are illustrated in this bone marrow smear from a 3-year-old boy with immune thrombocytopenia. They bear close resemblance to the neoplastic lymphoblasts illustrated in panel B. (B) Numerous lymphoblasts are present in this bone marrow smear from a 5-year-old girl with precursor B-ALL.
Immunophenotypic features
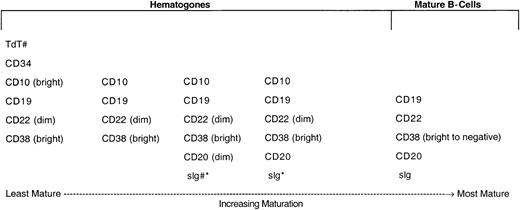
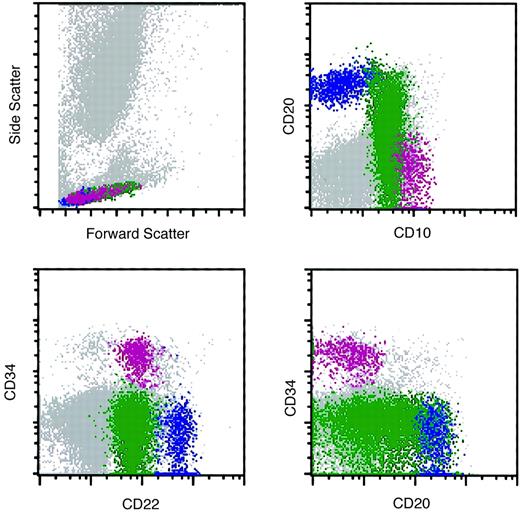
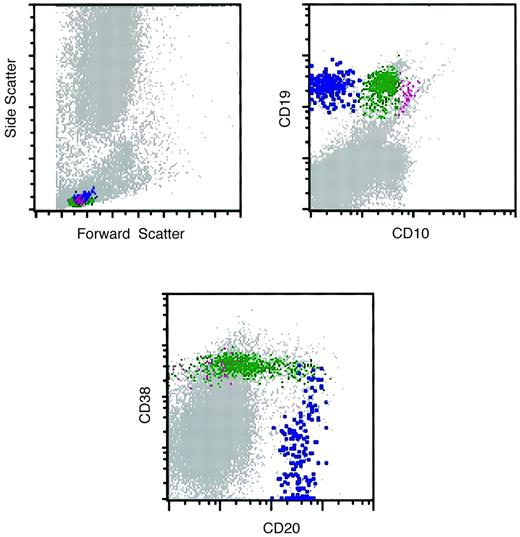
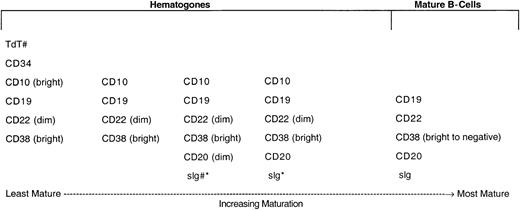
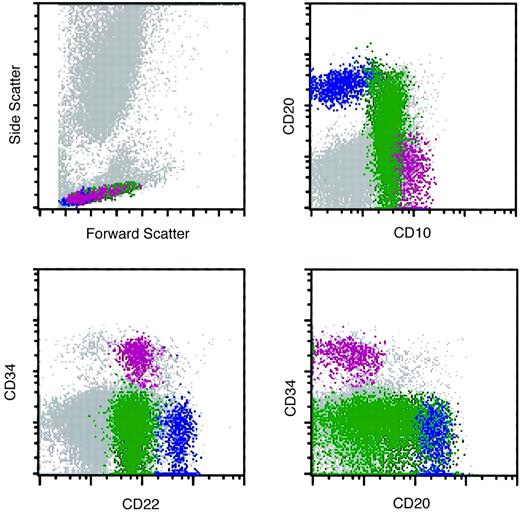
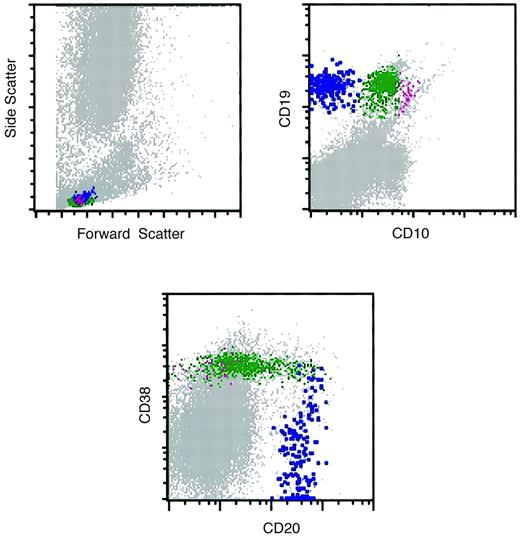
In 528 (79.8%) of the 662 bone marrow specimens, hematogones were identified by flow cytometry. In all instances the hematogone population exhibited a typical complex spectrum of antigens that defines the normal evolution of B-lineage precursors (Figure2). The pattern of sequence and intensity of antigen expression was virtually identical in all cases. Examples of the maturation spectrum are illustrated in Figures3 and 4. The earliest recognizable B-lineage precursors expressed the progenitor cell marker CD34 in combination with CD38, CD19, high levels (bright) of CD10, and low levels of CD22 and lacking CD20. These progressed to the next stages by down-regulating CD34 completely and CD10 partially, prior to progressive up-regulation of CD20. CD22 levels also increased slightly as CD20 was up-regulated. Finally, CD10 was down-regulated completely, CD38 partially, and CD22 upgraded to high intensity. The last stage, in which CD10 is completely down-regulated, is considered a mature stage of B-cell development; cells with this immunophenotype were not included in calculating the percent hematogones. Although not specifically assessed in this study, TdT expression parallels CD34 in the B-cell maturation sequence. The stage of appearance of surface immunoglobulin (sIg) was not assessed; however, in our experience sIg is variable among individual cells in each case, occurring from shortly before to shortly after acquisition of a high level of CD20 expression. Asynchronous expression of the earliest and latest antigens, eg, concurrent CD34 and CD20, and aberrant over- or under-expression of antigens was not observed in hematogone populations.
Normal maturational sequence of bone marrow B-cell precursors (hematogones).
# TdT and sig were not used for assessment of hematogones in this study. They are included in the figure to more completely illustrate the normal stage of B-cell maturation. * The appearance of sig is variable among individual cells in different cases, occurring from shortly before to shortly after acquisition of a high level of CD20 expression.
Flow cytometry histograms of a marrow specimen with increased hematogones.
The histograms illustrate the normal pattern of maturation of B-lymphocyte precursors (hematogones) with the 4-color antibody combination of CD10, CD20, CD22, and CD34. Violet indicates early-stage hematogones; green, intermediate and late-stage hematogones; and blue, mature B cells.
Flow cytometry histograms of a marrow specimen with increased hematogones.
The histograms illustrate the normal pattern of maturation of B-lymphocyte precursors (hematogones) with the 4-color antibody combination of CD10, CD20, CD19, and CD38. The CD10-CD20 histogram was similar to the one illustrated in Figure 3. Violet indicates early-stage hematogones; green, intermediate and late-stage hematogones; blue, mature B cells.
Relationship of hematogones to age, sex, and method of specimen processing
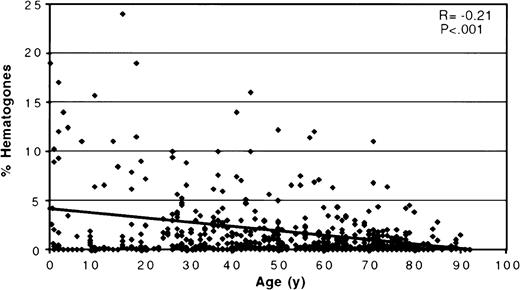
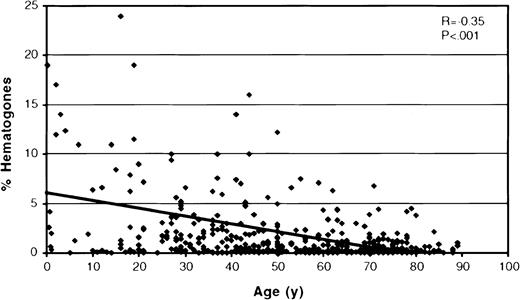
The scatter plot in Figure 5shows the percentage of hematogones related to patient age for all 662 bone marrow specimens. The mean percent hematogones of total marrow events was 1.62 (SD = 4.21, median = 0.3%, range = 0%-65%); there was no significant difference between males (mean = 1.64; SD = 3.35) and females (mean = 1.60; SD = 5.08) (P = .91). Hematogones were found in highest numbers in marrow from infants and young children, with a statistically significant decrease in their percentage with increasing age as shown by the regression line in Figure 4 (r = 0.21;P < .001). However, a broad range was found at all ages, and many adults, even at advanced age, had a relatively high number of hematogones. There was a significantly higher mean percent hematogones (P < .001) in the 345 specimens processed by density gradient separation (mean = 2.17%, SD = 5.46, median = 0.50%) than in the 317 processed by ammonium chloride lysis (mean = 1.02%, SD = 1.97, median = 0.24%), but the same statistically significant age-related decline was observed in both groups. The mean percent marrow hematogones for each of the 5 age groups is shown in Table1. The differences in mean percent hematogones between the 2 processing methods were significant for the 2 oldest age groupings, which contained most patients. There were no differences in the patient cohorts comprising the 2 specimen-processing groups in age (P = .76), sex (P = .33), or level of bone marrow infiltration by neoplastic cells (P = .82).
A scatter plot relating percent bone marrow hematogones to patient age for all 662 specimens.
There is a significant decease in the percent hematogones with increasing age as shown by the regression line. (Two cases were off the scale of the scattergram and are not shown: a 5-month-old with 51% hematogones and a 23-year-old with 65%.)
Relationship of hematogones to marrow involvement with neoplastic cells
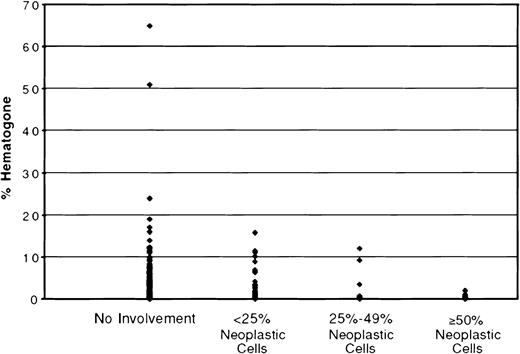
Neoplastic cells were identified by flow cytometry in 230 (34.7%) of the 662 specimens. The neoplasms were mostly acute or chronic leukemias and various types of lymphomas. The degree of marrow involvement varied from more than 90% neoplastic cells to less than 1%. To study the effect of marrow involvement on the hematogone compartment, specimens were separated into 4 categories: no involvement by neoplastic cells (432 specimens), fewer than 25% neoplastic cells (114 specimens), 25% to 49% (42 specimens), and 50% or more (74 specimens). The mean percent hematogones, SD, and range for these 4 categories are shown in Table 2. Figure6 depicts the distribution of hematogones by percent of total marrow events for the 4 categories. There was a significant difference in mean percent hematogones between specimens without involvement by neoplastic cells (mean = 1.99%) and those with 50% or more (mean = 0.14%), P < .001, and between specimens with less than 25% involvement (mean = 1.53%) and those with 50% or more, P < .001. These same differences persisted when the 4 categories were divided into density gradient separation– and ammonium chloride lysis–processed groups (Table 2). The 74 specimens with 50% or more neoplastic cells had a mean percent hematogones of only 0.14; in 50 (67.6%) of the 74 none were identified. When these 74 extensively replaced specimens were excluded from analysis there was a more direct and significant relationship of percent marrow hematogones to age group and method of processing than when all specimens were included (Table 1).
The distribution of hematogones by percent of total marrow events for 4 categories of bone marrow involvement by neoplastic cells.
There is a significant difference in mean percent hematogones between specimens without involvement by neoplastic cells (mean = 1.99%) and those with more than 50% (mean = 0.14%) and, also, between specimens with less than 25% involvement (mean = 1.53%) and those with more than 50%, P < .001.
The mean percent hematogones for the 432 specimens uninvolved by neoplastic cells (1.99%) was higher than when all specimens were considered (1.62%). These 432 specimens may most closely represent a reference population for bone marrow hematogones (Figure 7).
A scatter plot showing the percent of bone marrow hematogones related to patient age for the 432 specimens uninvolved by neoplastic cells.
There is the same significant decrease in the percent hematogones with increasing age as for the full cohort of 662 specimens, but the mean percent hematogones (1.99%) is higher than when all specimens are included (1.62%) (Figure 5). These 432 specimens most closely represent a reference population for bone marrow hematogones. (Two cases with 51% and 65% hematogones were off the scale of the scattergram and are not shown.)
Specimens with 5% or more hematogones
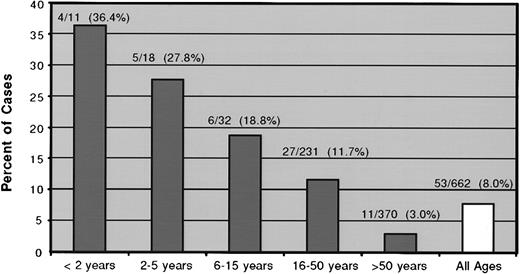
Hematogones constituted 5% or more of the total marrow events in 53 (8.0%) of the 662 specimens from 51 (8.5%) of 598 patients; 23 specimens (3.5%) contained 10% or more, and 3 of these had more than 20%. The 51 patients ranged in age from 2 months to 74 years (median 30 years). Figure 8 plots the percent of specimens with 5% or more hematogones by patient age group. There was an incremental decline in the proportion of patients with 5% or more hematogones with increasing age. The difference was significant between the combined groups of patients aged less than 16 years and those 16 and older (24.6% vs 6.3%) (P < .000 01). Nine of the patients had multiple bone marrow flow cytometry analyses during the time frame of the study. Two patients exhibited more than 5% hematogones on each of 2 occasions separated by 3 weeks; 7 had more than 5% once and less than 5% on 1 to 4 other analyses separated by 14 days to 5.5 months. The findings in these 9 cases are detailed in Table 3.
The percent of specimens with 5% or more hematogones by patient age group.
For this analysis the density gradient separation– and ammonium chloride lysis–processed specimens were combined. There is a direct decline in the proportion of patients with more than 5% marrow hematogones with increasing age. The difference between the combined groups of patients aged less than 16 years with 5% or more hematogones (24.6%) and those 16 and older (6.3%) was significant (P < .000 01).
Thirty-seven (10.7%) of 345 marrow specimens processed by density gradient separation contained 5% or more hematogones, compared with only 16 (5%) of 317 processed by ammonium chloride lysis (P = .01). Forty-two of the 53 specimens with 5% or more hematogones were uninvolved by a neoplasm; 9 contained fewer than 25% neoplastic cells; 2 had 25% to 49%; and none had 50% or more.
Conditions associated with increased hematogones
The clinical conditions in which there were 5% of more hematogones are listed in Table 4; lymphomas, various nonneoplastic blood cytopenias, post-chemotherapy, post–bone marrow transplantation, and AIDS were the most common. The degree of association of these conditions with increased hematogones could not be determined because clinical information on many of the 598 patients was insufficient to perform an accurate statistical analysis.
Distinction of hematogones from lymphoblasts of precursor B-ALL
Fifty-three bone marrow specimens from 49 patients were positive for precursor B-ALL during the time frame of the study: 46 of the patients had a single positive specimen; 2 had 2 positive specimens; and 1 had 3. Twenty-eight of the 53 ALLs were assessable for hematogones and are included in the 662 specimens. In most of these, hematogones were not identified or were present in minute numbers. The 25 ALL specimens that were not assessed for hematogones, for reasons detailed in “Patients, materials, and methods,” were included with the other 28 ALLs to compare the immunophenotypes of lymphoblasts and hematogones.
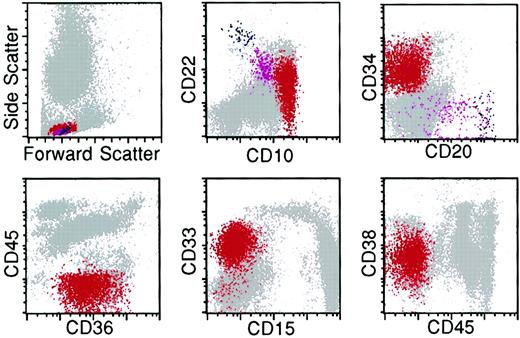
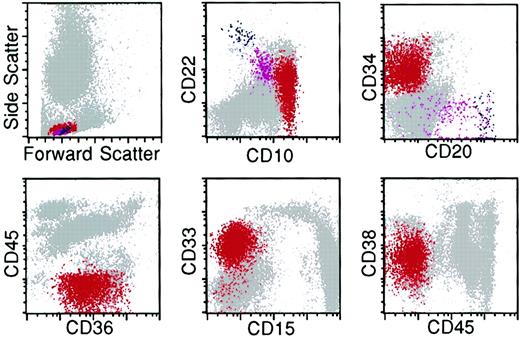
The lymphoblasts in all 49 patients with ALL exhibited incomplete maturation and immunophenotypic asynchrony and aberrancy that deviated from the normal, continuous, and complete B-lineage maturation spectrum observed for hematogones. In addition, neoplastic lymphoblasts commonly expressed myeloid antigens. The lymphoblasts from the 34 cases studied with complete panels of antibodies exhibited 4 to 11 aberrancies (Figure 9); the 15 cases in which limited panels were used (see “Patients, materials, and methods”) expressed 1 to 4. Without exception the lymphoblasts in ALL could be distinguished from hematogones even when only a small population of neoplastic cells was present. Aberrant antigen expression in the 49 cases of ALL is detailed in Table 5.
Flow cytometry histograms of bone marrow from a patient with relapse of precursor B-ALL illustrating multiple antigenic aberrancies.
The lymphoblasts (red) exhibit an abnormal spectrum of expression of CD22 and overexpression of CD10 relative to the normal hematogone population (violet). They are uniformly CD34-positive and -negative for CD20 and CD45. The lymphoblasts express the myeloid-associated antigens CD36 and CD33 and underexpress CD38. Red indicates neoplastic lymphoblasts; violet, hematogones; and blue, mature B lymphocytes.
Discussion
In this prospective 4-color flow cytometry study we found a significant decline in bone marrow hematogones with increasing age. Most of the specimens were obtained from persons under evaluation for neoplastic diseases or hematologic abnormalities and, therefore, the subjects would not be considered healthy individuals; the values for hematogones in the various age groups should not necessarily be considered “normal values.” Because bone marrow examinations are seldom performed on entirely healthy people, establishing a normal range from adequate numbers of individuals throughout the age spectrum is problematic. Population cohorts in most other reports on the distribution of hematogones have also involved patients with various neoplastic, hematologic, autoimmune, and infectious diseases. Furthermore, most prior studies on the subject have been on relatively small patient cohorts that were limited or selective in patient demographics and disease states. Three studies of relatively small numbers of patients without hematologic or neoplastic disorders have examined bone marrow lymphocyte subsets.8,10,34 The findings in these studies support our observations on age distribution of hematogones. Caldwell and associates in a study of 45 healthy children and adults found that the number of marrow B-cell precursors is greater in children than adults and declines with age.8Rego and colleagues analyzed bone marrow lymphocyte subsets from 44 children from 2 weeks to 15 years of age, without hematologic or autoimmune disorders, and compared results with those from 12 hematologically healthy adults.34 There was a significant difference among age groups in quantity of major types of marrow lymphocytes except for natural killer cells. B-lymphocyte precursors decreased in number after age 4; there were no differences between males and females. Lucio and coinvestigators studied 39 normal bone marrow samples and found a shift in B-cell populations from predominantly immature precursors in individuals aged less than 15 years to mostly more mature B-cell immunophenotypes in patients 15 and older.10
In the present study we arbitrarily designated 5% as “increased” hematogones, recognizing that there are no generally accepted reference ranges. However, at levels of 5% or more they are conspicuous on marrow smears and more likely to be confused with neoplastic lymphoblasts. A total of 8% of specimens (8.5% of patients) contained 5% or more hematogones. We observed an incremental decrease in patients with increased hematogones from the youngest age group to the oldest. A significantly higher percentage of patients aged less than 16 years had increased hematogones than patients 16 and older (24.6% vs 6.3%, P < .000 01). It appears that the propensity for increased hematogones stimulated by certain disease states usually diminishes with aging. However, many adult patients, some at an advanced age, had increased hematogones, an observation that has also been made by other investigators.4 9
The number of bone marrow hematogones may fluctuate with disease status or, in some clinical settings, persistent elevations may be observed.12,17,19,35 van Wering and colleagues observed persistent elevations of bone marrow B-cell precursors for 2 years following cessation of chemotherapy for ALL, and Leitenberg and associates found elevations for more than a year following bone marrow transplantation.19 35 Transient elevations in hematogones were observed in most of the few patients with repeat analyses in our study (Table 3). Factors including variation in the cellularity of the bone marrow between specimens and the degree of hemodilution may have impacted these results.
Hematogones are only rarely detected in blood other than in minute numbers, principally in neonates and in cord blood.39,40Hemodilution of the marrow would generally increase the number of blood lymphocytes in the specimen, particularly T lymphocytes, and diminish the relative number of hematogones.34 The effect of hemodilution on the distribution of major lymphocyte subsets has been demonstrated previously.41-43 While we did not investigate the effects of hemodilution in this study, it was probably a factor in many of the cases with absent or minute numbers of hematogones. The overall effect of hemodilution on the mean percent hematogones for each of the 5 age groups was presumably minimized by the large number of cases analyzed.
In our study, increased hematogones were observed most commonly in patients with lymphomas, in marrow regenerative states following chemotherapy or bone marrow transplantation, in various immune and other blood cytopenias, and in patients with AIDS (Table 4). However, the study population was skewed toward patients with these conditions. We were unable to determine if there was a statistically significant relationship between any of these conditions and increased hematogones because clinical information was insufficient in many of the 598 patients to allow an accurate analysis. However, our observations regarding the association of these disorders with increased hematogones are similar to those of several other studies.3-5,9,13-15,17,18 The biological significance of increased marrow hematogones in these conditions is presently unclear, but our findings and those of other investigators suggest that B lymphocytogenesis is stimulated in some diseases and as a phenomenon of marrow regeneration.9 19
The method of specimen processing and marrow involvement by neoplastic cells impacted the relative size of the hematogone compartment. Specimens processed by density gradient separation had a significantly higher percentage of hematogones than those processed by ammonium chloride lysis. The mean and median were approximately twice as high and the percentage of cases with 5% or more hematogones was more than double that of the ammonium chloride lysis group: 10.7% of specimens versus 5.0%. There were no differences between the patient cohorts in the 2 specimen-processing groups in age or level of bone marrow infiltration by neoplastic cells to account for these differences. The higher percentage of hematogones in the group processed by density gradient separation was presumably related to the removal of mature neutrophils, which would have the effect of increasing the relative number of hematogones. There was a decline in mean percent hematogones with increasing marrow involvement by neoplastic cells (Table 2). The reason for the decline is uncertain but may relate to encroachment on the hematogone compartment by the neoplastic infiltrate, although other factors that inhibit B lymphocytogenesis may play a role. When the 432 specimens uninvolved by neoplastic cells were analyzed separately, the mean percentage of hematogones was higher than when all specimens were included (1.99% vs 1.62%); the former group may most closely approximate a “normal” reference population.
In some clinical settings increased marrow hematogones may cause diagnostic confusion because of their similarities to neoplastic lymphoblasts. This is particularly true following treatment for ALL because hematogones are often expanded in regenerating marrow and can potentially be mistaken for residual disease.8,19 24 In the present study hematogone populations always expressed a continuous and complete maturation spectrum by 4-color flow cytometry using either of two 4-antibody combinations. Furthermore, they lacked aberrant or asynchronous antigen expression. In contrast, neoplastic lymphoblasts in all 49 patients with precursor B-ALL deviated from the normal B-lineage maturation spectrum. They exhibit maturation arrest and over-, under-, and asynchronous expression of antigens observed on normal B-cell precursors and often expressed myeloid-associated antigens.
Other investigators have also reported methods for discriminating between normal B-cell precursors and neoplastic lymphoblasts. Farahat and associates, using quantitative double-labeling flow cytometry, found B-lineage ALL lymphoblasts to express fewer TdT and CD19 and more CD10 molecules than did hematogones.18 Weir and colleagues demonstrated quantitative differences in light scatter and intensity of antigen expression between hematogones and lymphoblasts by 4-color flow cytometry; the lymphoblasts in ALL always formed discrete clusters of events falling outside the normal template for hematogones.32 Rimsza and colleagues found a predominance of more mature B-cell precursors in hematogone-rich specimens relative to the least mature (CD34+, TdT+) cells, which predominated in cases of ALL. In addition the adhesion molecules CD44 and CD54 were expressed more heterogeneously on hematogones than on neoplastic lymphoblasts.26 These investigators also showed by immunohistochemical stains that CD34+ and TdT+ cells were dispersed without clustering on marrow sections in normal settings whereas they were in clusters of more than 5 cells in most ALLs with minimal residual disease.16 26
An increase in the least mature (CD34+, TdT+) and decrease in the more mature (CD20+) B-cell precursors have been reported in the earliest regeneration phases of marrow reconstitution following chemotherapy or a bone marrow transplantation.13,19,24 We have also observed a predominance of markedly left-shifted hematogones in some cases in the early stages following bone marrow transplantation. In this setting there is greater potential for mistaking the least mature hematogones for neoplastic lymphoblasts, but even in these cases a maturational sequence is identified and aberrant antigen expression is not observed. With the exception of patients treated with anti-CD20 antibodies (rituximab), we have not encountered cases in which the spectrum of hematogone maturation was incomplete (unpublished observation, 2000). Our findings and those of others suggest that 3- and 4-color flow cytometry can reliably distinguish hematogones from residual ALL in virtually all cases when optimal antibody combinations are used.10 31-33
The publication costs of this article were defrayed in part by page charge payment. Therefore, and solely to indicate this fact, this article is hereby marked “advertisement” in accordance with 18 U.S.C. section 1734.
References
Author notes
Robert W. McKenna, University of Texas Southwestern Medical Center, Dept of Pathology, 5323 Harry Hines Blvd, Dallas, TX 75390-9072; e-mail: robert.mckenna@utsouthwestern.edu.

