The “conventional” NK1.1− T cells from mouse blood and marrow were compared with regard to surface receptors, cytokine secretion, and function. Most blood NK1.1−CD4+ and CD8+ T cells expressed the naive CD44int/loCD62LhiCD45RBhiT-cell phenotype typical of those in the peripheral lymphoid tissues. In contrast, most marrow NK1.1−CD4+ and CD8+ T cells expressed an unusual CD44hiCD62LhiCD45RBhiphenotype. The blood NK1.1− CD4+ T cells had a naive T-helper cytokine profile and a potent capacity to induce lethal graft versus host (GVH) disease in a C57BL/6 donor to a BALB/c host bone marrow transplantation model. In contrast, the marrow NK1.1− CD4+ T cells had a Th0 cytokine profile and failed to induce lethal GVH disease, even at 20-fold higher numbers than those from the blood. NK1.1− CD8+ T cells from the blood but not the marrow induced lethal GVH disease. Nevertheless, the marrow NK1.1− CD8+ T cells induced potent antitumor activity that was augmented by marrow NK1.1− CD4+ T cells and facilitated hematopoietic progenitor engraftment. The inability of marrow CD4+ and CD8+ T cells to induce GVH disease was associated with their inability to expand in the blood and gut of allogeneic recipients. Because neither the purified marrow CD4+ or CD8+ T cells induced GVH disease, their unique features are desirable for inclusion in allogeneic bone marrow or hematopoietic progenitor transplants.
Introduction
Mature T-cell receptor αβ+(TCRαβ+) T lymphocytes in the bone marrow (BM) are located in an environment that is filled predominantly with hematopoietic cells. This unique juxtaposition of immune T cells and hematopoietic cells may require specialization of the marrow immune cells as compared with those in the lymph nodes, spleen, and blood, because vigorous immune responses including secretion of cytokines have the potential to dysregulate hematopoiesis. T cells make up only 1% to 3% of nucleated cells in the marrow.1,2 The balance of subsets among the marrow T cells is unusual, and NK1.1+TCRαβ+ T cells and CD4−CD8−TCRαβ+ T cells are present at levels that are 10- to 30-fold higher than that in the peripheral lymphoid tissues.2-5 The marrow NK1.1+ TCRαβ+ T cells appear to play a regulatory role and can suppress immune responses such as the induction of graft versus host (GVH) disease1 mediated by combined marrow NK1.1− CD4+ and CD8+TCRαβ+ T cells.2-5 The CD4−CD8−TCRαβ+ marrow T cells inhibit the mixed leukocyte reaction of peripheral T cells.6
Although regulatory NK1.1+ T cells in the marrow can suppress immune responses of NK1.1− T cells, it is unclear whether the NK1.1− CD4+ and CD8+ T cells in the marrow are similar or identical to those in the peripheral lymphoid tissues. A recent study suggested that a high proportion of marrow NK1.1− CD4+ T cells expressed the activated/memory (CD44hiCD62LloCD45RBlo) phenotype as compared with CD4+ T cells in the periphery.7 Our previous study indicated that marrow NK1.1− CD4+ and CD8+ T cells sorted in a single pool expressed a cytokine secretion pattern that differed from that of peripheral T cells, and their capacity to induce GVH disease was reduced as compared with T cells in the blood.5 Furthermore, marrow NK1.1−TCRαβ+ T cells may be derived from an extrathymic T-cell developmental pathway in the BM itself.8,9 Several laboratories have shown that marrow CD8+ T cells are able to mediate vigorous graft versus tumor activity without GVH disease and to facilitate engraftment of hematopoietic progenitor cells in irradiated allogeneic hosts.10-12
In the current report, the surface phenotype, cytokine secretion profile, and function of highly purified NK1.1−CD4+ or NK1.1− CD8+TCRαβ+ T cells in the BM were systematically compared with the same T-cell subsets in the blood. The blood CD4+and CD8+ T cells expressed the dominant naive T-cell surface phenotype (CD44int/loCD62LhiCD45RBhi), and the blood CD4+ T cells had the typical naive T-helper cytokine secretion profile (high interleukin [IL]-2; low interferon [IFN]-γ, IL-4, and IL-10) after activation in vitro. However, most T cells in the marrow expressed an unusual CD44hiCD62LhiCD45RBhi phenotype, and the marrow CD4+ T cells had an unusual cytokine pattern (high IFN-γ, IL-4, and IL-10) that was similar to the Th0 pattern. Functional assays showed that both the purified blood NK1.1− CD4+ and the NK1.1−CD8+ T cells induced lethal GVH disease in the C57BL/6 donor to BALB/c host combination. The former cells were at least 20-fold more potent than the latter. Neither the purified marrow NK1.1− CD4+ nor the NK1.1−CD8+ T cells induced lethal GVH disease even at high cell numbers. Nevertheless, the marrow NK1.1− T cells mediated vigorous graft versus tumor activity and facilitated engraftment of hematopoietic progenitor cells.
Materials and methods
Mice and monitoring of GVH disease
C57BL/6 (H-2b) and BALB/c (H-2d) wild-type mice (CD45.2) were obtained from the breeding facility of the Department of Comparative Medicine, Stanford University. The C57BL/6 Rag2−/− mice and congenic C57BL/6 (CD45.1) mice were obtained from Jackson Laboratory, Bar Harbor, ME. Only male mice were used at 8 to 12 weeks of age. Care of all experimental animals was in accordance with institutional guidelines. In BM transplantation studies, host BALB/c mice were given 8 Gy total body irradiation1 from a 250 kV x-ray source and injected with C57BL/6 donor cells via the tail vein within 24 hours. Survival and appearance of mice were monitored daily, and body weight was measured weekly. Mean body weights of surviving mice in each group were determined at 100 days. Chimerism of hosts before and after 100 days was respectively measured by staining peripheral blood (PB) mononuclear cells from Ficoll-Hypaque gradients or spleen cells with fluorochrome-conjugated anti–H-2b monoclonal antibodies (mAbs) (Pharmingen, San Diego, CA) and analysis by one-color flow cytometry.
BCL1 tumor cell passage and injection
BCL1 is a B-cell leukemia/lymphoma derived from a BALB/c mouse with an IgMλ surface immunoglobulin phenotype.13 This cell line was maintained by serial passage in BALB/c mice as described previously.13 After appropriate dilution, 60 BCL1 cells were coinjected with BM cells into lethally irradiated BALB/c recipients.
Monoclonal antibodies; immunofluorescent staining and flow cytometric analysis
BM cells were obtained from the femur and tibia and stained with mAbs as described previously.2,5 Stainings were performed in the presence of anti-CD16/32 (2.4G2, Pharmingen) at saturation to block FcRII/III receptors, and propidium iodide (Sigma Chemicals, St Louis, MO) was added to staining reagents to exclude dead cells. Three-color FACS analysis was performed using a modified dual laser FACS Vantage (Becton Dickinson, Mountain View, CA), and data were analyzed using FACS/Flow Jo software (Becton Dickinson).14The following conjugated antibodies were used for staining: fluorescein isothiocyanate (FITC)–anti-CD8 (CT-CD8α) and streptavidin–Texas Red purchased from Caltag, South San Francisco, CA; and allophycocyanin- and phycoerythrin (PE)– and FITC–anti-TCRαβ (H57-597), PE–anti-NK1.1 (PK136), FITC–anti-CD4 (RM4-5), FITC–anti-CD44 (IM7), unconjugated anti-CD16/CD32 (2.4G2), FITC–anti-CD45.2 (104), FITC– and PE–anti–H-2Kb (AF6-88.5), PE–anti-B220 (RA3-6B2), PE–anti–Gr-1 (RB6-8C5), PE–anti–MAC-1 (M1/70), FITC–anti-CD62L (MEL-14), and FITC–anti-CD45RB (16A) purchased from Pharmingen. APC–anti-CD4 and APC–anti-CD8a were gifts from Dr Irving Weissman's laboratory at Stanford. FITC–anti–BCL1-Id (6A5.1) mAb was obtained from hybridoma supernatants and conjugated as described previously.12
Sorting of blood and BM T cells
The CD4+, CD8+, and CD4+/CD8+TCRαβ+(NK1.1+ or NK1.1−) T cells from the blood or marrow were obtained by flow cytometry using FACStar or FACS Vantage (Becton Dickinson) after enrichment of blood and marrow T cells on immunomagnetic bead columns (Miltenyi, Auburn, CA) as described previously.2,5 The stringently T-cell–depleted (TCD) marrow cells (CD4−CD8−α/β−) were also obtained by flow cytometry as described previously.5
Liver and gut lymphocyte preparation
After hosts were exsanguinated, livers were flushed with heparinized phosphate-buffered saline in the right ventricle until the liver became pale. Livers were pressed through a nylon mesh to prepare single-cell suspensions in 2 μM ethylenediaminetetraacetic acid in phosphate-buffered saline. The cell suspension was centrifuged on Ficoll-Hypaque, and the interface layer was collected for lymphocyte staining. Gut, including duodenum through rectum, was collected, cut longitudinally, and rinsed thoroughly with cold RPMI 1640. The rinsed gut was put into ethylenediaminetetraacetic acid in phosphate-buffered saline, minced into smaller than 5 mm segments, and suspended by vortex 20 to 30 seconds. After 3 repeats, cells in the supernatant were filtered through a nylon mesh before separation on a Ficoll-Hypaque gradient for collection of mononuclear cells.
In vitro secretion and measurement of cytokines
Sorted T cells (1 × 10⁵) from the blood or BM were stimulated in vitro with 20 ng/mL phorbol myristate acetate (Sigma Chemicals) and 1μM ionomycin (Calbiochem, San Diego, CA) in 10% fetal bovine serum and RPMI complete medium in 96-well round bottom plates and harvested at the peak time point (48 hours) as described previously.2,5,15 Supernatants were assayed for the secretion of IL-2, IFN-γ, IL-4, and IL-10 using commercial enzyme-linked immunosorbent assay kits (Biosource, Camarillo, CA).2,5 15
Histopathology of skin and large intestine
Histopathologic specimens from the skin and large intestines of hosts were obtained at 40 to 60 days or 100 days after transplantation and fixed in formalin before embedding in paraffin blocks. Tissue sections were stained with hematoxylin and eosin and examined at 400× magnification.
Statistical analysis
Differences in survival of groups of hosts given BM transplants were analyzed using the log-rank test. Differences in donor-type T-cell recovery in tissues of hosts were analyzed using the 2-tail Student t test.
Results
Different patterns of surface receptor expression on CD4+ and CD8+ T cells from blood and BM
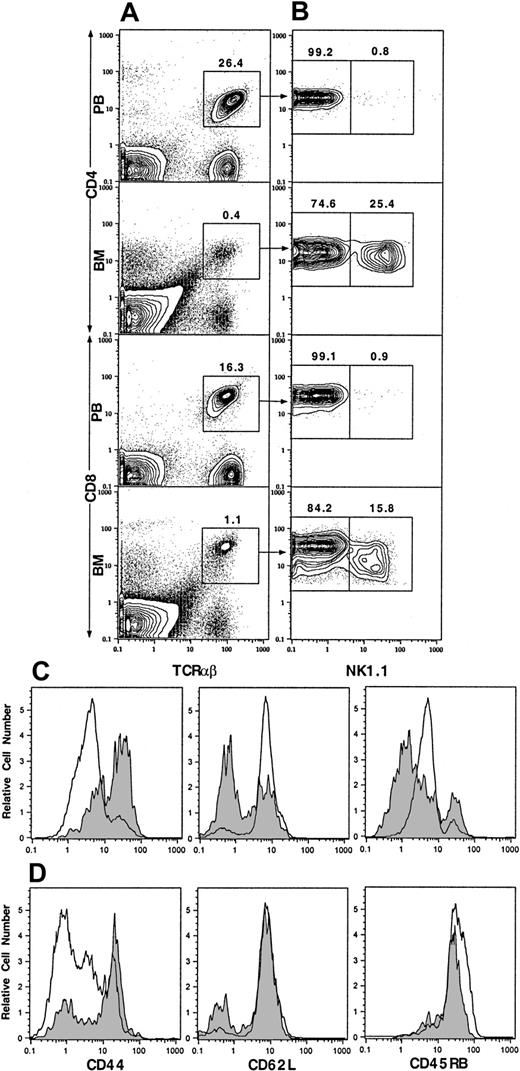
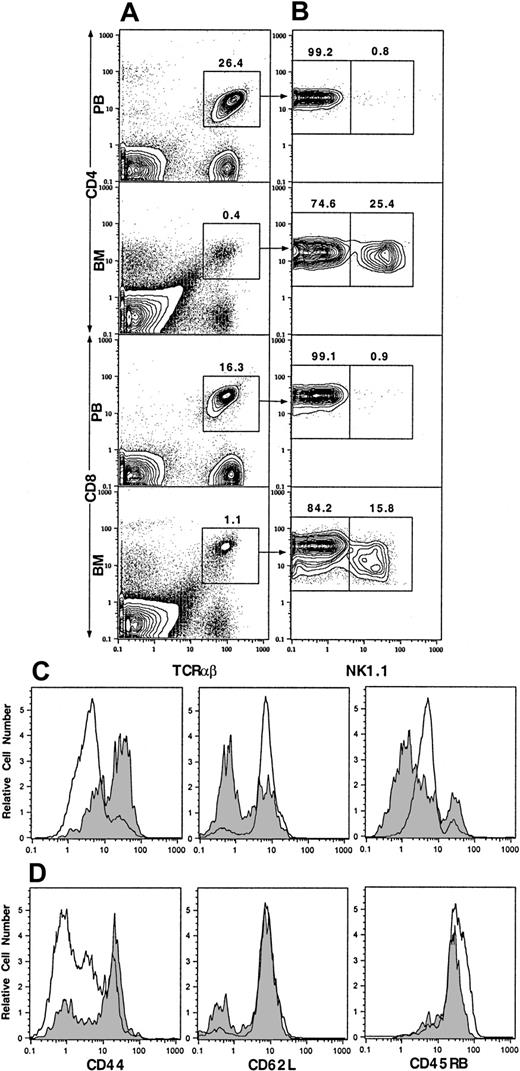
Our previous studies showed that NK1.1+ T cells make up about 30% to 50% of TCRαβ+ T cells in the marrow but only about 1% in the blood.2,5 NK1.1+ T cells have been previously reported to be CD44hiCD45RBhi.4 In the current study, we studied the expression of CD44 on the NK1.1+ and NK1.1− CD4+ and CD8+ T cells from blood and marrow by multicolor flow cytometry after staining with mAbs. As shown in Figure 1A, 26.4% of blood mononuclear cells were CD4+TCRαβ+ T cells. The mean (± SE) percentage in 4 mice was 23% ± 2%. After gating on the CD4+TCRαβ+ cells, only 0.8% of the cells were found to be NK1.1+, and 99.2% were NK1.1− (Figure 1B; mean 0.7% ± 0.1% and 99.3% ± 0.1%, respectively). TCRαβ+CD4+ cells were gated into NK1.1+ and NK1.1− cells for single-color analysis of CD44. Blood NK1.1− CD4+ cells were found to be mostly CD44int/lo (Figure 1C, open profile, left panel). CD4+TCRαβ+ cells accounted for 0.4% of cells in the marrow (Figure 1A), and 25.4% of them were NK1.1+, and 74.6% were NK1.1− (Figure 1B; mean 27% ± 1% and 73% ± 2%, respectively). In contrast to blood NK1.1− CD4+ cells, most of the marrow NK1.1− CD4+ cells were CD44hi(Figure 1C, shaded profile, left panel). About 16.3% of PB mononuclear cells were CD8+TCRαβ+ cells (Figure 1A; mean 13% ± 2%). Only 0.9% of the latter cells were NK1.1+ (mean 1.0% ± 0.2%), and there were insufficient PB NK1.1+ CD8+ cells for further analysis. Most blood NK1.1− CD8+ cells were also CD44int/lo (Figure 1D, open profile, left panel). TCRαβ+CD8+ cells in the marrow accounted for 1.1% of nucleated cells (Figure 1A), and 15.8% were NK1.1+ (mean 0.9% ± 0.2% and 18% ± 1%, respectively). In contrast to the blood NK1.1−CD8+ cells, most NK1.1− CD8+ cells were CD44hi (Figure 1D, shaded profile, left panel).
Two-color flow cytometric analysis of TCRαβ+ T cells from PB and BM of C57BL/6 mice.
(A) Staining of TCRαβ versus CD4 or CD8. (B) The analysis of the gated TCRαβ+CD4+ or TCRαβ+CD8+ cells from panel A for NK1.1 versus CD4 or CD8. (C) One-color analysis of the gated NK1.1− CD4+TCRαβ+ from PB (open profiles) or BM (shaded profiles) for CD44, CD62L, and CD45RB. (D) One-color analysis of the gated NK1.1−CD8+ TCRαβ+ T cells. Percentages of gated cells are shown above the boxes. One representative of 4 is shown.
Because CD44 is expressed at high levels in early T-cell development in the thymus and on activated/memory T cells,16,17 the expression of CD62L and CD45RB was studied also. The latter markers are down-regulated on activated/memory cells and present at higher levels on naive T cells.18 19 As shown in Figure 1D, both blood and marrow NK1.1− CD8+ T cells expressed high levels of CD62L and CD45RB. Thus, the blood NK1.1−CD8+ T cells showed a typical naive T-cell pattern (CD44int/loCD62LhiCD45RBhi), but the marrow NK1.1− CD8+ T cells showed an unusual CD44hiCD62LhiCD45RBhipattern. Figure 1C shows that blood NK1.1−CD4+ T cells had a naive CD44int/loCD62LhiCD45RBint T-cell pattern. However, the marrow NK1.1− CD4+ T cells had a down-regulated bimodal pattern of CD62L expression and a bimodal down-regulated pattern of CD45RB expression. Most expressed either low (≤ channel 1) or intermediate (channel 1-10) levels, and the remainder expressed high (≥ channel 10) levels of CD45RB. Two-color analysis of CD44 versus CD62L or CD44 versus CD45RB on the latter cells revealed that 30% to 50% had an unusual CD44hiCD62LhiCD45RBint/hi phenotype similar to the marrow NK1.1− CD8+ T cells (data not shown). The remainder of the CD44hiNK1.1− CD4+ T cells expressed the CD62LloCD45RBlo activated/memory cell phenotype.
Different cytokine secretion profiles of CD4+ and CD8+ T cells from blood and BM
To study the cytokine secretion profiles of the blood and marrow T-cell subsets, all T cells were first enriched with immunomagnetic beads, and desired subsets were thereafter isolated with flow cytometry. Sorted subsets (100 × 103) were stimulated with phorbol myristate acetate and calcium ionophore in vitro for 48 hours. The culture supernatants were assayed with enzyme-linked immunosorbent assay for the concentration of IL-2, IFN-γ, IL-4, and IL-10. As shown in Table 1, sorted blood CD4+ T cells (> 99% NK1.1−) produced large amounts of IL-2 (mean 2856 pg/mL) but little IFN-γ (mean 78 pg/mL), IL-4 (mean 26 pg/mL), or IL-10 (mean 17 pg/mL). In contrast, sorted marrow CD4+ T cells containing about 25% NK1.1+ cells (Figure 1) produced about 5 times less IL-2 but 10 times more IFN-γ and 20 times more of the Th2 cytokines IL-4 and IL-10. The sorted marrow NK1.1− CD4+ T cells still produced 7-fold less IL-2 but about 10 times more IFN-γ, IL-4, and IL-10 as compared with the sorted blood CD4+ T cells. Marrow CD4+ NK1.1+ T cells produced small amounts of IL-2 (mean 355 pg/mL) and large amounts of IFN-γ (mean 1051 pg/mL), IL-4 (mean 3072 pg/mL), and IL-10 (mean 380 pg/mL).
When the relative concentrations of IL-2, IFN-γ, IL-4, and IL-10 were compared (Table 2), PB CD4+ T cells had extremely high ratios of IL-2/IFN-γ (37:1), IL-2/IL-4 (110:1), and IL-2/IL-10 (168:1) as compared with those from BM CD4+, CD4+NK1.1+, and CD4+NK1.1− T cells (all < 3:1). On the other hand, ratios of IFN-γ/IL-4 or IFN-γ/IL-10 were low (all < 5:1) for all CD4+ T cells from blood and marrow (Table 2). As compared with blood CD4+ T cells, the blood CD8+ T cells produced about 2-fold less IL-2 (mean 1505 pg/mL) and 20-fold more IFN-γ (mean 1403 pg/mL) but similar amounts of IL-4 (mean 20 pg/mL) and IL-10 (mean 42 pg/mL) (Table 1). This resulted in high ratios (> 33:1) of the Th1 (IL-2 or IFN-γ) to Th2 (IL-4 or IL-10) cytokines for blood CD8+ T cells but a low ratio of IL-2/IFN-γ (Table 2). The latter ratio was markedly reduced as compared with blood CD4+ T cells (Table 2).
Comparison of cytokine profiles from blood CD8+ T (99% NK1.1−) and marrow NK1.1− CD8+ T cells showed both had high ratios of Th1 (IL-2 or IFN-γ) to Th2 (IL-4 or IL-10) cytokines (Table 2). The marrow NK1.1+CD8+ T cells produced small amounts of IL-2 (mean 700 pg/mL) but large amounts of IFN-γ (mean 2074 pg/mL), IL-4 (mean 2248 pg/mL), and IL-10 (mean 224 pg/mL). Inclusion of the NK1.1+ T cells among marrow CD8+ T cells resulted in increased levels of IL-4 and IL-10 as compared with marrow NK1.1− CD8+ T cells (Table 1).
Differences in the function of CD4+ and CD8+ T cells from blood and BM in the GVH disease assay
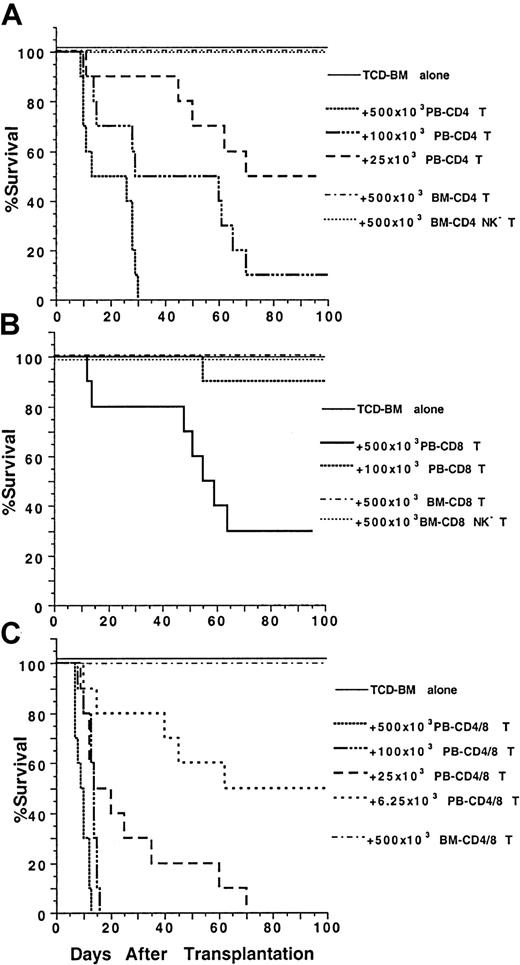
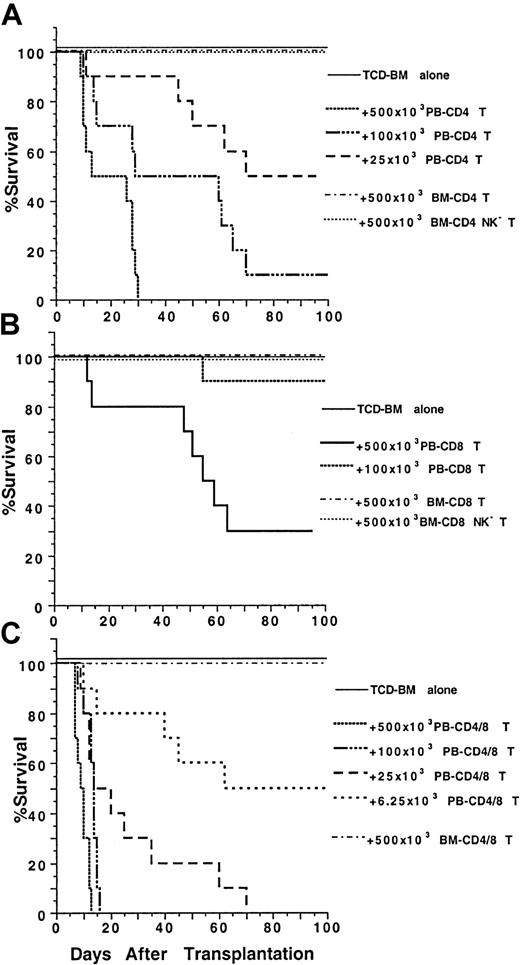
Because blood and marrow CD4+ and CD8+T-cell subsets had markedly different surface receptor expression and/or cytokine secretion profiles, we tested their function in a model of GVH disease using major histocompatibility complex–mismatched C57BL/6 (H-2b) donors and BALB/c (H-2d) hosts.5 Graded numbers of sorted blood and marrow T-cell subsets from the donor mice were coinjected with 1.5 × 10⁶ stringently TCD donor marrow cells into lethally irradiated 8 Gy (800 rads) hosts. As shown in Figure2A, all the recipients given TCD marrow cells alone survived for more than 100 days without any signs of GVH disease, and the recipients given no TCD marrow cells all died by day 14 (data not shown). Addition of graded numbers (25 × 103-500 × 103) of sorted blood CD4+ T cells induced severe diarrhea, weight loss, and mortality in a dose-dependent manner but no hair loss. The survival was significantly reduced as compared with that of the recipients given TCD marrow alone (P < .001, log-rank test). In contrast, addition of 500 × 103 sorted marrow CD4+(NK1.1+ and NK1.1−) T cells induced no clinical signs of GVH disease, and all the recipients survived for more than 100 days (Figure 2A). Furthermore, addition of 500 × 103 marrow NK1.1− CD4+ T cells induced only transient and mild signs of GVH disease, such as slight diarrhea and weight loss between days 40 to 60 after transplantation (data not shown), and all hosts survived for more than 100 days.
Marked difference in the ability of PB and BM CD4+ and CD8+ T cells to induce lethal GVH disease.
Graded numbers of sorted CD4+, CD8+, or CD4+/CD8+ (CD4+ and CD8+ together as a pool) T cells from C57BL/6 donors were added to a constant number (1.5 × 10⁶) of C57BL/6 TCD BM cells and injected intravenously into lethally irradiated (8 Gy) BALB/c hosts. Survival of hosts over a 100-day observation period is shown in groups of 10 mice. Data are combined from 2 replicate experiments. (A) Graded numbers of sorted PB and BM CD4+ T cells. (B) Graded numbers of PB and BM CD8+ T cells. (C) Graded numbers of PB and BM CD4+/CD8+ T cells.
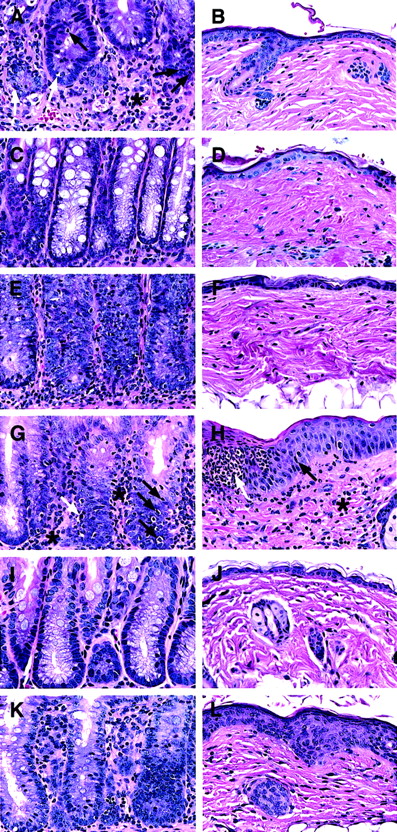
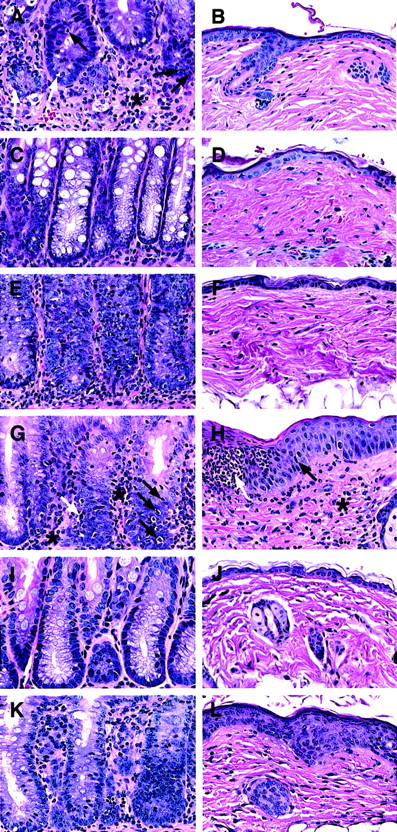
The colon and skin tissues were harvested from moribund recipients given blood CD4+ T cells between days 45 to 60. For comparison, tissues from recipients given marrow CD4+ or NK1.1− CD4+ T cells were harvested on day 45 as well, and both sources of tissues were studied for histopathology (Figure 3A-F). As shown in Figure 3A, the blood CD4+ T cells induced severe intestinal lesions associated with GVH disease. The lamina propria was expanded and markedly infiltrated with lymphocytes (asterisk). The atrophic intestinal crypts were depleted of plump mucin-containing glandular cells, and intraepithelial lymphocytic infiltration (black arrows) was observed along with apoptotic bodies (white arrows), indicating crypt cell death. Consistent with the lack of hair loss, recipients had no skin lesions (Figure 3B). The marrow CD4+ T cells induced no clinical GVH disease, and their large intestine and skin tissues looked normal (Figure 3C,D). The marrow NK1.1−CD4+ T cells induced characteristic microscopic GVH disease lesions in the colon (Figure 3E), although they were less severe than those induced by blood CD4+ T cells. The marrow NK1.1− CD4+ T cells induced no microscopic skin lesions (Figure 3F). There was no noticeable difference in body weight and tissue histology among the recipients given TCD marrow alone, TCD marrow with marrow CD4+ T cells, or NK1.1− CD4+ T cells 100 days after transplantation (data not shown). These results indicate that marrow NK1.1− CD4+ T cells can induce typical but mild histologic changes of GVH disease in the colon with mild transient clinical signs of GVH disease.
Ability of CD4+ and CD8+ T-cell subsets from PB and BM to induce histopathologic lesions of GVH disease in the colon and skin.
Sections are stained with hematoxylin and eosin and the original magnification is × 400. Each panel is representative of 4 recipients. (A,B) Intestine and skin of a BALB/c recipient with severe clinical GVH disease injected 50 days earlier with TCD BM and sorted PB CD4+ T cells. There is an expanded lamina propria with marked lymphocytic infiltration (asterisk) and infiltration into the glandular epithelium (black arrow). There are apoptotic bodies in the glandular epithelium also (white arrow). The skin appears to be normal. (C,D) The colon and skin sections of a healthy recipient injected 45 days earlier with TCD BM and BM CD4+ T cells. Plump mucin-containing glandular cells are seen lining the crypts with little or no inflammation. The skin appears to be normal. (E,F) The tissue sections of a recipient with slight diarrhea injected 45 days earlier with BM NK1.1− CD4+ T cells. The colon shows lesions of GVH disease, but the skin appears to be normal. (G,H) The sections of a recipient with severe clinical GVH disease injected 50 days earlier with TCD BM and PB CD8+ T cells. The colon shows lesions of GVH disease with lymphocytic infiltration of the lamina propria (asterisk) and crypts (black arrows) and apoptotic crypt cells (white arrow). The skin shows hyperplasia (black arrow) and microabscesses (white arrow) in the epidermis and lymphocyte infiltration in the dermis (asterisk). (I,J) The sections of a healthy recipient injected 45 days earlier with TCD BM and BM CD8+T cells. No abnormalities are seen. (K,L) The sections of a recipient with slight diarrhea and hair loss injected 45 days earlier with TCD BM and BM NK1.1− CD8+ T cells. There are lesions of GVH disease in both tissues, including inflammation of intestine crypts, epidermal hyperplasia, and dermal infiltration.
The capacity of blood and marrow CD8+ T-cell subsets to induce GVH disease were compared also. As shown in Figure 2B, TCD marrow cells alone induced no GVH disease, but addition of 500 × 103 blood CD8+ T cells induced severe GVH disease, and 70% of the recipients died within 100 days. Addition of 100 × 103 blood CD8+ T cells still induced typical clinical signs of GVH disease, but only 10% of the recipients died (Figure 2B). In contrast, addition of 500 × 103 marrow CD8+ (NK1.1+and NK1.1−) T cells induced no clinical signs of GVH disease or death. The addition of 500 × 103 marrow NK1.1− CD8+ T cells induced only transient mild signs of GVH disease, such as slight diarrhea, weight loss, and hair loss between days 40 to 60, and all the latter hosts survived for more than 100 days (Figure 2B). Colon and skin tissues from the moribund recipients given blood CD8+ T cells were harvested between days 45 to 60, as were the tissues from recipients given marrow CD8+ or NK1.1− CD8+ T cells (Figure 3G-L). The blood CD8+ T cells induced characteristic GVH disease lesions in the colon with a marked lymphocytic infiltration in the lamina propria (asterisk) and between glandular epithelium (black arrow) (Figure 3G). Crypt cell death with appototic bodies (white arrow) was observed as well as depletion of plump mucin-containing glandular cells. In the skin (Figure 3H), there was hyperplasia (black arrow), neutrophilic microabscesses (white arrow) in the epidermis, and lymphocytic infiltration in the dermis (Figure 3H). The marrow CD8+ T cells induced no microscopic evidence of GVH disease, and the intestine and skin tissues looked normal (Figure 3I,J). However, the marrow NK1.1−CD8+ T cells induced characteristic GVH disease lesions in the colon and skin tissues between days 40 to 60 (Figure 3K,L). There were also no clear differences among the recipients given TCD marrow alone, TCD marrow with marrow CD8+ T cells, or NK1.1− CD8+ T cells 100 days after transplantation with regard to appearance, body weight, and histology, indicating that any mild transient GVH disease had resolved by this time point (data not shown). Although both blood CD4+ and CD8+ T cells induced severe lethal GVH disease, the former were still 20 times more potent than the latter (Figure 2A,B). Blood CD4+ and CD8+ T cells also had a synergistic effect, because as few as 6.25 × 10³ blood CD4+ and CD8+ T cells, sorted as a single pool (CD4+/CD8+ T), induced a similar pattern of mortality (Figure 2C) as that of 25 × 103 blood CD4+ T cells or 500 × 103 blood CD8+ T cells (Figure 2A,B, P > .1, log-rank test). In contrast, addition of 500 × 103 marrow CD4+/CD8+ T cells induced no clinical signs of GVH disease or mortality (Figure 2C).
Different tissue distribution of blood and marrow CD4+and CD8+ T cells in irradiated allogeneic hosts
To distinguish donor cells derived from the injected blood or marrow T cells from those derived from the TCD marrow cells, blood CD4+/CD8+ or marrow CD4+/CD8+ T cells (500 × 103) from C57BL/6 (H-2b, CD45.2) mice were coinjected with TCD marrow cells (1.5 × 10⁶) from congenic C57BL/6 mice (H-2b, CD45.1) into lethally irradiated BALB/c recipients (H-2d, CD45.2). Seven days later, the mononuclear cells from blood, gut, spleen, liver, and marrow were harvested and stained with anti-TCRαβ, anti–H-2b, and anti-CD45.2 mAbs.
Figure 4 shows the percentage of injected donor T cells and/or their progeny among the mononuclear cells from different tissues of the BALB/c recipients. About 20% of the blood mononuclear cells from the recipients given sorted blood CD4+/CD8+ T cells and TCD marrow cells were donor-type T cells (TCRαβ+H-2b+, enclosed in box in Figure 4A). Gated donor-type T cells were all CD45.2+ (Figure 4A,B), derived from the injected donor blood T cells. In contrast, only 0.5% of the blood mononuclear cells from the recipients given sorted marrow CD4+/CD8+ T cells and TCD marrow cells were donor-type T cells, and insufficient numbers of latter cells were available for analysis of CD45.2 expression (Figure 4C,D). Similarly, 88% of the mononuclear cells from the gut of the recipients given blood CD4+/CD8+ T cells and TCD marrow cells were donor-type T cells (Figure 4E), but only 7% of the mononuclear cells from the gut of the recipients given marrow CD4+/CD8+ T cells and TCD marrow cells were donor-type T cells (Figure 4G). Again, all donor-type T cells were derived from the injected sorted T cells (Figure 4 F,H). There were high levels (86% and 74%) of donor-type T cells in the liver tissues of the recipients given blood CD4+/CD8+ T cells or marrow CD4+/CD8+ T cells (Figure 4I,K), respectively, and all were derived from injected T cells (Figure 4J,L). Analysis of the spleen and marrow cells showed that donor-type T cells accounted for less than 10% of mononuclear cells (data not shown). Further analysis of the recovered donor-type T cells from different tissues showed that they were all CD4+ or CD8+NK1.1− TCRαβ+ T cells (data not shown).
Different tissue distributions of PB and BM T cells in the allogeneic recipients at 7 days after BM transplantation.
Lethally irradiated BALB/c recipients (H-2Kd) were injected with 1.5 × 10⁶ donor C57BL/6 (H-2Kb, CD45.1) TCD BM and 500 × 103 PB CD4+/CD8+ or BM CD4+/CD8+ T cells from congenic C57BL/6 (H-2Kb, CD45.2) mice. The mononuclear cells from blood, gut, and liver of the recipients were harvested and stained with anti–H-2Kb, TCRαβ, and CD45.2 mAbs. In the first column, panels A, E, and I show the tissues from the recipients given PB CD4+/CD8+ T cells, and panels C, G, and K show the tissues from the recipients given marrow CD4+/CD8+ T cells. Analyses in panels A, C, E, G, I, and K show TCRαβ versus H-2Kb with TCRαβ+H-2Kb+ cells enclosed in boxes. In the second column, the gated TCRαβ+H2kb+cells were analyzed further for TCRαβ versus CD45.2 in panels B, D, F, H, J, and L. Each panel is representative of 4 recipients.
The mean percentages and yields of donor-type T cells from different tissues are shown in Table 3. The mean absolute numbers of the donor-type T cells in blood, gut, and spleen from the recipients given blood CD4+/CD8+ T cells were found to be respectively 40-fold (P < .001), 20-fold (P < .001), and 2-fold (P < .05) higher than that in the recipients given marrow CD4+/CD8+ T cells. However, there was no significant difference (P > .1) in the livers and marrow of the 2 kinds of recipients. These results indicate that the marked difference in the capacity of blood and marrow CD4+/CD8+ T cells to induce GVH disease is associated with their markedly different early expansion in the blood and gut tissues of the recipients.
Function of BM CD4+ and CD8+ T cells in graft versus tumor and facilitation of engraftment assays
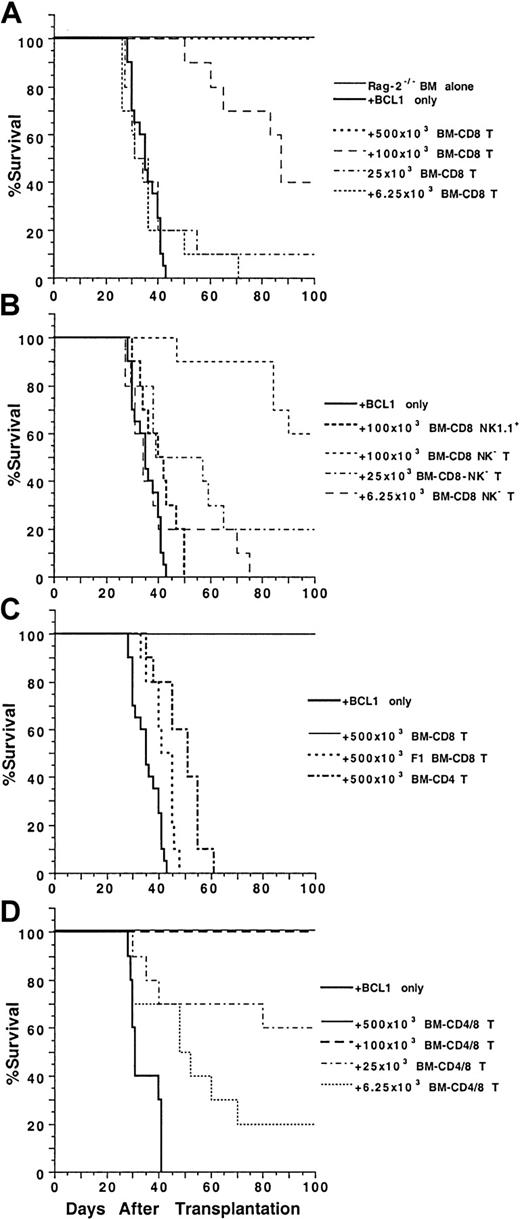
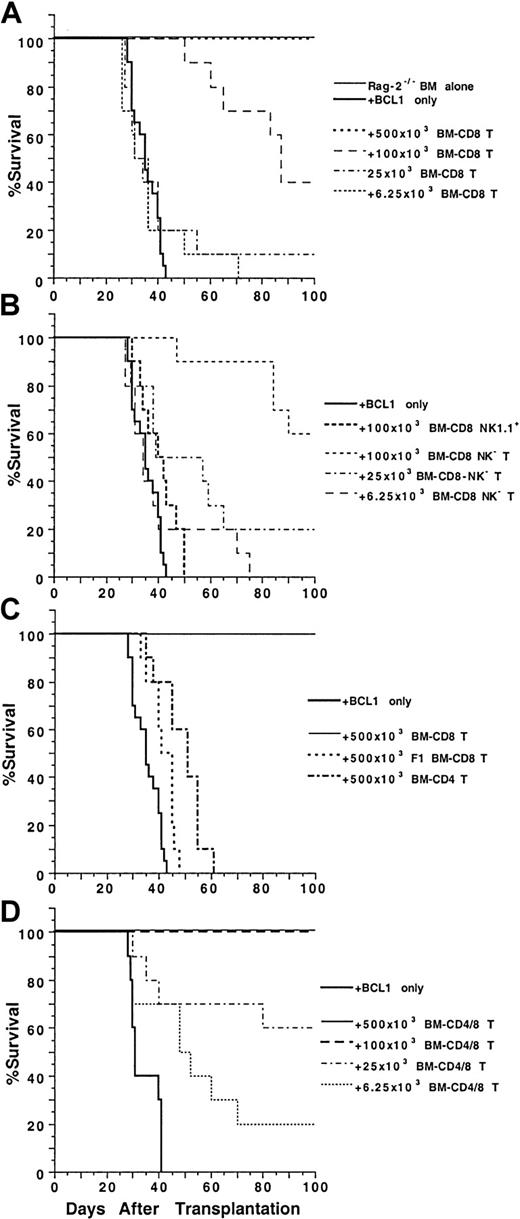
To test the antitumor activity of marrow CD4+ and CD8+ T cells, graded numbers of sorted T cells were coinjected with 1.5 × 10⁶ C57BL/6 Rag-2−/−marrow cells and 60 BCL1 B cell lymphoma cells into lethally irradiated (8 Gy [800 rads]) BALB/c recipients. As shown in Figure 5A, all the irradiated recipients given 1.5 × 10⁶ Rag-2−/− marrow cells alone survived for more than 100 days, but all the recipients given the same dose of marrow cells in combination with 60 BCL1 cells died of tumor growth by day 43. In contrast, addition of sorted marrow CD8+ T cells to the RAG-2−/− marrow cells increased the survival in a dose-dependent manner. Addition of as few as 25 × 103 marrow CD8+ T cells allowed 10% of the recipients to survive for more than 100 days (P > .05, log-rank test). Addition of 100 × 103 and 500 × 103 marrow CD8+ T cells, respectively, allowed 40% and 100% of the recipients to survive for more than 100 days (P < .0001). The spleen cells of the recipients were stained with anti–BCL1-Id mAb and analyzed by flow cytometry for the presence of BCL1 cells. The spleens of moribund recipients given only RAG-2−/− marrow cells contained 50% to 80% of BCL1 cells (data not shown). The spleen cells of 2 of the 4 recipients given 100 × 103 marrow CD8+T cells and RAG-2−/− marrow cells that survived for more than 100 days had 5% to 10% BCL1 cells, and the spleens of recipients given 500 × 103 marrow CD8+ T cells had no detectable BCL1 cells (data not shown). The results indicate that high doses of marrow CD8+ T cells are able to eliminate the BCL1 cells, but low doses induce “tumor dormancy.”
Ability of BM CD4+ and CD8+ T cells to mediate anti-BCL1 tumor activity.
Graded numbers of sorted C57BL/6 BM CD4+, CD8+, or CD4+/CD8+ T cells were added to a constant number of C57BL/6 Rag-2−/− BM cells (1.5 × 10⁶) and 60 BALB/c BCL1cells and injected intravenously into lethally irradiated BALB/c recipients. Survival over a 100-day observation period is shown for groups of 10 mice. Data are combined from 2 replicate experiments. (A) Graded numbers of BM CD8+ T cells. (B) BM NK1.1+ or NK1.1− CD8+ T cells. (C) C57BL/6 BM CD4+ T cells or BM CD8+ T cells from C57BL/6xBALB/c F1 mice. (D) Graded numbers of BM CD4+/CD8+ T cells.
As shown in Figure 5B, addition of 100 × 103 marrow NK1.1+CD8+ T cells showed little antitumor activity. In contrast, addition of marrow NK1.1−CD8+ T cells showed dose-dependent antitumor activity, and 100 × 103 cells were able to rescue 60% of the recipients for more than 100 days. The surviving recipients did not have observable clinical signs of GVH disease, and their spleens did not have detectable BCL1 cells as judged by flow cytometry analysis (data not shown). C57BL/6xBALB/c F1 marrow CD8+ T cells (500 × 103) and C57BL/6 marrow CD4+ T cells (500 × 103) had little antitumor activity in the BALB/c recipients, and all died by 65 days (Figure 5C).
Although marrow CD4+ T cells alone were not able to mediate antitumor activity, they enhanced the antitumor activity mediated by marrow CD8+ T cells. As shown in Figure 5D, 100 × 103 combined marrow CD4+/CD8+ T cells were able to effectively treat hosts given BCL1 cells, and all the recipients survived for more than 100 days. In contrast, 100 × 103sorted marrow CD8+ T cells alone rescued only 40% of the BCL1-bearing recipients (Figure 5A,D,P < .01, log-rank test). In addition, the survival of the recipients given 25 × 103 or 6.25 × 10³marrow CD4+/CD8+ T cells was similar to that of the recipients given 100 × 103 or 25 × 103 marrow CD8+ T cells, respectively (Figure 5A,D, P > .05, log-rank test). We did not test the antitumor activity of either blood CD4+ or CD8+ T cells, because these cells induced lethal GVH disease.
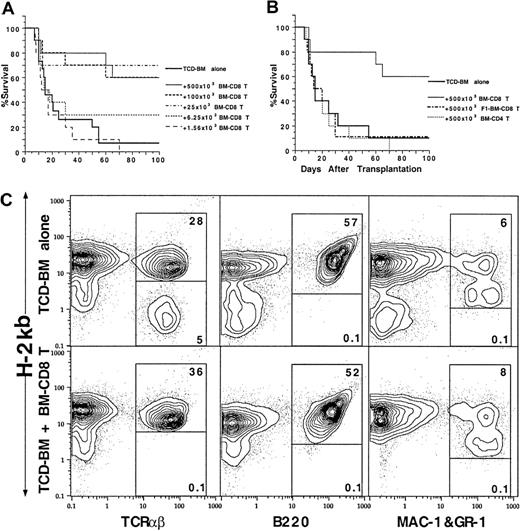
The sorted marrow CD4+ and CD8+ T cells were also tested for facilitation of engaftment of hematopoietic progenitors. Graded numbers of marrow CD4+ or CD8+ T-cell subsets were coinjected with a suboptimal dose (750 × 103) of C57BL/6 donor TCD marrow cells into lethally irradiated BALB/c recipients without tumor cells. As shown in Figure 6A, only 10% of the recipients given TCD marrow cells alone had long-term survival of more than 100 days. Addition of marrow CD8+ T cells to the TCD marrow cells resulted in a dose-dependent increase in long-term survival. Injection of as few as 6.25 × 10³ marrow CD8+ T cells increased the long-term survival from 10% to 30% (P < .05, log-rank test), and 25 × 103 marrow CD8+ T cells increased the long-term survival to 70% (P < .001, log-rank test). Further increase of the marrow CD8+ T-cell dose to 100 × 103 or 500 × 103 failed to further increase the survival beyond this plateau (Figure 6A).
Ability of donor BM CD4+ and CD8+ T cells to facilitate engraftment.
Graded numbers of sorted C57BL/6 BM CD4+ and CD8+ T cells were added to constant numbers (750 × 103) of C57BL/6 TCD BM cells and injected into lethally irradiated BALB/c recipients. Survival over a 100-day observation period is shown for groups of 10 to 20 mice. Data are combined from at least 2 replicate experiments. (A) Graded numbers of BM CD8+ T cells. (B) C57BL/6 BM CD4+ T cells or BM CD8+ T cells from C57BL/6xBALB/c F1 mice. (C) Chimerism of the BALB/c recipients given C57BL/6 TCD-BM cells alone or C57BL/6 TCD-BM and C57BL/6 BM CD8+ T cells 100 day after BM transplantation. The spleen cells were stained for anti–H-2Kb versus TCRαβ, B220, or MAC-1 and Gr-1 markers. The donor-type cells are shown in the upper box and host-type cells in the lower box in each panel.
In contrast, addition of 500 × 103 marrow CD4+ T cells or C57BL/6xBALB/c F1 marrow CD8+ T cells did not increase the survival rate as compared with TCD marrow alone (Figure 6B). As shown in Figure 6C, the spleen cells of the recipients were stained with anti–H-2b versus TCRαβ, B220, and MAC-1/Gr-1 mAbs after 100 days. The recipients given TCD marrow only showed mixed chimerism in which about 80% of T cells were donor type and 20% host type, but all the B cells, macrophages, and granulocytes were donor type. In contrast, addition of donor marrow CD8+ T cells resulted in a complete chimerism of T cells as well as B cells, macrophages, and granulocytes. (Figure 6C). Marrow CD4+ T cells were not able to induce complete chimerism (data not shown) and facilitate engraftment.
Discussion
In the current study, the NK1.1− CD4+ and CD8+ T cells in the marrow and blood were investigated with regard to surface phenotype, cytokine secretion, and function. Most of the blood NK1.1− CD8+ T cells were CD44int/loCD62LhiCD45RBhi, but most of the marrow NK1.1− CD8+ T cells were CD44hiCD62Lhi CD45RBhi. The phenotype of the blood T cells is representative of the typical naive T-cell phenotype found in the lymph nodes and spleen.7 The unusual phenotype of the marrow NK1.1− CD8+ T cells has been reported previously in extrathymically derived CD8+ T cells and in those that have expanded in T-cell–deficient adoptive hosts presumably stimulated by endogenous self ligands.20-22 About 30% to 50% of the marrow NK1.1− CD4+ T cells also showed the CD44hiCD62LhiCD45RBhi phenotype, and the remainder of the marrow NK1.1− CD4+ T cells were mainly CD44hiCD62loCD45RBlo. The latter phenotype has been reported previously on activated/memory CD4+ T cells,7,17 extrathymically derived CD4+ T cells,20 and CD4+ T cells in the normal marrow.7 The former phenotype has been reported on extrathymically derived CD4+ T cells as well.20 The unusual phenotype of T cells in the marrow may reflect their derivation from an alternative extrathymic developmental pathway that is present in the BM itself,8 9 activation by endogenous ligands in the marrow, and migration to the marrow after activation in the periphery.
The unusual surface receptor phenotype of marrow CD4+ T cells was associated with an atypical cytokine secretion profile. Blood CD4+ T cells produced large amounts of IL-2 with little IFN-γ, IL-4, or IL-10, as reported for freshly isolated naive CD4+ T cells from the spleen after in vitro stimulation.23 Marrow NK1.1− CD4+T cells secreted 5- to 10-fold higher levels of IFN-γ, IL-4, and IL-10 as compared with blood CD4+ T cells and a 7-fold lower levels of IL-2. Thus, the marrow NK1.1−CD4+ T cells expressed a cytokine pattern that was unique and similar to the previously described Th0 pattern.23,24The cytokine profile of the blood NK1.1− CD8+T cells was quite similar to that of the marrow NK1.1−CD8+ T cells, and both produced high levels of IL-2 and IFN-γ and very low levels of IL-4 and IL-10, as described previously as the Tc1 pattern.25
We tested the blood and BM CD4+ and CD8+ T cells for their function in 3 different assay systems: (1)induction of GVH disease, (2) mediation of allogeneic antitumor activity, and (3) facilitation of engraftment of allogeneic hematopoietic progenitors. Separated donor blood CD4+ and CD8+ T cells induced lethal GVH disease, whereas separated donor T-cell subsets from the marrow failed to induce lethal GVH disease, including all CD4+, all CD8+, NK1.1− CD4+, and NK1.1− CD8+ T cells. The blood CD4+ T cells were 20 times more potent than blood CD8+ T cells on a cell-per-cell basis. The higher potency of CD4+ versus CD8+ T cells in the C57BL/6xBALB/c strain combination has been reported previously.26 27 The inability of purified marrow CD4+ T cells to induce lethal GVH disease even at a high cell number (500 × 103) was striking. The early expansion of the donor blood CD4+ and CD8+ T cells in the blood and gut of allogeneic recipients was 20- to 40-fold higher than that of marrow CD4+ and CD8+ T cells, and the marked difference in migration and proliferation may contribute to the different capacities to induce GVH disease.
Consistent with previous reports,10-12 the current study showed that marrow CD8+ T cells mediated antitumor activity and facilitated engraftment of donor hematopoietic stem cells but failed to induce GVH disease even at high cell numbers (500 × 103). At lower doses, peripheral CD8+T cells have been reported to mediate antitumor activity without GVH disease.27,28 Antitumor activity was mediated by the NK1.1− but not the NK1.1+ CD8+T-cell subset. NK1.1+CD8+ T cells generated from prolonged culture of spleen or marrow cells in vitro with IL-2, IFN-γ, and anti-CD3 mAb have been reported to mediate antitumor activity without GVH disease.29 The cultured cells are likely different from the fresh marrow NK1.1+CD8+ T cells, because the NK1.1 marker on the fresh cells is constitutively expressed whereas the NK marker on the cultured cells appears to be induced, even on the cells from CD1−/− mice deficient in T cells with the constitutive NK1.1 marker.29 The antitumor and facilitation of engraftment activities of marrow CD8+ T cells were dependent on their alloreactivity, because the marrow CD8+T cells from C57BL/6xBALB/c F1 donors failed to function in these assays. The marrow CD4+ T cells were inactive in the antitumor and engraftment facilitation assays also; however, they enhanced the antitumor activity mediated by marrow CD8+ T cells without enhancing or inducing GVH disease. These unique characteristics of marrow CD4+ T cells as well as the abundance of marrow NK1.1+ T cells that prevent GVH disease can explain the inability of purified marrow TCRαβ+ T cells (total T cells) to induce GVH disease in this strain combination.5 The results of the current study may impact on clinical allogeneic BM transplantation. If marked differences between human blood and marrow T cells can be documented, the preservation of resident marrow but not blood T cells in the transplant innoculum may result in the desirable outcome of antitumor and facilitation of engraftment activity without injury to nonlymphoid tissues of the host.
We thank Jun-Chuan Xu and Aditi Mukhopadhyay for their excellent technical assistance and Mary Hansen for her assistance in preparation of manuscript.
Supported with funds from National Institutes of Health grants HL-57443 and HL-58250.
The publication costs of this article were defrayed in part by page charge payment. Therefore, and solely to indicate this fact, this article is hereby marked “advertisement” in accordance with 18 U.S.C. section 1734.
References
Author notes
Samuel Strober, Division of Immunology and Rheumatology, Department of Medicine, CCSR Bldg, 2215-C, Stanford Medical Center, 300 Pasteur Dr, Stanford, CA 94305-5166; e-mail:sstrober@stanford.edu.

