Abstract
Individuals with elevated prothrombin levels are at increased risk of venous thrombosis. To understand the mechanism behind this observation, we studied the effect of prothrombin concentration on thrombin generation and fibrin clot structure. The pattern of thrombin generation was directly related to the prothrombin level at all concentrations tested. From 0% to 300% of normal plasma levels of prothrombin, increasing the prothrombin concentration increased the initial rate, peak, and total amount of thrombin generated. Importantly, fibrin clot structure was also affected by the prothrombin concentration. Fibrin clots made from prothrombin concentrations less than 10% of plasma levels were weak and poorly formed. Fibrin clots made at 10% to 100% of plasma levels of prothrombin had similar fiber structures (mass-to-length ratio; μ). However, the fiber mass-to-length ratio decreased with increasing prothrombin levels more than 100% of plasma levels, in a dose-dependent manner. These results suggest that increased levels of prothrombin alter thrombin generation and clot structure. Specifically, elevated prothrombin levels produce clots with reduced fibrin mass-to-length ratios compared with normal clots. We hypothesize that this alteration in fibrin clot structure is an important determinant of the risk of thrombosis.
Introduction
Elevated levels of several coagulation factors, including factors XI,1 VIII:C,2 and fibrinogen,3,4 have been correlated with an increased risk of thrombosis in epidemiologic studies. Recently, elevated levels of prothrombin have also been correlated with a risk of arterial and venous thrombosis.5-7 A mutation in the 3′-untranslated region of the prothrombin coding gene has been described, which is related to the elevated levels of prothrombin.5 However, the mechanism by which elevated prothrombin contributes to thrombosis is thus far unresolved.
The increased tendency of patients with elevated prothrombin to experience thrombosis does not appear to result from an increased level of ongoing hemostatic activation; prothrombin fragment 1 + 2 levels are not constitutively elevated in these patients.8Kyrle et al, however, observed a significantly increased endogenous thrombin potential in both heterozygous and homozygous carriers of the 20210G>A mutation,8 suggesting that elevated levels of prothrombin result in increased thrombin generation during coagulation events. In vitro models of coagulation support this hypothesis. Several studies have shown that increasing the initial level of prothrombin affects several parameters of thrombin generation, including the initial rate of thrombin generation and total amount of thrombin generated.9,10 Even moderate increases in the prothrombin level (to 150% of normal plasma levels) results in a substantial increase (71%-121%) in the amount of thrombin generated in vitro.9
Increased thrombin generation, by itself, however, does not provide a direct biochemical mechanism for the increased risk of thrombosis. That is, the increased thrombin must have a specific physiologic effect that disrupts hemostasis to cause thrombosis. However, because thrombin participates in both procoagulant and anticoagulant processes,11 it is not obvious, a priori, how increased thrombin generation would contribute to an increased risk of thrombosis. For example, it is possible to imagine one of 3 scenarios resulting from increased thrombin generation in vivo: (1) elevated thrombin could up-regulate procoagulant pathways (by altering fibrinogen cleavage, by activating factor XIII or the thrombin-activatable fibrinolysis inhibitor [TAFI], or by increasing platelet activation); (2) elevated thrombin could attenuate coagulation (by up-regulating the anticoagulant reactions: protein C activation, or factors Va or VIIIa inactivation); or (3) increased thrombin activities toward both procoagulant and anticoagulant pathways might not alter hemostasis at all. Clinical data demonstrate that the first of these possibilities occurs in vivo. That is, increased thrombin generation, measured as an increase in prothrombin activation products, correlates with an increased risk of thrombosis.12 However, no mechanism for this effect has yet been identified.
Previous studies of clot formation have shown that the thrombin concentration used to clot fibrinogen can profoundly affect a clot's structure.13,14 That is, adding different concentrations of thrombin to purified fibrinogen or plasma produces clots of markedly different structures. Clots produced with low thrombin concentrations are turbid, porous, and composed of thick fibrin fibers, whereas clots generated with high thrombin are less turbid and are composed of a tightly knit network of thin fibers.13-15
Therefore, as a preliminary step to understanding the mechanism for thrombosis in individuals with increased plasma prothrombin levels, we examined the relationship between prothrombin concentration, thrombin generation, and fibrin clot formation. We hypothesized that by altering the pattern of normal thrombin generation, elevated levels of prothrombin cause the formation of abnormal clots. To test this hypothesis, we altered the initial level of prothrombin in a cell-based in vitro clotting assay and in normal plasma and examined the effect on thrombin generation and clot formation and structure. Our data demonstrate that increased levels of prothrombin alter thrombin generation and result in an abnormal fibrin clot structure. These results show, for the first time, a direct biochemical connection between the effect of elevated prothrombin levels and the identified risk factor for thrombosis.
Materials and methods
Proteins and reagents
Prothrombin and factor IX were purified as described.16,17 Antithrombin III (ATIII) was purified from outdated fresh-frozen human plasma by heparin affinity chromatography. Factor X was purchased from Enzyme Research Laboratories (South Bend, IN), factors V and XI from Hematologic Technologies (Essex Junction, VT), and factor VIII from the University of North Carolina hospital pharmacy as Koate. Factor VIII was further purified by gel filtration on Sepharose CL-2B. Prothrombin and factors X and IX were treated with an inhibitor mixture (1 μM each ofN-tosyl-l-lysine chloromethyl ketone [TLCK],N-tosyl-l-phenylalanine chloromethyl ketone [TPCK], 1,5-dansyl-glu-gly-arg chloromethyl ketone [DEGRCK],d-phe-pro-arg-chloromethyl ketone [PPACK], and phenylmethylsulfonyl fluoride [PMSF]), isolated on Q Sepharose with CaCl2 elution,18 and dialyzed exhaustively to remove active proteases from zymogens. Factor VIIa and tissue factor pathway inhibitor (TFPI) were gifts of Novo Nordisk (Maloev, Denmark). Plasminogen-free fibrinogen was purchased from Enzyme Research Laboratories and repurified on a gelatin-Sepharose column to remove fibronectin contamination.
Cell isolation
Monocytes were purified using AccuPrep Lymphocytes medium (Accurate Chemicals, Westbury, NY),19 plated in 96-well plates with 500 ng/mL bacterial lipopolysaccharide (LPS) and allowed to adhere for 1 hour. The cells were washed to remove lymphocytes, then cultured overnight before being used in experiments. Cells were washed in HEPES-buffered saline/bovine serum albumin (HBS/BSA; 20 mM HEPES [N-2-hydroxyethylpiperazine-N′-2-ethanesulfonic acid]; pH 7.4, 150 mM NaCl, 1 mg/mL bovine serum albumin) to remove culture medium and serum products prior to each experiment. Platelets were freshly isolated from individual donors by density gradient centrifugation and gel filtration as described.20
Cell-based in vitro clotting assay
The model plasma system includes tissue factor–bearing cells, platelets, plasma levels of factors II, V, VIII, IX, X, XI, ATIII, TFPI, 3 mM CaCl2, and a catalytic amount of factor VIIa.21 Fibrinogen was present at 1 or 2 mg/mL, as described. Briefly, procoagulant proteins and inhibitors were incubated overnight at 4°C to ensure that any trace contaminating proteases in the zymogen preparations were inhibited prior to the assay start. Monocytes were washed with Tyrodes buffer containing 1 mg/mL BSA to remove the media prior to the start of the assay. At the start of the assay (time = 0 minute), freshly isolated platelets were added to microtiter wells containing purified proteins and immediately added to the tissue factor–bearing monocytes. Reactions were performed simultaneously in parallel wells, with and without fibrinogen.
Measurement of thrombin generation and platelet activation
Timed aliquots were removed from wells lacking fibrinogen and assayed for thrombin activity by adding to 0.5 mM Chromozym Th (Boehringer Mannheim, Mannheim, Germany) and 50 μM TenStop (American Diagnostica, Greenwich, CT).21 Reactions were quenched after a specific time period with 50% acetic acid, and the amount of thrombin generated was determined by comparison to a standard curve of thrombin. Platelet activation was measured by flow cytometry using a phycoerythrin-conjugated anti-CD62 antibody (Becton Dickinson, Franklin Lakes, NJ) as a marker of platelet activation.22
Platelet-rich plasma system
Platelet-rich plasma from individual donors was made by centrifuging citrated plasma treated with 5 μg/mL prostaglandin E1 (Sigma, St Louis, MO) at 800 rpm (150g) for 10 minutes and used within 2 hours. Platelet-rich plasma from healthy donors was supplemented with prothrombin to achieve levels more than 100%, recalcified, and added to tissue factor–bearing monocytes to initiate clotting. Clot formation was monitored by absorbance at 405 or 450 nm.
Characterization of fibrin clot structure by turbidity
Clot formation was detected by an increase in optical density at 405 or 450 nm in a SoftMax plate reader (Molecular Devices, Sunnyvale, CA). The clot's final turbidity reflects the structure of the fibrin fibers comprising the clot.23,24 This structure was quantitated in one of 2 ways: by measuring the change in absorbance during clotting or by calculating the mass-to-length ratio of fibrin fibers in the clotted samples. For determination of mass-to-length ratio, turbidity measurements were made with a SPECTRAmax PLUS384 UV/VIS microplate/cuvette spectrophotometer (Molecular Devices), using a modification24 of the method of Carr and Gabriel.25 The gels were scanned from 400 to 800 nm, and the weight average mass per length ratio (μ) of the fibrin polymers was calculated from the wavelength dependence of turbidity according to the equation: τ = [(88/15)π3n(dn/dC)2Cμ]/Nλ3where τ is the sample turbidity, n is the refractive index, C is the concentration in g/L, dn/dC is the change in refractive index per change in fibrinogen concentration, μ is the mass-to-length ratio, N is Avogadro number, and λ is the wavelength of the incident light. When this technique is adapted to use in a plate-reading spectrophotometer, the calculated values for μ can be used to compare the structures of different fibrin clots, that is, fibrin clots with a higher value have thicker fibers than clots with a lower value. However, the absolute values for μ are not the same as those obtained when measurements are made of clots formed in cuvettes and scanned in a high-end spectrophotometer.24 This is likely due to greater loss of scattered light in the microplate reader format. For this reason, in this study mass-to-length ratios are reported as a relative value, where the mass-to-length ratio of fibrin clots formed at 100% of the normal concentration of prothrombin is normalized to 1. The presence of platelets did not alter mass-to-length ratio determination (data not shown).
Transmission electron microscopy
Clots formed in the model system assays were fixed overnight in 2% glutaraldehyde. The fixed clots were then removed from the wells, washed, and embedded in Epon for thin sectioning. The fiber dimensions of the clots were determined by measuring the diameter of fibers fitting specific criteria: fibers measuring at least 4 times longer than they are wide (to distinguish between fibers and debris), and measuring through the thickest region that is not part of a branch point, according to the method of Gruber et al.26
Statistical methods
F tests, adjusted for donor-dependent differences in platelet activity, were used to identify statistically significant changes in the mass-to-length ratios of fibrin clots formed in the presence of different prothrombin concentrations (n = 9). To analyze the transmission electron microscopy (TEM) data, the average measured values for fiber diameters in clots analyzed by TEM were calculated for each experiment (n = 3). A model that allowed adjustments for donor-dependent differences in each experiment was then used to compare the effects of 10%, 100%, 150%, and 300% prothrombin concentrations on fiber diameter. A paired t test was used to determine the statistical significance of differences in measurements of fibers in clots formed in the presence of 100% and 300% prothrombin levels. A Wilcoxon signed rank test was used to compare differences between plasma clots formed in the presence of 100% and 200% prothrombin levels.
Results
Thrombin generation
During this study, we correlated thrombin generation with fibrin clot formation by separately measuring thrombin generation in the absence of fibrin(ogen). When making this correlation, we assumed that the amount of thrombin generated in the absence of fibrinogen is equal, or approximately similar to, the amount generated in the presence of fibrinogen. It is possible, however, that this is not the case. Several reports have suggested that the presence of fibrinogen affects the level of thrombin generation in the system. Fibrinogen interactions with the platelet surface, possibly via the glycoprotein IIb/IIIa (GPIIb/IIIa) receptor, may alter the procoagulant nature of the platelet surface.27-30 Additionally, because thrombin bound to the fibrin network is somewhat protected from inhibition by ATIII, this interaction may effectively increase the amount of thrombin activity present during the reaction. Alternately, binding sites for thrombin on fibrin make fibrin function as an “antithrombin,” inhibiting thrombin generation in plasma.31 Finally, thrombin binding to the fibrin network may preclude accurate measure of the total thrombin generated in the system. Preliminary experiments in our laboratory, however, suggest that the gross amount of thrombin generated in the presence and absence of fibrinogen is approximately similar, with similar onset times. Furthermore, it is likely that the effect of fibrinogen on thrombin generation is consistent across the concentrations of prothrombin tested, and therefore, does not significantly affect our analysis. Therefore, for this study, the level of prothrombin was varied from 0% to 300% of plasma levels in model plasma wells lacking fibrinogen, and 4 parameters of thrombin generation were studied: (1) the lag until thrombin generation starts, (2) the initial rate of thrombin generation, (3) the peak level of free thrombin, and (4) the total thrombin produced.
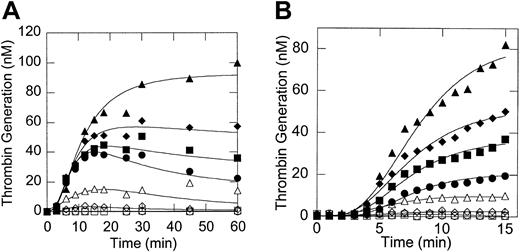
Figure 1 demonstrates that increasing the prothrombin concentration significantly increased the initial rate, peak, and total amount of thrombin generated (Figures 1A-B), but did not significantly affect the lag time to thrombin generation (Figure1B). We observed considerable variability in the absolute amount of thrombin generated in separate assays due to variability in the number of platelets isolated from different donors and in the procoagulant potential of platelets from different donors. Such differences in donor platelet activity have been described before by others.32,33 Nonetheless, the prothrombin-dependent trends observed in thrombin generation (and clot formation) were consistent. These results are in agreement with previous studies demonstrating that elevated prothrombin increases the initial rate and total free thrombin generated during coagulation.9 10
Thrombin generation is dependent on the initial prothrombin concentration.
Tissue factor–bearing cells were incubated with unactivated platelets, catalytic amounts of factor VIIa, calcium (3 mM), and plasma concentrations of factors IX, X, V, VIII, ATIII, and TFPI with increasing concentrations of prothrombin. At the times shown, samples were removed and assayed for the amount of thrombin as described in “Materials and methods.” Symbols: 0% (○), 1% (■), 10% (⋄), 50% (▵), 100% (●), 150% (▪), 200% (♦), and 300% (▴) of plasma levels. The absolute amounts of thrombin generated in each assay differed, depending on the procoagulant potential of the donor's platelets.33 Therefore, the data shown are representative of experiments with 8 different donors. (A) Thrombin generation profile from 0 to 60 minutes after the reaction start; (B) thrombin generation profile showing only the first 15 minutes of a reaction course. Panels A and B are from separate experiments using different donor platelets.
Platelet activation
Platelet activation occurred prior to measurable thrombin generation or fibrin clot formation. Platelet activation was slightly delayed in the presence of prothrombin levels less than 5% of plasma levels. All concentrations above 5% of plasma levels of prothrombin gave identical platelet activation profiles (data not shown).
Fibrin clot formation in the model system of coagulation
We then examined the ability of different initial concentrations of prothrombin to affect clot formation in the model plasma system. In our experiments, as well as those of others,9,13,34 35fibrin clot formation began prior to the peak of thrombin generation, suggesting that the peak amount of thrombin does not determine the structure of the fibrin clot. Rather, these experiments suggest that thrombin generation events early in the reaction (the onset time of thrombin generation or the initial rate of thrombin generation or both) determine the architecture of the clot formed during coagulation.
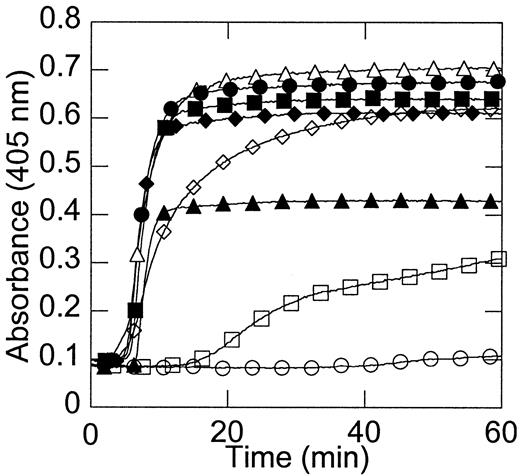
Figure 2 shows that no clots formed in the absence of prothrombin. Clot formation in the presence of extremely low (1%) prothrombin was significantly delayed (Figure 2), in agreement with the clinical bleeding tendency of patients with extremely low levels of prothrombin. The onset time and rate of clot formation with 10% or higher prothrombin levels were approximately identical and occurred prior to the time at which the peak free thrombin concentration was reached (Figure 2).
Fibrin clot formation is dependent on the initial prothrombin concentration.
The model plasma system was incubated with 2 mg/mL fibrinogen and the level of prothrombin (0% ○, 1% ■, 10% ⋄, 50% ▵, 100% ●, 150% ▪, 200% ♦, and 300% ▴ of plasma levels) was varied. Clot formation was monitored by an increase in optical density. Data shown are representative of 10 experiments.
Characterization of fibrin clot structure in the model system
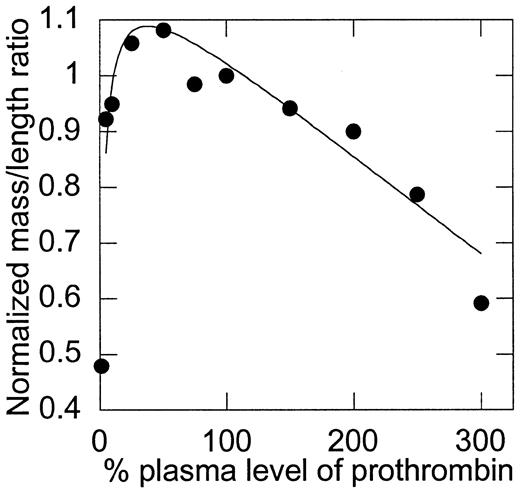
Although the temporal parameters of clot formation did not change as prothrombin levels were increased above 10%, differences in the final optical density of the clots suggested differences in the clot structure. These differences were evaluated by mass-to-length ratio analysis (Figure 3). First, consistent with the bleeding tendency of prothrombin-deficient individuals, clots that formed in the presence of less than 10% of plasma levels of prothrombin were weak and poorly formed (exhibited by a minimal change in optical density), demonstrating the obvious requirement for prothrombin in clot formation. Second, although the initial rate, peak, and total amount of thrombin generation were directly related to the initial prothrombin concentration, the structure of clots made from low (∼10%) to normal (100%) levels of prothrombin was relatively unaffected by changes in prothrombin concentration. A slight trend was observed that suggested a peak mass-to-length ratio between 25% and 75% of plasma prothrombin levels; however, differences in this range were not statistically significant. The mass-to-length ratio of clots formed from more than 100% of normal plasma levels was inversely related to the concentration of prothrombin present; that is, the mass-to-length ratio of fibrin fibers was progressively smaller with increasing concentrations of prothrombin from 100% to 300% of plasma levels (P < .0001). In particular, an F test for differences between mass-to-length ratios of clots formed from 100% and 150% of plasma prothrombin levels yieldedP = .0128, indicating that clots formed from elevated plasma prothrombin levels have significantly smaller mass-to-length ratios (thinner fibers) than normal clots and that this phenomenon occurs at levels of prothrombin seen in individuals with elevated prothrombin.
The mass-to-length ratio of fibrin fibers is dependent on the initial concentration of prothrombin.
Mass-to-length ratios were calculated by scanning the fibrin clots from 400 to 800 nm, as described in “Materials and methods.” Values were then normalized, such that 100% of plasma levels of prothrombin were set equal to 1. Note that the y-axis does not begin at 0. Data shown are representative of measurements on 9 experiments.
Characterization of fibrin clot structure in plasma
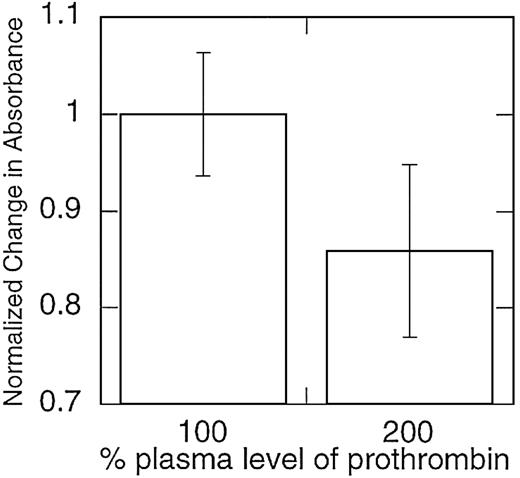
The reconstituted model system of coagulation does not contain several plasma proteins thought to affect clot formation and lysis in vivo, including factor XIII36,37 and the TAFI, carboxypeptidase U.35 Therefore, to ensure that the observed effect of prothrombin on clot structure was not an artifact of this system, we also examined the effect of elevated prothrombin levels on clots formed from platelet-rich plasma from individual healthy donors. The effect of prothrombin concentration on clot structure in platelet-rich plasma was similar to that observed in the model plasma system; across 5 individuals studied, clots formed in the presence of 200% prothrombin levels were composed of thinner fibrin fibers (P < .05; Figure4).
Clots formed from plasma samples with elevated prothrombin levels contain fibrin fibers with smaller mass-to-length ratios.
Platelet-rich plasma samples were collected from healthy donors and spiked with purified prothrombin to achieve prothrombin levels more than 100% of normal. Clotting was initiated by recalcifying the plasma and exposing the samples to tissue factor–bearing monocytes. Mass-to-length ratios were approximated by calculating the change in absorbance during fibrin clot formation and then normalized, such that 100% of plasma levels of prothrombin were set equal to 1. Note that the y-axis does not begin at 0. Data shown are representative of measurements on 5 separate donors.
Characterization of fibrin clot structure by TEM
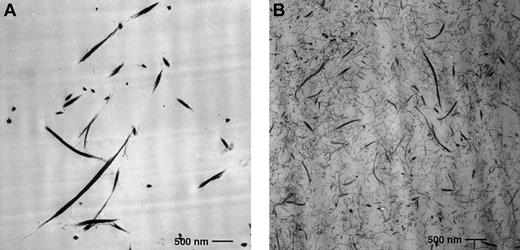
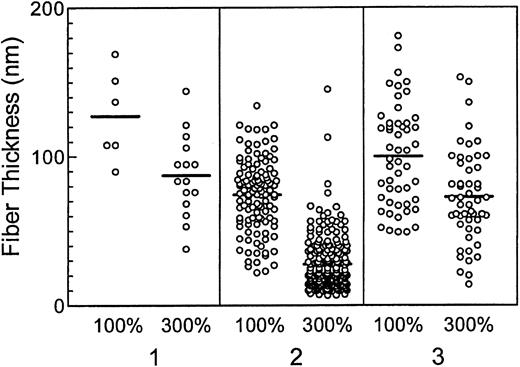
TEM was used to further evaluate differences in the fibrin thickness between clots formed in the presence of different prothrombin levels in the model system (Figure 5). The absolute diameters of fibrin fibers measured in separate experiments varied (Figure 6), likely due to differences in the procoagulant potential of different donors' platelets. However, the pattern demonstrating formation of thinner fibrin fibers in the presence of 300% prothrombin was consistent (Figure 6), and absolutely supported results from optical mass-to-length ratio analysis of the fibrin clots. An inverse, linear, dose-dependent trend in fiber diameter was observed for all concentrations of prothrombin tested (10%, 100%, 150%, 300% prothrombin; P < .0263). Clots formed in the presence of 300% prothrombin were consistently composed of thinner fibers than clots formed in the presence of normal prothrombin levels (P < .0215).
Fibrin fibers in clots formed in the presence of elevated prothrombin levels are thinner and more densely packed than fibers from normal prothrombin levels.
Transmission electron micrograph of fibrin gel network from clots formed in the presence of 100% (A) and 300% (B) plasma prothrombin levels. Fibrin fibers were thicker and less dense in the presence of 100% prothrombin (A) and thinner and more densely packed in the presence of 300% prothrombin (B). Clots were formed in microtiter wells and fixed as described in “Materials and methods.” The fibrinogen concentration was 2 mg/mL. Original magnification × 10 000; bar 0.5 μm.
Fibers in fibrin clots formed in the presence of elevated prothrombin are thinner than fibers formed in the presence of normal prothrombin levels.
Fibrin fibers in transmission electron micrographs of fibrin gel networks from clots formed in the presence of 100% and 300% plasma prothrombin levels were measured as described in “Materials and methods.” Three separate donors are depicted (1, 2, and 3). Differences in the mean thickness of fibrin fibers (horizontal lines for each data set) formed in the presence of 100% prothrombin illustrate the platelet donor-dependent differences observed in the assays.32 33 However, clots formed in the presence of 300% prothrombin were consistently composed of thinner fibers than clots formed in the presence of normal prothrombin levels (P < .0215).
Discussion
We hypothesized that elevated levels of prothrombin contribute to an individual's risk of thrombosis by altering the structure of fibrin clots that are formed. Our hypothesis was based on 2 observations: (1) elevated prothrombin increases the rate, peak, and total amount of thrombin generated in vitro, and (2) when added exogenously, high thrombin concentrations produce clots with small fibrin fiber mass-to-length ratios in vitro. Results using both reconstituted (model) and standard plasma systems support our hypothesis; concentrations of prothrombin more than 100% of plasma levels result in clots with significantly reduced fiber mass-to-length ratios (thinner fibrin fibers).
Previous studies of fibrinogen and clot structure have correlated abnormal clot structure with an increased risk of thrombosis. Patients with some dysfibrinogenemias form abnormally structured clots and have an increased risk for thrombosis, bleeding, or sometimes both.38 These patients form fibrin clots that are “thin, highly branched … and displaying very small, interstitial pores,”39(p2465),40 similar to those observed in our assays with elevated prothrombin levels. Further, patients with multiple myeloma have been shown to form clots with abnormally thin fibrin fibers, and these patients also have an increased risk of thrombosis.41
Several possible mechanisms could explain the relationship of the abnormal clot structure and increased thrombosis. First, many previous in vitro studies have demonstrated that tightly packed clots with thin fibrin fibers have an increased resistance to fibrinolysis.14,15,39,42-45 Therefore, abnormal clots from dysfibrinogenemic patients and patients with multiple myeloma are similarly believed to have an increased resistance to fibrinolysis in vivo, which is thought to be the mechanism of their thrombotic tendency.39,40,46 A similar situation could arise in patients with elevated prothrombin levels, whereby the formation of tightly packed clots composed of thin fibrin fibers leads to abnormal clot lysis. Alternately, or perhaps in addition, it has been shown that clots with altered fibrin structure exhibit altered thrombin-binding characteristics; clots composed of thinner fibrin fibers have fewer thrombin-binding sites and a higher Kdfor thrombin than clots with thicker fibrin fibers.47 The result of these differences is that clots with thinner fibrin fibers might bind less thrombin at the wound site than “normal” clots. It is difficult to say, however, what the physiologic impact of altered thrombin binding is, because both clot-bound thrombin48-50as well as decreased binding of thrombin to clots51 52have been correlated with procoagulant activity and thrombosis. Nonetheless, these observations suggest that there is an “optimum thrombin concentration” that forms an “optimum clot structure,” and that deviation from this optimum structure can result in dysregulation of hemostasis and recurrent thrombosis.
Our results show that at elevated prothrombin concentrations, increased initial rates of thrombin generation produce clots composed of thinner fibrin fibers than do lower initial thrombin generation rates. However, a significant amount of thrombin is produced subsequent to fibrin clot formation. This “later-phase” thrombin likely functions in a different capacity and might have other consequences that also predispose an individual to thrombosis. In vivo, thrombin participates in both procoagulant and anticoagulant pathways. In addition to cleaving fibrinogen, thrombin also activates factor XIII and TAFI and attenuates additional thrombin generation by activating protein C and inactivating factors Va and VIIIa.11 In fact, previous studies have demonstrated that increasing levels of prothrombin increase TAFI activation and subsequently, increase the clot's resistance to fibrinolysis.35 Increased activation of factor XIII, which cross-links fibrin polymers and stabilizes the formed clot, might result in a “hyperstabilized” clot and similarly increase a clot's resistance to fibrinolysis. Because the observed changes in clot structure occurred both in the presence (normal plasma) and absence (model plasma) of TAFI and factor XIII, the current study demonstrates an effect on clot structure that occurs in addition to, but independent of, these factors. In vivo, it is probable that all of these mechanisms can contribute to predisposing a person with elevated prothrombin to thrombosis.
The clinical phenotype of dysfibrinogenemic patients suggests that there is a specific “window” of clot structures in vivo in which the formed clot is neither too coarse, and therefore, deformable and prone to premature lysis, nor too fine, and therefore, excessively resistant to fibrinolysis.39,44 The current study and those of others39 44 suggest that there is also a specific “window” of thrombin concentrations that form a sufficiently hemostatic, but not prothrombotic, fibrin clot. Our results suggest that factors affecting the profile of thrombin generation during coagulation affect fibrin clot structure. These effects are likely important determinates of an individual's risk for thrombosis. It remains to be determined whether altered clot structure in vivo is responsible for the patient's thrombotic tendency. Examination of patient clots will provide further information about the relationship between elevated prothrombin, fibrin clot structure, and thrombosis.
The authors would like to thank and acknowledge the excellent technical assistance of Mr Walter Fennel and Ms Eve Whalin of the Durham Veterans Affairs Medical Center electron microscopy facility, and of Ms Rachel Kon and Ms Jennifer Carter. We also thank Dr Gary Koch and Ms Rebekkah Dann for their assistance with the statistical analysis.
Prepublished online as Blood First Edition Paper, December 27, 2002; DOI 10.1182/blood-2002-08-2527.
Supported by grants F32 HL09978 (A.S.W.) and RO1 HL48320 (D.M.M., H.R.R., M.H.) from the National Institutes of Health and 0160418U (A.S.W.) from the American Heart Association, and by the United States Department of Veteran's Affairs (M.H.).
The publication costs of this article were defrayed in part by page charge payment. Therefore, and solely to indicate this fact, this article is hereby marked “advertisement” in accordance with 18 U.S.C. section 1734.
References
Author notes
Maureane Hoffman, Durham VA Medical Center, 508 Fulton St, 113, Durham, NC 27705; e-mail:maureane@med.unc.edu.

This feature is available to Subscribers Only
Sign In or Create an Account Close Modal