Abstract
Although selection of hemoglobin C (HbC) by malaria has been speculated for decades, only recently have epidemiologic studies provided support for HbC protection against malaria in West Africa. A reduced risk of malaria associated with the homozygous CC state has been attributed to the inability of CC cells to support parasite multiplication in vitro. However, there have been conflicting data and conclusions regarding the ability of CC red cells to support parasite replication. Reports that parasites cannot multiply in CC cells in vitro contrast with detection of substantial parasite densities in CC patients with malaria. We have therefore investigated Plasmodium falciparum growth in CC cells in vitro. Our data show that the multiplication rate of several P falciparum lines is measurable in CC cells, but lower than that in AA (HbA-normal) cells. A high proportion of ring forms and trophozoites disintegrates within a subset of CC cells, an observation that accounts for the overall lower replication rate. In addition, knobs present on the surface of infected CC cells are fewer in number and morphologically aberrant when compared with those on AA cells. Events in malaria pathogenesis that involve remodeling of the erythrocyte surface and the display of parasite antigens may be affected by these knob abnormalities. Our data suggest that only a subset of CC cells supports normal parasite replication and that components of malaria protection associated with the CC state may affect the parasite's replication capacity and involve aberrant knob formation on CC cells.
Introduction
The geographic coincidence of hemoglobin (Hb) C (β6 Glu→Lys) and Plasmodium falciparum malaria in West Africa has been cited as evidence that this mutant allele was evolutionarily selected for its protection against life-threatening disease.1 Early studies found that parasite prevalence and density among healthy AA (HbA-normal) and AC (HbC-trait) subjects were equivalent.2-5 Subsequent work failed to associate HbC with malaria protection6,7 although one study demonstrated increased survival of AC subjects.5 Recently, however, 2 epidemiologic studies performed in Sahelian regions of West Africa demonstrated the malaria-protective effect of HbC.8,9 The first study, in the Dogon of Mali, showed that AC was associated with an approximately 80% reduced risk of severe malaria.8This finding and the presentation of 7 CC subjects with nonsevere malaria suggested that the homozygous CC state also protected against severe disease. The second study, in the Mossi of Burkina Faso, found that AC and CC were associated with about 30% and about 90% reduced risks of malaria (both nonsevere and severe).9
Attempts at defining the mechanism by which HbC protects against malaria have relied on in vitro culture of P falciparum in HbC-containing red blood cells (RBCs). Although parasites replicate in AA and AC cells equally well in vitro10(R.M.F., unpublished observations, 2002), their replication in CC cells is relatively inhibited. Some investigators found P falciparum (strain FCR-3/FMG) unable to replicate in CC cells,10,11 whereas others achieved limited replication of the same parasite line.12,13 Pasvol and Wilson, for example, noted 50% growth inhibition but normal parasite development in CC cells.12 Dei-Cas et al likewise reported 31% to 57% growth inhibition in CC cells.13 Furthermore, these investigators observed that the ultrastructure of P falciparum in CC cells was normal. The mechanism of growth inhibition has only been addressed in one study, which found that infected CC cells were more resistant to osmotic lysis and proposed a mechanism whereby schizont-infected CC cells were unable to burst and release merozoites.11
CC individuals have mild chronic hemolytic anemia with frequent splenomegaly and abnormal blood smears containing microspherocytes and target cells.14 A pathogenetic correlate of these findings is the increased mean corpuscular hemoglobin concentration (MCHC) of CC cells, which leads to intracellular crystallization of HbC.15-17 Although AC individuals do not show these changes, both AC and CC cells are significantly more rigid than their AA counterparts.15,18 Because AC and CC cells can support high parasitemias in vivo,8 the malaria protective mechanism of HbC may involve elements of both perturbed RBC physiology and nonsterile immunity.
Here we describe studies of P falciparum development in CC cells. In contrast to previous work that reported no in vitro propagation,10 11 we have observed multiplication of several P falciparum lines in CC cells. We also show thatP falciparum lines develop normally in one subset of CC cells while undergoing a lethal degradation process in another. Electron microscopic images suggest that the infected RBC surface may be remodeled differently in AA and CC cells. We discuss the significance of these findings and their potential contribution to the malaria-protective effects of HbC.
Materials and methods
CC RBCs
Heparinized blood from 2 unrelated CC donors and a series of AA donors was washed 3 times with RPMI 1640 and the RBCs were stored at 50% hematocrit in RPMI 1640 for up to 3 weeks at 4°C prior to use. Typically, CC RBCs were used in culture experiments within several hours of the blood draw, whereas AA cells were stored at 4°C for 12 to 36 hours prior to use. Hb genotypes were determined by cellulose acetate and citrate agar electrophoresis and confirmed by high-performance liquid chromatography (HPLC) analysis. CC RBCs tested negative for glucose-6-phosphate dehydrogenase (G6PD) deficiency as determined by commercially available reagents (Sigma, St Louis, MO). Blood collection was performed under protocols approved by the Institutional Review Board of the National Institute of Allergy and Infectious Diseases.
In vitro parasite culture
Established P falciparum lines (7G8, FMG/FCR-3, TM284, GB4, ITG, 3D7, Indochina, and FCB) were maintained in O+ human RBCs collected from healthy blood bank donors. Parasites were cultured in settled RBCs at 5% hematocrit in complete medium (RPMI 1640 supplemented with 25 mg/mL HEPES [N-2-hydroxyethylpiperazine-N′-2-ethanesulfonic acid], 2 mg/mL sodium bicarbonate, 50 μg/mL gentamicin, 10% vol/vol heat-inactivated human O+ serum). In some experiments, Albumax II (0.5% wt/vol; Gibco-BRL, Grand Island, NY) was used instead of human serum. The GB4 parasite line was cloned from the Ghana III line, a kind gift from W. E. Collins (Centers for Disease Control and Prevention, Atlanta, GA). All other parasite lines are available from the Malaria Research Reference Reagent Resource (MR4; Manassas, VA).
P falciparum growth experiments
Parasite lines cultured in AA cells were enriched to 95% to 99% mature forms by the Percoll-sorbitol method or to approximately 50% by gelatin flotation.19 Infected AA cells were then added to uninfected AA or CC cells in culture so that the initial parasitemia was 0.1%. Parasites were maintained at 37°C in an atmosphere of 5% CO2, 5% O2, and 90% N2. To test the effect of oxygen, parasites were maintained in 5% CO2 in a standard tissue culture incubator (20% O2 atmosphere). Culture media were changed daily and parasite counts were determined by examination of Giemsa-stained blood smears. Parasitemias (mean ± SD) were calculated from triplicate counts of 1000 RBCs. In all experiments, AA and CC cells were inoculated with the same parasite stock and cultures were performed simultaneously.
Electron microscopy
After 4 days of culture in either AA or CC cells, parasites were processed for electron microscopy. Infected RBCs were fixed with 2.5% glutaraldehyde in 0.05 M phosphate buffer, pH 7.4, containing 4% sucrose for 2 hours and then postfixed in 1% osmium tetroxide for 1 hour. After a 30-minute en bloc stain with 1% aqueous uranyl acetate, the cells were dehydrated in ascending concentrations of ethanol and embedded in Epon 812. Ultrathin sections were stained with 2% uranyl acetate in 50% methanol and lead citrate20 and then examined in a Zeiss CEM902 electron microscope (Oberkochen, Germany).
Immunoblotting
Parasite line FMG/FCR-3 was cultured simultaneously in either AA or CC cells to 1.5% parasitemia. Infected RBCs were lysed in 0.01% saponin in RPMI 1640 at 4°C for 10 minutes. Erythrocyte membrane and parasite proteins were resolved by sodium dodecyl sulfate–polyacrylamide gel electrophoresis (SDS-PAGE; 4%-12% gradient), transferred to polyvinylidine difluoride membranes (Immobilon P; Millipore, Bedford, MA) and probed with either monoclonal antibody 89 (mAb89; 1:1250 ascites21) specific for knob-associated histidine-rich protein (KAHRP) or affinity-purified rabbit antiserum (1:125022) specific for P falciparum chloroquine-resistance transporter (PfCRT). Bound antibodies were detected using horseradish peroxidase (HRP)–conjugated secondary antibodies and a chemiluminescence detection system (Pierce, Rockford, IL). The relative amounts of KAHRP and PfCRT from AA and CC cell cultures were measured densitometrically and analyzed using Scion Image software (Scion, Frederick, MD).
Results
Different P falciparum multiplication rates in AA and CC cells
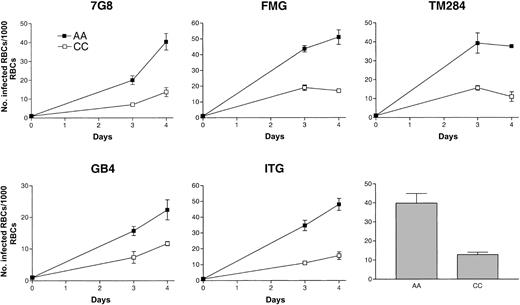
Under standard growth conditions, in vitro propagation of several parasite lines was readily achieved in CC cells. Multiplication rates were lower in CC than in AA cells (Figure1). In a set of 5 representative growth experiments, the ratio of mean parasite densities in AA versus CC cells after 4 days (2 cycles) of culture was about 3:1. These observations were confirmed repeatedly using 8 different parasite lines (7G8, FMG, TM284, GB4, ITG, 3D7, Indochina, and FCB).
Growth of
P falciparum in AA and CC cells. Parasite lines were cultured for 4 days (2 cycles) in either AA (▪) or CC (■) cells. Initial parasitemias were 0.1%. Parasite densities were counted after 3 and 4 days of culture. Mean parasitemias (± SD) achieved by this set of 5 parasite lines after 4 days of culture in either AA or CC cells are compared in the bar graph and are representative of 10 separate culture experiments.
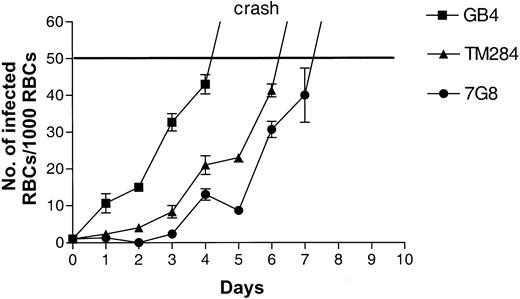
Parasites cultured in vitro eventually reach a limiting parasitemia, become unhealthy, and die. The cause for this phenomenon is unclear but may be related to the sensitivity of the parasites to the effects of media depletion or metabolic product accumulation in culture. The density at which this process occurs in AA cells can vary with parasite lines and experimental conditions but in our system is usually 8% to 12% parasitemia. To determine the upper parasitemia limit in CC cells, we continued to observe cultures after 4 days. On days 5 and 6 of such experiments, parasites in CC cells reached maximum densities of 4% to 5% and then began to die (“crash”; Figure2). We were unable to culture parasites in CC cells at densities greater than 6%. These findings were confirmed for 5 parasite lines (3D7, Indochina, GB4, 7G8, and TM284). Dying parasites in CC cultures were characterized by condensed cytoplasm and pyknotic nuclei. In AA cells, the morphologic appearance of dying parasites at the 8% to 12% limit was similar.
Growth of
P falciparum in CC cells. Parasite lines were cultured for 4 to 6 days (2-3 cycles) in CC cells. Initial parasitemias were 0.1%. Parasite densities were counted daily. At 5% parasitemia, all cultures “crashed” as evidenced by a large number of parasite forms with condensed cytoplasm and pyknotic nuclei.
We were able to establish long-term cultures in CC cells as long as parasite densities were below crash levels (2%-3%). These cultures were maintained by the daily addition of fresh media and the twice-weekly addition of CC RBCs. Using this approach, we were able to maintain viable cultures of P falciparum (3D7 and Indochina) continuously beyond 3 weeks.
Frequent spontaneous degradation of P falciparum in subpopulations of CC cells underlies the lower parasite multiplication rate
To explore the basis for lower parasite multiplication rates in CC cells, we examined the ability of 5 parasite lines (3D7, Indochina, GB4, 7G8, and FCB) to invade and develop in CC cells. Trophozoite- and schizont-infected AA cells were separated in Percoll-sorbitol gradients (95%-99% parasitemia) and then added to either CC or AA cells. After allowing 18 hours for schizont rupture and merozoite invasion, we compared the number of ring forms in CC and AA cells. Parasite invasion of CC cells was 0.93 ± 0.31 that of AA cells (17 invasion assays; Table 1). Based on these data, reduced invasion of CC cells could not account for the dramatic reduction in parasite multiplication rates.
P falciparum invasion of AA and CC cells
| P falciparumline . | No. of ring-infected RBCs/1000 RBCs . | Ratio . | |
|---|---|---|---|
| AA | CC | CC/AA | |
| 3D7 | 19 | 24 | 1.26 |
| 3D7 | 14 | 22 | 1.57 |
| 3D7 | 8 | 5 | 0.63 |
| 3D7 | 10 | 9 | 0.90 |
| 3D7 | 19 | 10 | 0.53 |
| 3D7 | 10 | 11 | 1.10 |
| 3D7 | 17 | 12 | 0.70 |
| 3D7 | 30 | 32 | 1.07 |
| Indochina | 44 | 24 | 0.54 |
| Indochina | 10 | 8 | 0.80 |
| GB4 | 10 | 7 | 0.70 |
| GB4 | 12 | 14 | 1.17 |
| GB4 | 8 | 6 | 0.75 |
| 7G8 | 8 | 8 | 1.00 |
| 7G8 | 4 | 6 | 1.50 |
| 7G8 | 8 | 4 | 0.50 |
| FCB | 24 | 26 | 1.08 |
Trophozoite- and schizont-infected AA cells were added simultaneously to AA or CC cells. After allowing 18 hours for schizont rupture, merozoite invasion of new RBCs and maturation to the ring stage, blood smears were examined. The number of ring-infected RBCs per 1000 RBCs in duplicate samples was counted and averaged. The ratio of ring-infected CC to AA cells is shown; the average ratio ± SD was 0.93 ± 0.31.
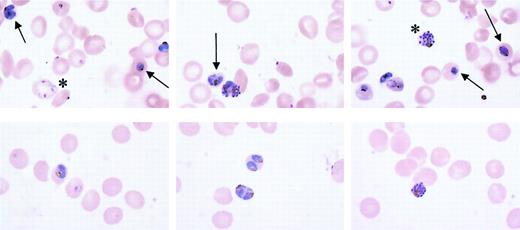
Microscopic examination of maturing parasites, however, provided a possible explanation for lower multiplication rates in CC cells. The appearance of parasite clone GB4 in AA and CC cells was representative of 8 parasite lines tested. Blood smears routinely showed approximately 50% healthy forms in CC cells, whereas the remaining 50% appeared unhealthy (Figure 3). Fragmentation of late rings and blurring of trophozoites and schizonts, suggesting the loss of compartmentalized boundaries, characterized the unhealthy forms. Approximately half of the parasite population showed evidence of deterioration with each new replication cycle, even when parasites were maintained continuously in CC cells for 3 weeks. By light microscopy, there were no obvious differences between CC cells that did and did not support healthy parasite development.
Morphologic appearance of
P falciparum in CC and AA cells. Parasite clone GB4 was cultured for 4 days in either AA or CC cells, stained with Giemsa, and observed by light microscopy (× 1000). Although healthy forms (asterisks) were noted in CC cells, typically half of all parasites appeared to be unhealthy, as indicated by fragmentation of ring forms and blurring of trophozoites and schizonts (top panels arrows). The healthy condition of parasites in AA cells is shown for comparison (bottom panels).
The observation that 50% of parasites showed evidence of deterioration in each replication cycle was consistent with lower parasite multiplication rates in CC cells. We observed deteriorating parasites at both the ring and trophozoite stages of maturation. There was no accumulation of particular forms, indicating that P falciparum development in CC cells was not blocked at a specific stage of the asexual life cycle. The healthy parasite forms appeared completely normal in their maturation through the schizont stage and production of new ring-infected RBCs.
Parasite multiplication rates in AA and CC cells do not differ significantly in 5% and 20% O2 atmospheres
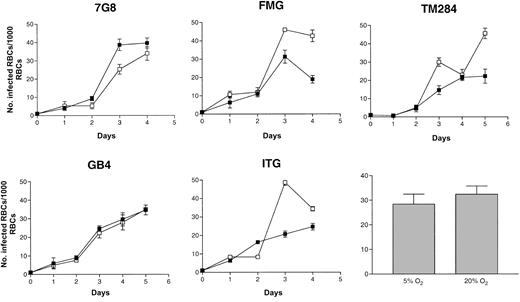
Hb aggregates and crystals have been reported to form in CC but not AA cells treated with hypertonic saline, a process facilitated by the relatively high MCHC of CC cells.15-17 Decreased solubility of HbC that occurs on deoxygenation may contribute to this aggregation.16 23 To explore whether the presence of increased amounts of oxygen in the culture atmosphere would enhance parasite multiplication rates in CC cells, we repeated growth experiments with parasites able to grow in gas atmospheres containing 20% O2. No significant difference was found in the ability of these parasite lines to multiply in CC cells in 5% or 20% O2 (Figure 4).
Growth of
P falciparum in oxygenated CC cells. Parasite lines were cultured for 4 days (2 cycles) in CC cells under atmospheres of either 5% (▪) or 20% O2 (■). Initial parasitemias were 0.1%. Parasite densities were counted daily. Mean parasitemias (± SD) achieved by this set of 5 parasite lines after 4 days in culture in different O2 atmospheres are compared in the bar graph and are representative of 4 separate experiments.
Loss of subcellular compartmentalization accompanies parasite death in CC cells
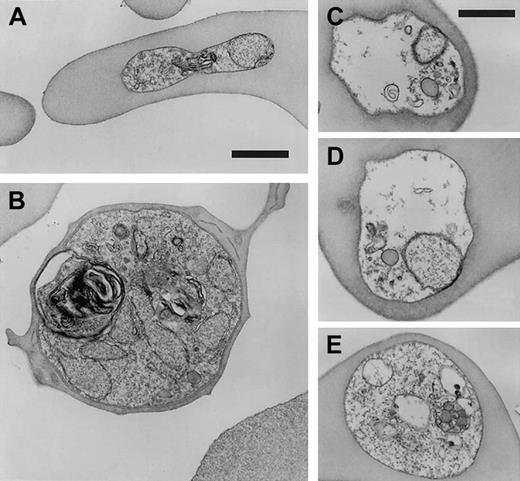
To further characterize the process of parasite deterioration in CC cells, we compared the morphologic detail of infected CC and AA RBCs by electron microscopy. In agreement with light microscopy observations, approximately half of the parasites appeared to be following a healthy path from rings (Figure5A) to schizonts (Figure 5B), whereas the remaining parasites appeared to be disintegrating within intact RBCs. This disintegration was characterized by vacuolization, parasite membrane dissolution, and organelle destruction (Figure 5C-E). Disintegrated parasites were found in ring stages as well as more mature trophozoite forms. Table 2summarizes the results of 1795 observations made from 7 differentP falciparum lines in CC cells and AA cells. The average proportion of disintegrating parasites in CC cells was 46.8% ± 7.3% (mean ± SD, n = 1163), whereas only 0.57% ± 0.73% (n = 632) of parasites were found disintegrating in AA cells. The fraction (range, 36%-54%) and appearance of these disintegrating forms were similar in CC cells obtained from 2 unrelated donors.
Ultrastructure of
P falciparum in CC cells. Parasite clone GB4 was cultured for 4 days in CC cells and then observed by electron microscopy. Healthy forms (ring, A; schizont, B) and degraded forms (C-E) are shown for comparison. Parasite death is associated with disintegration of parasite membranes, organelles, and nuclei, as well as the absence of knobs. Bars represent 1 μm.
P falciparum degradation in CC cells
| Parasite line . | No. of degraded forms (%) . | No. of knobs/infected RBC, mean ± SD . | ||
|---|---|---|---|---|
| AA | CC | AA | CC | |
| 3D7 | 0/98 (0) | 52/99 (52) | ND | ND |
| Indochina | 1/64 (1.6) | 48/100 (48) | ND | ND |
| GB4 | 1/72 (1.4) | 63/112 (56) | ND | ND |
| ITG | 0/78 (0) | 46/108 (43) | 14.9 ± 2.7 | 5.1 ± 4.0 |
| 7G8 | 1/105 (1.0) | 97/206 (47) | 14.4 ± 7.1 | 3.9 ± 2.1 |
| TM284 | ND | 74/195 (38) | ND | 7.4 ± 6.2 |
| FMG | 0/105 (0) | 53/145 (36) | 28.8 ± 9.2 | 7.2 ± 2.9 |
| GB4 | 0/110 (0) | 108/198 (54) | 32.2 ± 8.7 | 17.4 ± 7.6 |
| Average | 0.57 ± 0.73 | 46.8 ± 7.3 | 22.6 ± 9.2 | 8.2 ± 5.3 |
Parasite lines were cultured simultaneously in either AA or CC RBCs (2 donors) for 4 days. The number of healthy and degraded forms (rings, trophozoites) was then determined by electron microscopy. For each parasite culture in AA or CC cells, the number of knobs present on cross-sections of 9 trophozoite-infected RBCs was counted.
ND indicates not determined.
The quantity and morphology of knobs differ between parasite-infected AA and CC cells
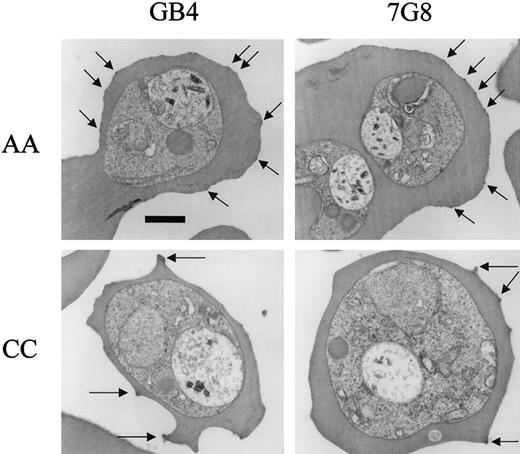
Our observations by electron microscopy also detected differences in the electron dense protrusions (“knobs”) on the surface of RBCs infected with P falciparum. These knobs mediate cellular interactions important in the cytoadherence and sequestration of parasites.24 Our counts indicated statistically fewer knobs on CC versus AA cells for each of 5 knob-positive parasite lines (Figure 6; Table 2). Averaged over cross-sections of similar size, the number of knobs on AA cells was 22.6 ± 9.2 (mean ± SD, n = 36) and on CC cells, 8.2 ± 5.3 (n = 41; Mann-Whitney test, P < .0001). Knobs on CC cells from both unrelated donors appeared to be larger and more protuberant than those on AA cells (Figure 6).
Electron micrographs of
P falciparum knobs in AA and CC cells. Parasites were cultured for 4 days in AA or CC cells and trophozoite-infected cells observed by electron microscopy. Knobs (arrows) were fewer in number and more protuberant on CC than on AA cells. Bar represents 1 μm.
Electron micrographs of
P falciparum knobs in AA and CC cells. Parasites were cultured for 4 days in AA or CC cells and trophozoite-infected cells observed by electron microscopy. Knobs (arrows) were fewer in number and more protuberant on CC than on AA cells. Bar represents 1 μm.
The amounts of a knob-associated protein in AA and CC cells do not differ significantly
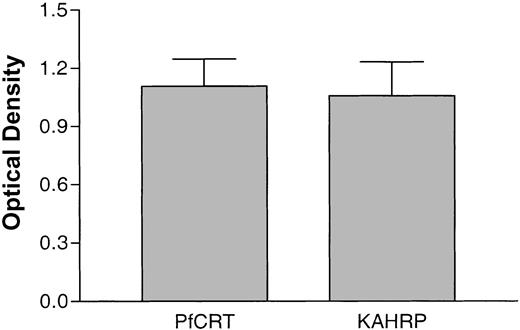
To test whether altered knob morphology in CC cells was associated with reduced expression of knob-associated parasite proteins, we performed semiquantitative immunoblot analyses. PfCRT is a protein localized to the parasite digestive vacuolar membrane and is not present in knobs. To control for loading variations, the amounts of protein extracts were adjusted so that the PfCRT signal in CC versus AA cells was approximately 1.0 (Figure 7). These normalized loadings were then analyzed for amount of KAHRP, a knob-associated parasite protein. Data from 5 separate immunoblots showed that the relative amounts of KAHRP in CC versus AA cells were not significantly different (Figure 7; optical density ratio 1.05 ± 0.39).
Relative amounts of parasite proteins in CC and AA cells.
The amounts of PfCRT (a parasite protein confined to the digestive vacuolar membrane) and KAHRP (a parasite protein located within knobs on the erythrocyte membrane) were estimated by immunoblot analysis and densitometry. After normalization of PfCRT signal in CC and AA cells to approximately 1.0 (1.11 ± 0.31, mean ± SD), the relative amounts of KAHRP were determined to be 1.05 ± 0.39. The data were calculated from 5 separate immunoblots.
Discussion
Multiple factors influence the occasional progression of malaria into severe and fatal complications.25 High P falciparum densities are associated with severe malaria and the rapidity with which parasites multiply in the bloodstream is also thought to increase the risk of progression to severe disease.26,27 Chotivanich et al have shown thatP falciparum isolates causing severe malaria were less selective in their invasion of new RBCs and therefore multiplied at higher rates than those causing uncomplicated disease.28Reduced parasite invasion of HbAE RBCs has also been reported to decrease the parasite burdens associated with severe malaria,29 which may mediate protection conferred by HbE.30 The reduced multiplication rate of P falciparum in CC cells may be responsible for a comparable mechanism of protection against severe malaria, but by an alternative mechanism that affects the maturation and viability of parasites in RBCs.
Parasite multiplication rates are determined by the efficiency of RBC invasion, the ability of parasites to complete their normal development in the RBC, and the successful release of mature merozoites from the RBC. Various host cell conditions may affect some of these processes.31-37 Evidence from the present study suggests that abnormal intraerythrocytic development affects parasite multiplication in CC cells. Parasites invaded AA and CC cells to a similar extent and we did not observe an accumulation of schizonts that would have indicated a block in merozoite release. Instead, a substantial number of parasites in CC cells disintegrated within intact RBCs. Parasite death was found at all stages of maturation and was independent of parasite line or CC cell donor. These findings accounted for the lower rates of parasite multiplication in CC cells versus AA cells.
To explore the mechanism of death, we examined parasites in CC cells by electron microscopy. Whereas approximately half of parasites in CC cells showed normal morphology, the remaining half showed evidence of disintegration within intact CC RBCs. These findings were in agreement with those from light microscopy. Images were suggestive of widespread damage to parasite membranes. Because healthy and dying parasites were observed alongside one another in CC cell cultures, it seems unlikely that the disintegration process was due directly to the HbC molecule itself. Instead, the health of intraerythrocytic parasites may have been affected by different conditions within subsets of CC cells.
HbC is less soluble than HbA, especially when deoxygenated,16,23 and spontaneous crystallization is observed in vivo as well as in vitro when CC cells are osmotically dehydrated.15-17 Intracellular aggregation of HbC occurs on deoxygenation even when no crystal formation is detected by morphologic methods.16 We therefore conducted growth experiments in atmospheres containing 20% (atmospheric) and 5% O2 (with parasites able to grow under these conditions) to determine whether there was a relative growth inhibition in 5% O2. This increase of oxygen concentration, however, failed to improve the growth of parasites in CC cells.
In vivo, subsets of CC cells exist that differ in age, MCHC, mean corpuscular volume, viscosity, and membrane filterability.15 These subsets include predominantly target cells and microspherocytes, in part because cells containing intracellular crystals are removed from the spleen.15-17CC cells that have a higher MCHC than AA cells have increased rigidity and consequent hemolytic damage in the microvasculature.15,16 A “precrystalline” state of intracellular HbC, in which crystallization does not occur even though the MCHC exceeds the solubility of HbC in hemolysates,15may also contribute to increased rigidity of CC cells. The subsets of CC cells that we have observed not to support parasite development in vitro may include fractions that have sustained damage from these effects.
In addition to contributing to lower parasite multiplication rates, the effects of the CC cell on its remodeling by the intraerythrocytic parasite may contribute to malaria protection. These effects may include altered structure and function of the knobs created by the parasite at the RBC surface. Our results with 5 different parasite lines showed that knobs were fewer in number and more protuberant on CC than on AA cells. The relative amounts of KAHRP, a principal knob-associated protein, were found not to differ significantly between AA and CC cells, consistent with larger deposits over fewer knobs in CC cells. The antigenically variant cytoadherence molecule PfEMP-1 (P falciparum erythrocyte membrane protein–1) is a principal target for agglutinating antibodies that correlate with malaria protection.38-40 Display of this molecule (which is anchored by KAHRP) is likely to be affected by alterations of knobs, with possible impacts on cytoadherence functions and immune responses that have important roles in the pathogenesis of severe malaria (for a review, see Miller et al41).
These results provide possible explanations for previous in vivo and in vitro observations that have been difficult to reconcile. Although investigators were initially unable to culture P falciparum(line FCR-3/FMG) in CC cells,10,11 other investigators were able to achieve limited growth.12,13 Our observations with several lines of P falciparum suggest these different findings may be at least partly due to the fact that parasites replicate in some subsets of CC cells but not in others. The relative proportions of CC cell subsets in an individual may reduce parasite multiplication in vivo to varying degrees and may help to explain why some CC individuals have been found with high parasitemias.8 Other factors involved in malaria protection may include altered knob formation at the surface of host CC cells, with consequent effects on surface antigen display and cytoadherence. Disease outcome accordingly will depend on the relative contribution of the factors that determine parasite multiplication rate, intrinsic parasite virulence, and host immunity in different CC individuals.
The authors wish to thank our CC blood donors and Dr James F. Casella, Natalie Murray, and Melissa Law for their efforts in support of this work.
Prepublished online as Blood First Edition Paper, December 12, 2002; DOI 10.1182/ blood-2002-10-3105.
H.F. was supported by the United States Agency for International Development (no. DPE-936-6001-29) and a grant from Merck Research Laboratories.
The publication costs of this article were defrayed in part by page charge payment. Therefore, and solely to indicate this fact, this article is hereby marked “advertisement” in accordance with 18 U.S.C. section 1734.
References
Author notes
Thomas E. Wellems, Laboratory of Malaria and Vector Research, NIAID/National Institutes of Health, Bldg 4, Rm 126, 4 Center Dr, Bethesda, MD 20892; e-mail:tew@helix.nih.gov.

This feature is available to Subscribers Only
Sign In or Create an Account Close Modal