Current initiatives to reduce the high prevalence of nutritional iron deficiency have highlighted the need for reliable epidemiologic methods to assess iron status. The present report describes a method for estimating body iron based on the ratio of the serum transferrin receptor to serum ferritin. Analysis showed a single normal distribution of body iron stores in US men aged 20 to 65 years (mean ± 1 SD, 9.82 ± 2.82 mg/kg). A single normal distribution was also observed in pregnant Jamaican women (mean ± 1 SD, 0.09 ± 4.48 mg/kg). Distribution analysis in US women aged 20 to 45 years indicated 2 populations; 93% of women had body iron stores averaging 5.5 ± 3.35 mg/kg (mean ± 1 SD), whereas the remaining 7% of women had a mean tissue iron deficit of 3.87 ± 3.23 mg/kg. Calculations of body iron in trials of iron supplementation in Jamaica and iron fortification in Vietnam demonstrated that the method can be used to calculate absorption of the added iron. Quantitative estimates of body iron greatly enhance the evaluation of iron status and the sensitivity of iron intervention trials in populations in which inflammation is uncommon or has been excluded by laboratory screening. The method is useful clinically for monitoring iron status in those who are highly susceptible to iron deficiency.
Introduction
Heightened awareness in recent years of the adverse consequences of iron deficiency has prompted renewed efforts to reduce the prevalence of this common micronutrient insufficiency. One of the main reasons for the limited success of programs to combat iron deficiency is the continuing uncertainty about the optimal epidemiologic approach for identifying it and for measuring its severity. The inadequacy of anemia surveys is reflected in the wide-ranging estimates by various expert committees of the global prevalence of iron deficiency. In a 1985 World Health Organization (WHO) report, it was estimated that 15% to 20% of the world's population had iron deficiency anemia.1Despite the lack of new prevalence data, estimates of the global prevalence of iron deficiency anemia have increased to more than two thirds of the world population.2 More reliable methods to assess iron status are needed to determine the prevalence of iron deficiency and the impact of iron supplementation and fortification trials.
In the present article, a new method is described for assessing iron status based on the quantitative measurement of body iron. The method has been used to examine the iron status in a consensus sample of adult men and women in the United States and of pregnant women in Jamaica. The usefulness of the method has been further evaluated by measuring the absorption of added iron in a supplementation trial in pregnant women and a food fortification trial in anemic women.
Materials and methods
Estimation of body iron
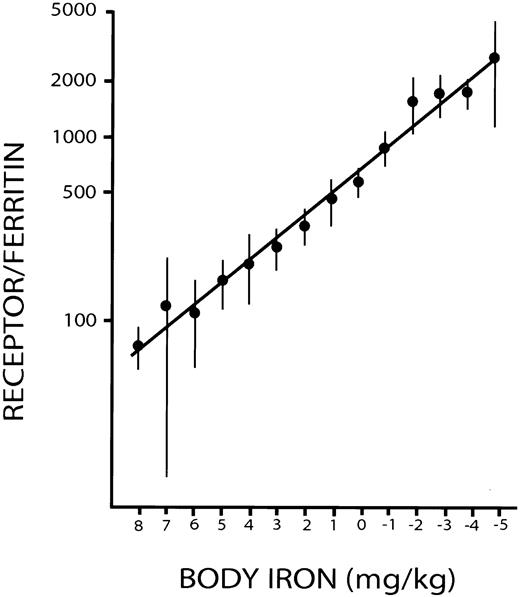
Measurements of body iron were based on a prior study in which serial measurements of serum ferritin and serum transferrin receptor (sTfR) were obtained during repeated phlebotomies in 14 healthy control subjects.3 Phlebotomy was discontinued when the baseline hemoglobin concentration in each subject had fallen by 20 g/L and remained so for 3 weeks without further bleeding. The amount of storage iron at baseline was calculated from the amount of hemoglobin iron removed to reduce the serum ferritin concentration to less than 12 μg/L. Body iron was then calculated from the hemoglobin iron removed at each bleeding after correction for the absorption of dietary iron. A close linear relationship was demonstrated between the logarithm of the concentrations in micrograms per liter, of serum transferrin receptor/serum ferritin (R/F ratio), and of body iron expressed as milligram per kilogram body weight (Figure1). The latter is expressed as the iron surplus in stores (positive value) or the iron deficit in tissues (negative value). Body iron was calculated from the R/F ratio as follows: body iron (mg/kg) = −[log(R/F ratio) − 2.8229]/0.1207.
Calibration of the ratio of serum transferrin receptor to serum ferritin with body iron.
Positive values represent storage iron, and negative values indicate tissue iron deficiency.3 Vertical bars represent ± 2 SEM. Reprinted from Skikne et al3 with permission.
Surveys
Data from 3 published studies were used to evaluate quantitative measurements of body iron. The largest data set was a convenience sample collected in the third National Health and Nutrition Examination Survey (NHANES III) in the US population from 1988 to 1994.4 The sample differed from the full NHANES III sample in that it was not selected to represent the US population. Nevertheless, it was considered to provide useful insight regarding the use of the R/F ratio for estimating body iron. A total of 2057 specimens obtained in male and female participants were used to evaluate the effect of age on body iron. Two subsets of NHANES III samples consisting of 409 women (20-45 years of age) and 649 men (20-65 years of age) were used to examine the frequency distribution of body iron in adult men and women. These age ranges were chosen to represent segments of the population with relatively uniform iron status.
The second study was performed in pregnant women living in Kingston, Jamaica, West Indies, who participated in a trial of iron supplementation.5 The selection criteria for participation in the study were maternal age of 16 to 35 years, gestational age of 14 to 22 weeks (mean, 135 days), and hemoglobin concentration between 80 and 110 g/L. After baseline specimens were obtained, the women were randomly assigned to 1 of 3 groups: a control group given no additional iron (n = 86), an FeSO4 group given a 50-mg FeSO4 tablet twice daily (n = 79), and a gastric delivery system (GDS) group given a single 50-mg iron GDS capsule daily (n = 83). Of the 376 women originally enrolled in the study, body iron estimated from the R/F ratio was examined in 248 in whom blood samples were available at baseline and after 6 and 12 weeks of study. Baseline specimens were used to evaluate the frequency distribution of body iron in pregnancy, and values at 6 weeks and 12 weeks were used to estimate iron absorption from the iron supplements.
The final set of data was obtained from specimens collected during a double-blind, randomized trial of iron fortification in anemic Vietnamese women.6 7 For 6 days each week, women were fed a meal containing noodles or rice and served with 10 mL fish sauce containing either no added iron (control) or 10 mg iron as NaFeEDTA (sodium iron ethylenediaminetetraacetic acid) (fortified). Blood samples were obtained at baseline and at 3 and 6 months later. Of the 136 women completing the study, the first 15 specimens received in our laboratory from the control and fortified groups were selected to assess the feasibility of using a reduced sample size to estimate absorption of fortification iron.
Measurement of serum ferritin and sTfR
Enzyme-linked immunosorbent assays (ELISAs) were used to measure serum ferritin8 and sTfR9 levels, as previously described. Monoclonal antibodies were used in a 2-site assay for ferritin and sTfR to ensure uniformity of the immunologic reagents for all data reported here. Horseradish peroxidase was used as the enzyme conjugated to the indicator antibody in both assays. The purified antigen for each assay was carefully standardized to reduce variability between studies. The serum ferritin assay was standardized with recrystallized human liver ferritin that was diluted to 1000 μg/L in buffered bovine serum albumin (BSA) and stored in aliquots at −70°C. Fresh standard material was thawed at the beginning of each investigation and was calibrated against WHO International Standard 80-578, obtained from the National Institute for Biological Standards and Controls, United Kingdom.
The sTfR assay was standardized with transferrin-free receptor purified from human placenta by the method of Turkewitz et al.10Additional purification of the free receptor was accomplished by passage of the transferrin-free receptor through a 100 × 2.5-cm HR-300 gel filtration column (Pharmacia, Uppsala, Sweden). After the peak protein tubes, as measured by A280nm, were pooled and concentrated, the purity of the receptor was established on gel electrophoresis by demonstrating a single protein band at 190 000 Da without reduction and 95 000 Da after reduction with 2-mercaptoethanol. The protein concentration was measured by the Lowry assay.11 If a disparity greater than 5% was observed between protein content and immunologic activity in the ELISA for sTfR, the gel filtration step was repeated until less than 2% discrepancy was obtained. The purified transferrin receptor was stored at 4°C, conditions under which the purified receptor was shown in prior studies to be stable for a minimum of 18 months. Fresh human placental receptor was prepared at the beginning of each study and was stored for no longer than 1 year. The performance of all the serum ferritin and sTfR assays reported here was further evaluated by including a minimum of 3 quality control sera that had been stored in aliquots at −70°C. Assays were repeated if there was a disparity greater than 10%, in more than one control serum, from the mean of multiple determinations before freezing.
In the Jamaican and Vietnam surveys, in-house or field training was provided to standardize the methods for collection and temperature-controlled transport of venous blood specimens to a regional laboratory for processing on the day of collection. Blood was centrifuged, and 0.5-mL aliquots of plasma were placed in microfuge tubes for storage at −30°C until shipment on dry ice to Kansas University Medical Center. Frozen specimens received from the NHANES III study were stored at −30°C and assayed within 2 months of arrival.
Statistical analysis
Frequency distributions of body iron were initially examined by graphic analysis. In the NHANES III specimens from adult women, there was a deviation from a Gaussian distribution in the lower portion of frequency distribution of body iron. An analytical method for identifying a mixture of frequency distributions was used to characterize a second normal distribution.12 Mixed distribution analysis has been used in several prior studies to estimate the prevalence of iron deficiency and other forms of anemia in population studies.13-16 In the present study, an iterative technique termed the “expectation-maximization algorithm” was used, as described previously, to estimate the means and standard deviations of 2 normal distributions.17 The program DISFIT18 was used for this calculation, by which the likelihood ratio statistic determines the best-fitting model, and χ2 analysis is used to test the goodness-of-fit of the best-fitting model.
Results
Population studies
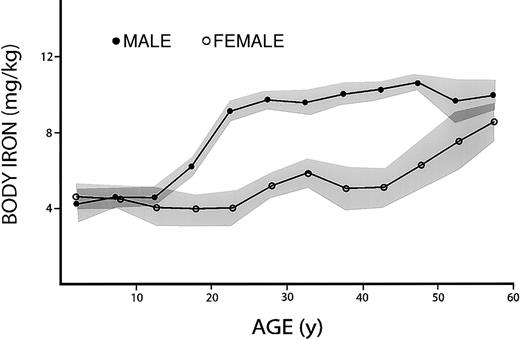
The relationship between age and body iron was first examined in the convenience sample of males and females participating in the sTfR pilot study for NHANES III (Figure2). Mean values in the 2 sexes were similar until late adolescence, when body iron in males increased abruptly to reach a plateau early in the third decade. This was followed by a slow, continued increase until the sixth decade, when body iron fell slightly. Because of the iron loss associated with menstruation and childbearing, there was no appreciable increase in body iron in women until the third decade. Body iron then remained relatively stable until the fifth decade, when it increased progressively, approaching values in men by the seventh decade. These findings are generally consistent with our knowledge of the effect of sex, growth, and menstruation on body iron.19
Effect of age on body iron.
All values for body iron are positive and indicate the amount of storage iron. Data are based on a convenience sample of 2057 specimens collected in NHANES III. Shaded areas represent the mean ± 1 SEM for each 5-year interval.
Effect of age on body iron.
All values for body iron are positive and indicate the amount of storage iron. Data are based on a convenience sample of 2057 specimens collected in NHANES III. Shaded areas represent the mean ± 1 SEM for each 5-year interval.
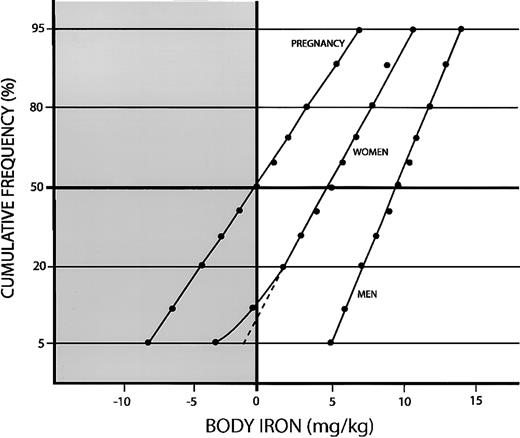
We next examined the frequency distributions of body iron in men and women separately. In 649 men between 20 and 65 years of age, the geometric mean ferritin concentration was 109 μg/L (± 1 SD; range, 66-285 μg/L), the mean sTfR concentration was 6.12 ± 2.73 mg/L, and the geometric mean R/F ratio was 42 (± 1 SD; range, 19-93). Body iron stores averaged 9.89 ± 2.82 mg/kg and were consistent with a single normal distribution (Figure3). In 409 women between 20 and 45 years of age, the geometric mean serum ferritin was 34 μg/L (± 1 SD; range, 12-94 μg/L), the mean sTfR concentration was 6.3 ± 2.57 mg/L, and the geometric mean R/F ratio was 172 (± 1 SD; range, 54-544). Body iron stores in the total sample averaged 4.87 ± 4.14 mg/kg. However, unlike the distribution in men, the frequency distribution deviated from linearity in the lower portion of the curve, indicating a minor population of women with iron deficiency. Mixed distribution analysis indicated 2 normally distributed populations. The main population, representing 92.7% of women, had mean iron stores of 5.5 ± 3.35 mg/kg (± 1 SD), whereas a second population of 7.3% had a mean deficit in tissue iron of −3.87 ± 3.23 mg/kg. The goodness-of-fit χ2 statistic of 3.31 was consistent with 2 separate distributions (df = 3; P = .34). The distribution of body iron values was relatively broad in both populations, resulting in considerable overlap. As a result, 5% of women in the major population had tissue iron deficiency and 12% of women in the minor population had iron stores. Of the 44 women in the total sample with tissue iron deficiency, 18 belonged to the major iron-replete population and 26 to the minor iron-deficient population.
Cumulative frequency distributions of body iron calculated from the ratio of the serum transferrin receptor to serum ferritin.
The clear area and positive values indicate storage iron, and the shaded area and negative values indicate tissue iron deficiency. Data are shown for pregnant Jamaican women aged 16-35 years, US women aged 20-45 years, and US men aged 20-65 years.
Baseline estimates of body iron are shown for 246 pregnant women between 16 and 35 years of age living in Kingston, Jamaica5 (Figure 3). All women were anemic, as defined by a hemoglobin concentration below 110 g/L. The geometric mean serum ferritin was 11 μg/L (± 1 SD; range, 4-32 μg/L), the mean sTfR was 7.87 ± 3.4 mg/L (± 1 SD), and the geometric mean R/F was 650 (± 1 SD; range, 187-2258). Body iron averaged only 0.085 ± 4.48 mg/kg, indicating that half the women had tissue iron deficiency. The goodness-of-fit χ2 statistic for body iron was 7.21 (df = 17; P = .98), indicating a single Gaussian distribution.
Intervention trials
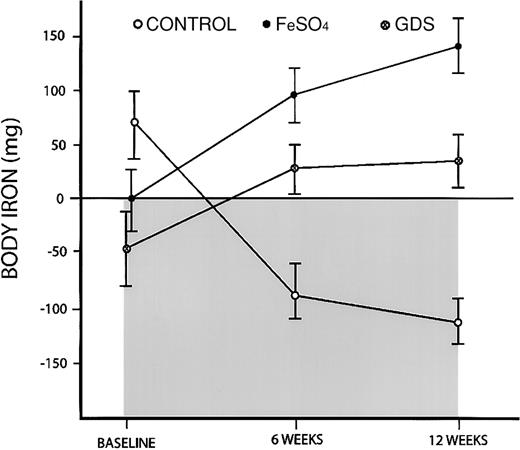
The advantages of using body iron measurements were apparent when a trial of iron supplementation in pregnant Jamaican women was re-examined. In the original publication, both groups of women given an iron supplement had a significant increase in hemoglobin concentration and a decline in sTfR compared with the control subjects.5However, there was no apparent difference between the FeSO4group given 100 mg iron daily and the GDS group given 50 mg iron daily. When body iron estimates were used, a difference between the iron groups was readily apparent (Figure4). More important, body iron measurements provided a measure of iron absorption. During the 3-month trial, the mean body iron count in the control group fell from 68 mg to −111 mg, or an overall decline of 179 mg. This average daily iron loss of 2 mg reflects the iron requirements of the fetus. Women in the FeSO4 group had increases in storage iron from an average of 0 to 141 mg iron, whereas women in the GDS group had increases from −47 mg to 36 mg for a gain of 83 mg body iron. Compared with the control group, women in the FeSO4group gained 320 mg body iron, representing absorption of 3.5 mg daily or 3.5% of the iron supplement provided. The GDS group gained 262 mg iron, or 2.9 mg iron daily, indicating a higher absorption of 5.8%. The latter demonstrates the physiologic advantage of the GDS formulation that was designed to delay the release of iron in the stomach and thereby reduce the inhibiting effect of food on the absorption of elemental iron.
Changes in body iron in a trial of iron supplementation in pregnant Jamaican women.
A control group received no additional iron, an FeSO4 group received 100 mg iron daily, and a GDS group received 50 mg iron daily. Body iron was calculated from the ratio of serum transferrin receptor to serum ferritin. Positive values and the clear area represent storage iron, whereas negative values and the shaded area indicate tissue iron deficiency. Vertical bars represent ± 1 SEM.
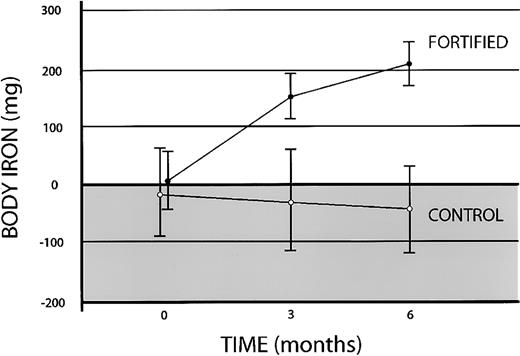
The usefulness of body iron determinations were next examined in an iron fortification trial in which changes in iron status are less pronounced and occur more slowly than with iron supplementation. The changes in body iron in 15 anemic Vietnamese women given either no iron or 10 mg fortification iron daily are shown in Figure5. In the control group, the mean baseline tissue iron deficit of −17 ± 79 mg (mean ± 1 SEM) declined further to −27 ± 87 mg at 3 months and −43 ± 75 mg at 6 months. In the fortified group, body iron increased from 5 ± 52 mg at baseline to 156 ± 41 mg at 3 months and 209 ± 37 mg at 6 months. After 3 months of fortification, a paired t test of the difference in body iron from baseline values in the fortified group was highly significant (t = 4.02; P < .001). Compared with the control subjects, women receiving the fortified fish sauce gained 1.68 ± 0.37 mg iron daily (mean ± 1 SEM) indicating an absorption of 17% of the fortification iron during the first 3 months. The rate of iron accumulation decreased during the second 3-month interval to 0.59 ± 0.21 mg daily or 6% of the added iron. In women receiving fortified fish sauce, a significant correlation between body iron at baseline and percentage absorption was observed (n = 15;r = 0.70; P = .004), consistent with the well-established inverse relationship between iron status and iron absorption.
Effect of iron fortification on body iron in anemic Vietnamese women.
Body iron was calculated from the ratio of serum transferrin receptor to serum ferritin. Positive values (clear area) depict storage iron, and negative values (shaded area) indicate tissue iron deficiency. Data are shown for 15 women given no additional iron (control) and 15 women given a meal fortified with 10 mg iron as NaFeEDTA 6 days each week (fortified). Vertical bars represent ± 1 SEM.
Discussion
Despite the continuing widespread use of anemia screening to assess iron status of populations, isolated measurements of the hemoglobin concentration or hematocrit level are unsuitable as the sole indicator of iron status. The sensitivity of hemoglobin measurements is poor because anemia associated with nutritional iron deficiency is relatively mild, resulting in extensive overlap in hemoglobin values between healthy and iron-deficient persons.13,15,20 The problem is magnified by the near universal acceptance of the WHO criteria of anemia, despite evidence of significant racial differences in normal hemoglobin values.21-24 Low specificity is an even greater limitation of hemoglobin screening for iron deficiency in developing countries where poverty, malnutrition, and infection are associated with a high prevalence of the anemia of chronic disease, which often exceeds that caused by iron-deficiency anemia. In the NHANES in the United States, multiple laboratory measurements have been used to identify iron deficiency more precisely,4 but most of these additional parameters are influenced similarly by iron-deficiency anemia and the anemia of chronic disease. Moreover, the cost and inconvenience of this approach is prohibitive in countries in which the prevalence of anemia is highest.
Body iron estimates in the present study using the R/F ratio are similar to values obtained with an earlier, more complex approach using several laboratory measurements and 3 separate algorithms.25 Body iron stores averaged 776 ± 313 mg (± 1 SD) in men and 309 ± 346 mg in women according to the original method compared with 752 mg and 297 mg, respectively, after the data in the present report were converted to absolute values for body iron using average weights for US men and women.26The earlier method was used to advantage in the analysis of a 2-year trial of iron fortification in South Africa27 and a 36-month trial of sugar fortification in semirural Guatemala.28 In both these studies, the changes in body iron resulting from fortification agreed with prestudy absorption measurements using radioisotopes of iron. It should be noted that a minor population of women with lower body iron was not detected in the original study but could have been missed because of the empirical algorithms used to estimate body iron. This minor population could represent women with the Gly227Ser transferrin mutation, which has been reported to increase the risk for iron deficiency.29
Estimation of body iron using the R/F ratio has several advantages over the original method,25 which required 5 laboratory value measurements (hemoglobin, serum ferritin, erythrocyte protoporphyrin, and serum iron levels and total iron-binding capacity) compared with 2 with the present method. Moreover, by eliminating the need for the transferrin saturation value, body iron can be determined with the R/F ratio from a small capillary blood specimen. This is an important advance in field studies, particularly in developing countries in which permission for venous sampling is often difficult to obtain. Another advantage of the present method is the expression of body iron on the basis of body weight rather than absolute values used in the original method and in much of the published literature on iron status. In addition to eliminating the effect of differences in body weight, expressing body iron per kilogram permits extrapolation to younger persons. The extent to which the algorithm using the R/F ratio can be applied to school-aged and preschool-aged children is uncertain, but the age relationships shown in Figure 2 are plausible. It will be difficult to validate the relationship between the R/F ratio and body iron in children and pregnant women because of the constraints in performing quantitative phlebotomy.
Body iron measurements using the R/F ratio provide a measure of iron status in each person surveyed rather than the current epidemiologic approaches based on arbitrary cutoff points of laboratory indices. The ability to examine the distribution of iron status in different segments of a population can provide important insights into the optimal design of public health strategies to reduce iron deficiency. Existing intervention programs often provide iron only to those with anemia, an approach that implies 2 separate populations of iron-deficient and healthy persons. The single distribution of body iron observed in pregnant Jamaican women using the R/F ratio indicates that it is better to target the entire population using food fortification. Another advantage of determining body iron individually is that small subsets of the population can be examined to assess the effect of various determinants of iron nutrition, such as racial or ethnic background, socioeconomic status, dietary patterns, iron supplements, and certain drugs such as aspirin. Limited interim surveys can also be used to detect temporal changes in iron status in the direction of either increasing or declining body iron.
Body iron measurements are independent of hemoglobin determinations and thereby shift the focus of screening programs from anemia to iron deficiency, the only cause of anemia than can be alleviated readily by public health measures. Capillary measurements of hemoglobin can be obtained when determining the R/F ratio, but anemia can also be determined from the deficit in tissue iron measured with the R/F ratio. In an iron-replete person, the development of anemia corresponds to a decrease in hemoglobin level of 20 g/L or a tissue iron deficit of approximately −4 mg/kg iron.25 The pitfall in relying solely on hemoglobin level to detect iron deficiency is illustrated by the Jamaican trial in which all women were anemic as defined by a hemoglobin concentration below 110 g/L. Based on body iron measurements, however, only 20% had iron-deficiency anemia as defined by a tissue iron deficit greater than −4 mg/kg (Figure 2). Some of this disparity could be attributed to the expanded plasma volume during gestation, but a major factor is more likely the use of an inappropriate criterion of anemia because of genetic differences in hemoglobin values.22
The use of the R/F ratio to estimate body iron has certain limitations. The most important one is the influence of inflammation or liver disease on the serum ferritin level independent of body iron stores. In view of the large and expanding list of laboratory markers of inflammation, it is conceivable that an algorithm can be developed in the future that corrects for the effect of inflammation on the serum ferritin value, thereby permitting its use for the calculation of body iron. At present, the only practical approach is to use a screening test such as C-reactive protein to exclude persons with inflammation from calculations of body iron. The sTfR can still be used to detect concurrent iron deficiency in persons with inflammation.30 31
Another significant obstacle to wider use of the R/F ratio in population studies is the variable range of reported values for the sTfR with different commercial assays. Most of the disparities between assays could probably be eliminated by using a common reference material for standardization. At present, the manufacturers of different commercial assays provide no details about the source and method of purification of transferrin receptor used in their assay. Although the need for standardization of the sTfR is commonly mentioned,32 33 there has been no effort by industry to develop a reference material, presumably because of proprietary concerns. Until the standardization issue is resolved, the R/F ratio must be calibrated by quantitative phlebotomy measurements before it is used to estimate body iron.
The clinical application of body iron measurements is limited by the numerous disorders that affect serum ferritin and sTfR levels independently of iron status, although the most important ones can be detected by elevated levels of C-reactive protein. The main clinical application is the monitoring of iron status in those who are highly susceptible to iron deficiency, such as infants, preschool children, and pregnant women. At present, clinicians rely on the serum ferritin level to determine the adequacy of iron stores and on the hemoglobin concentration to identify advanced iron deficiency at the other end of the iron spectrum. However, there is no reliable laboratory method at present for detecting tissue iron deficiency before the onset of anemia. Iron deficiency without anemia can represent up to 30% of a susceptible population, such as pregnant Jamaican women (Figure 2). There is substantial evidence of the deleterious effect of iron deficiency during infancy on subsequent intellectual performance and learning capacity34 35 and a continuing concern about the adverse effects of iron deficiency during gestation. Body iron measurements provide a method for investigators to assess more precisely the relevance of tissue iron deficiency without anemia and for clinicians to detect it.
The most important immediate application of body iron measurements is the assessment of intervention trials to improve iron status. Given the dismal long-term success of iron supplementation programs, the major focus of programs to alleviate iron deficiency in recent years is food iron fortification.36,37 Most of the fortification strategies now under investigation are based on isotopic measurements of iron absorption from meals fed to fasting subjects in a laboratory setting, but this approach does not assess the many others factors that determine the success or failure of a given strategy when implemented in a population. Fortification trials have traditionally required hundreds of participants and years to conduct.27,28,34 35In the Vietnam study, measurements in 30 subjects for 3 months were sufficient to define the efficacy of the fortification strategy (Figure5). Body iron measurements can greatly accelerate the development and implementation of programs to reduce the prevalence of iron deficiency.
We thank Dr Pham Van Thuy for permission to use preliminary data from the iron fortification trial in Vietnamese women. The study was supported by the Nippon Foundation and the International Life Sciences Institute Center for Health Promotion (Atlanta, GA), and it was conducted by the National Institute of Nutrition (Hanoi, Vietnam), the Institute of Research Development (Montpellier, France), and the Laboratory for Human Nutrition, Institute of Food Science, Swiss Federal Institute of Technology (Ruschlikon, Switzerland).
Prepublished online as Blood First Edition Paper, January 9, 2003; DOI 10.1182/blood- 2002-10-3071.
References
Author notes
James D. Cook, Department of Medicine, Kansas University Medical Center, 3901 Rainbow Blvd, Kansas City, KS 66160-7233; e-mail: jcook1@kumc.edu. The publication costs of this article were defrayed in part by page charge payment. Therefore, and solely to indicate this fact, this article is hereby marked “advertisement” in accordance with 18 U.S.C. section 1734.

This feature is available to Subscribers Only
Sign In or Create an Account Close Modal