Abstract
Our laboratory has recently discovered a novel candidate oncogene, MCT-1, amplified in human T-cell lymphoma and mapped to chromosome Xq22-24. This region is amplified in a subset of primary B-cell non-Hodgkin lymphoma (NHL), suggesting that increased copy number of a gene(s) located in this region confers a growth advantage to some primary human lymphomas. We examined a diverse panel of lymphoid malignancies for the expression of MCT-1. We demonstrated that there are significantly increased levels of MCT-1 protein in a panel of T-cell lymphoid cell lines and in non-Hodgkin lymphoma cell lines. Furthermore, we identified a subset of primary diffuse large B-cell lymphomas that exhibited elevated levels of MCT-1 protein. Interestingly, all transformed follicular lymphomas in our study demonstrated elevated protein levels of MCT-1. There was no detectable MCT-1 protein in leukemic cells from patients with chronic lymphocytic leukemia or in any healthy lymphoid tissue examined. Lymphoid cell lines overexpressing MCT-1 exhibited increased growth rates and displayed increased protection against apoptosis induced by serum starvation when compared with matched controls. We found that MCT-1—overexpressing cells show constitutively higher levels of phosphorylated PKB/Akt protein, especially under serum starvation. Activation of survival pathways may be an additional function of the MCT-1 gene. Our data suggest that high levels of MCT-1 protein may be associated with a high-risk subset of lymphoid neoplasms and may further support the potential role of MCT-1 in promoting human lymphoid tumor development. (Blood. 2003;102: 297-302)
Introduction
Random genomic instability, as seen in many epithelial cancers, is not a characteristic of the more stable lymphoma genome. Furthermore, defects in DNA-mismatch repair that manifest as genomic microsatellite instability, commonly found in various hereditary solid tumor syndromes, and rare sporadic cancers are less recognized in lymphoma.1,2 Genetic alterations frequently identified in lymphomagenesis include chromosome rearrangements, disruption of tumor-suppressor genes, and increase in copy number of genes (gene amplification). We have previously identified an amplified DNA sequence in the Hut 78 T-cell lymphoma cell line that was subsequently shown to represent a novel candidate oncogene mapped to chromosome Xq22-24.3 This region is amplified in a subset of primary B-cell non-Hodgkin lymphoma (NHL),4-6 suggesting that increased copy number of a gene(s) located in this region confers a growth advantage to a subset of primary human lymphomas. Recently, analysis of the cell-cycle regulation of MCT-1 protein levels displayed little variation of MCT-1 protein during the cell-cycle progression.7 However, levels of MCT-1 protein are rapidly induced in irradiated human lymphoid cells through a posttranslational mechanism,7 consistent with MCT-1 as a DNA damage-response gene. In this report, we examined the expression profile of MCT-1 protein along a spectrum of human lymphoid tumors. Our results demonstrated that MCT-1 protein expression was elevated in some samples of aggressive lymphoma, including diffuse large B-cell lymphoma (DLBCL) and interleukin-2 (IL-2)—independent T-cell lymphoid tumors. Moreover, we also observed that MCT-1 expression levels are strongly associated with the cell proliferation marker, proliferating cell nuclear antigen (PCNA). In addition, lymphoid cells that are stably transfected with an MCT-1 retroviral construct exhibited increased proliferative rates and increased protection against apoptosis induced by serum starvation when compared with matched controls. These data suggest that high levels of MCT-1 protein may be associated with a high-risk subset of lymphoid neoplasms and support a possible role for MCT-1 in human lymphomagenesis.
Patients, materials, and methods
Cell lines, healthy tissues, and tumor specimens
Six T-cell lines, 3 which are IL-2 dependent—EC155 (Advanced Biotechnologies, Columbia, MD) NII85,8 and N11868 —and 3 which are IL-2 independent—Hut 78, MT-2, and Jurkat (Advanced Biotechnologies)—and 7 NHL cell lines—SU-DHL-4, SU-DHL-6, SU-DHL-7, SU-DHL-8, SUDHL-10, Namalwa, and Ly3 (ATCC, Manassas, VA)—were chosen for this study. All T-cell lines were cultured in complete RPMI 1640 with 40 U/mL recombinant IL-2 (Invitrogen, Carlsbad, CA) added to the IL-2—dependent lines. Healthy donor peripheral blood lymphocytes (PBL) were isolated by centrifugation over Ficoll-Hypaque as previously described9 (Pharmacia, Pleasant Hill, CA). After phytohemagglutinin (PHA) stimulation, these lymphocytes were cultured in a manner similar to that for IL-2—dependent T-cell lines, as described. Leukemic cells from patients with chronic lymphocytic leukemia (CLL) were obtained, after informed consent was given, by Ficoll-Hypaque centrifugation (Pharmacia). White blood counts ranged from 10,000 to 90,000 μL, with more than 80% lymphocytes in all samples. No patient had been exposed to chemotherapy for at least 3 months before sampling. Lymph node biopsy specimens from patients with primary DLBCL and normal lymph nodes were used in this study. All primary tumor samples examined were obtained at diagnosis before treatment and were stored as fresh-frozen biopsy specimens and preserved at -80°C in the Pathology Core Laboratory of the Robert H. Lurie Comprehensive Cancer Center at Northwestern University Feinberg School of Medicine. Approval was obtained from the Northwestern University institutional review board for these studies. Informed consent was provided according to the Declaration of Helsinki.
Western blot analysis
Cell lines (2 × 10⁷ cells) were washed twice in phosphate-buffered saline (PBS), lysed in 300μL RIPA buffer containing 20μL protease inhibitor cocktail (Sigma, St Louis, MO), and incubated on ice for 30 minutes. Primary frozen tumor tissue samples were homogenized with Dounce homogenizers in RIPA buffer. Samples from cell lines and tissues were further disrupted by passage through 21-gauge needles. The supernatant fluid of total cell lysate was taken after 10 000g centrifugation for 10 minutes. In general, 40μg protein was separated on 10% sodium dodecyl sulfate—polyacrylamide gel electrophoresis (SDS-PAGE) at room temperature. The proteins were transferred to Hybond nitrocellulose membrane (Amersham Pharmacia Biotech, Buckinghamshire, United Kingdom) with the use of a semidry electroblotter (Bio-Rad, Hercules, CA). Membranes were blocked in 5% nonfat milk Tris-buffered saline—Tween (TBST) and subsequently were incubated with the following primary antibodies: rabbit polyclonal antihuman MCT-1 (Research Genetics, Huntsville, AL), mouse monoclonal antihuman β-actin (Sigma), mouse monoclonal antihuman PCNA (Santa Cruz Biochemicals, Santa Cruz, CA), mouse monoclonal anti-V5 (Invitrogen), rabbit polyclonal anti—phospho-AKT (Ser473) (Cell Signaling, Beverly, MA), goat polyclonal anti-AKT (Cell Signaling), and a horseradish peroxidase (HRP)—conjugated secondary antibody. Specific proteins were detected by enhanced chemiluminescence (ECL; Amersham) and film exposure.
RT-PCR SSCP analysis for mutation detection
Reverse transcription-polymerase chain reaction (RT-PCR) was performed for single-strand conformational polymorphism (SSCP). PCR primer sets used for the 5′ end portion of MCT-1 were: forward, AACCGGTTGCCTAAAAGGAG; reverse, TGTTCATGGCATCGGACTATTT (product of 410bp). PCR primer sets used for the 3′ end portion of MCT-1 were: forward, AAATAGTCCGATGCCATGAACA; reverse, ACACAGACACAAACACAGATACAG (product of 465 bp). PCR cycling was carried out as follows: 94°C for 1 minute followed by 34 cycles of denaturation at 94°C for 1 minute, annealing at 58°C for 45 seconds, extension at 72°C for 1 minute; final chain elongation at 72°C for 5 minutes. Ten-microliter PCR product mixed with 2 μL10 × Blue Juice loading buffer (Gibco, Carlsbad, CA) was denatured at 95°C for 4 minutes and then made ice cold for 2 minutes. The mixture was separated by 6% polyacrylamide/5% glycerol gel and was silver stained according to the procedures described.10 The gel was dried at 80°C for 30 minutes and then scanned into a computer by a Microteck Scanner.
Establishment of stable MCT-1 overexpressing lymphoid cell line
The cDNA fragment containing the coding region of MCT-1 was amplified by RT-PCR using total RNA from healthy donor PBL cells. This sequence was subcloned into the TOPO cloning site of pcDNA3.1/V5-Histidine tag vector (Invitrogen). The pcDNA3.1-MCT-1-V5 plasmid was extracted from the vector and used to transform Top 10 bacteria (Invitrogen). The new sequence containing the MCT-1 coding region was fused with a V5-histidine tag in C-terminal and was PCR amplified from pcDNA3.1-MCT-1-V5 plasmid by the forward primer of 5′-TAGAATTCACCATGTTCAAGAAATTTGAT-3′ and reverse primer 5′-GGTTAACAGCGGGTTTAAACTCAAT-3′. This fragment was then digested with EcoRI and HpaI and was ligated to the EcoRI and HpaI sites of the retroviral expression vector pLXSN (Clontech, Palo Alto, CA). pLXSN vector or pLXSN-MCT-1-V5 vector was transfected into the packaging cell line, PT67, and recombinant retroviral RNAs were packaged into infectious, replication-incompetent particles. Culture media containing viral particles were collected. Viral-containing medium was added to the EC155 cell culture medium. Infected EC155 cells were selected after growing in 10% serum RPMI 1640 supplemented with 300 μg/mL geneticin (G418) for 3 weeks. Individual clones of stably infected cells with pLXSN vector or pLXSN-MCT-1-V5 were obtained by limiting dilution. The following independently isolated clones were used for our experiments: ECI55-Vector,4 ECI55-Vector,5 ECI55-MCT-1,4 ECI55-MCT-1,5 and ECI55-MCT-1.7
Confocal immunofluorescence
EC155-Vector and EC155—MCT-1 cells were washed once with PBS in 15-mL tubes. Cells were fixed in 2 mL absolute methanol for 5 minutes at room temperature (RT). After fixation, cells were washed with 5 mL PBS 3 times. Cells were incubated in 2 mL block solution (PBS containing 10% fetal bovine serum) for 20 minutes at RT. The block solution was replaced by 0.5 mL PBS—10% containing primary antibody, mouse monoclonal anti-V5 (1:250 dilution; Invitrogen), or mouse monoclonal anti-PCNA (1:500; Santa Cruz Biotechnology). Cells were incubated with primary antibody at 40°C overnight. Then cells were washed 3 times with 5 mL PBS and were incubated with 0.5 mL PBS—10% containing the secondary antibody, antimouse immunoglobulin G2a (IgG2a)—fluorescein (1:250 dilution; Roche Molecular Biochemicals, Mannheim, Germany) for 2 hours. After 3 washes with PBS, the cells were spread on slides and mounted on a coverglass with mounting medium. The slides were then viewed using a Zeiss LSM510 confocal scanning laser microscope (Oberkochen, Germany). Green fluorescence was detected using an excitation of 395 nm and an emission of 505 nm. Fluorescence images were saved on a computer, and the results were printed out on a Fujix Pictography 3000 digital printer.
Cell growth, viability, and apoptosis assays
Cell lines used were either EC155-Vector or EC155—MCT-1 clones. Cell lines were cultured in RPMI 1640 (Life Technologies, Gaithersburg, MD) supplemented with 10% fetal calf serum (FCS; Life Technologies) and 40 U/mL recombinant IL-2 (Life Technologies).
EC155-Vector or EC155—MCT-1 was seeded at 0.5 × 10⁶ cells/mL in triplicate T-25 flasks with 10 mL complete RPMI 1640 supplemented with 40 U/mL recombinant IL-2. IL-2 was replenished every 3 days. Cells were counted every other day for 8 days, and viability was measured using the trypan blue exclusion method. Mean cell number and its standard deviation for each time point were calculated using standard methodology as previously performed.3
To investigate a possible role of MCT-1 in cell survival, the effect of serum deprivation was investigated. We seeded 2 × 10⁶ cells/mL of either EC155-Vector or EC155—MCT-1 clones in duplicate T-25 flasks with serum-reduced culture medium that contained 0.2% FCS and 40 U/mL IL-2 in RPMI 1640 medium. After 24, 48, and 72 hours of culture, cell viabilities of both cell lines were analyzed using the trypan blue dye exclusion method.
To determine whether cell death was caused by apoptosis, annexin V binding assays and mitochondrial membrane potential (MMP) assays were performed. We used an immunofluorescence assay to simultaneously detect MMP and annexin V binding of the cells. In brief, cell pellets were collected and resuspended with culture medium to reach a final cell concentration of 1 × 10⁶ cells/mL. Fifty microliters CMX Rosamine (Beckman Coulter, Brea, CA) was added to 0.5 mL cell suspension and vortexed gently. Cell-containing tubes were placed in a CO2 incubator at 37°C for 15 minutes. Each tube containing 1 mL PBS was spun at 1200 rpm for 5 minutes. Supernatant was discarded, and cells were resuspended in 500 μL cold 1× binding buffer from the annexin V-FITC kit (Beckman Coulter). Five microliters annexin V-FITC was added to the cell suspension, and the tube was vortexed gently and put at 40°C for 10 minutes. Stained cells were immediately analyzed by flow cytometry.
Results
Elevated MCT-1 protein levels in exponentially growing T-lymphoid cell lines are not associated with point mutations
All IL-2—independent T-cell lines exhibited elevated MCT-1 protein levels. By contrast, the IL-2—dependent T-cell lines including IL-2—stimulated peripheral blood lymphocytes (PBLs) demonstrated low to absent MCT-1 protein levels (Figure 1). No amplification of the MCT-1 gene was detected in any of these cell lines (data not shown). If the MCT-1 gene is not amplified, the potential still exists for it to be activated through point mutations. The RT-PCR SSCP assay was used to screen for point mutations that may exist in the MCT-1 gene. There was no altered migration of bands in any of the T-cell lines compared with the normal PBL samples (data not shown). Separation of the amplified coding region into 2 fragments smaller than 500 bp each greatly diminished the likelihood that we failed to detect point mutations under our assay conditions.11
Steady-state MCT-1 protein levels in exponentially growing T-lymphoid cell lines. Forty micrograms total proteins from IL-2—dependent cell lines PBL, EC155, NII85, and N1186, and IL-2—independent cell lines C10MJ, MT-2, and Jurkat were subjected to SDS-PAGE analysis and blotted on the membrane. Western blotting was performed with MCT-1 polyclonal antibody. Control immunoblotting was carried out with β-actin. All IL-2—independent T-cell lines exhibited elevated MCT-1 protein levels in contrast to the IL-2—dependent T-cell lines, including IL-2—stimulated PBLs, which have low to undetectable MCT-1 protein levels.
Steady-state MCT-1 protein levels in exponentially growing T-lymphoid cell lines. Forty micrograms total proteins from IL-2—dependent cell lines PBL, EC155, NII85, and N1186, and IL-2—independent cell lines C10MJ, MT-2, and Jurkat were subjected to SDS-PAGE analysis and blotted on the membrane. Western blotting was performed with MCT-1 polyclonal antibody. Control immunoblotting was carried out with β-actin. All IL-2—independent T-cell lines exhibited elevated MCT-1 protein levels in contrast to the IL-2—dependent T-cell lines, including IL-2—stimulated PBLs, which have low to undetectable MCT-1 protein levels.
Steady-state MCT-1 protein levels in a panel of transformed B-cell lines derived from patients with non-Hodgkin lymphoma
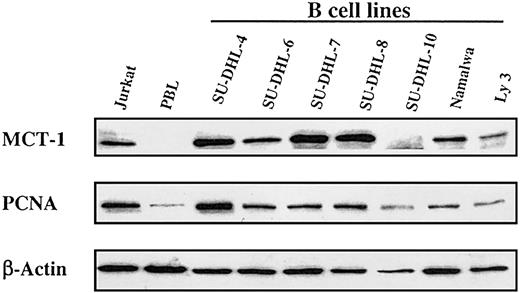
This striking association of growth factor independence with elevated MCT-1 protein levels in T-cell lymphoid tumor lines prompted us to examine the expression of MCT-1 in other lymphoid malignancies. We studied a panel of lymphoma cell lines derived from patients with NHL. Most expressed high levels of MCT-1 protein when standardized to levels of β-actin protein (Figure 2).
Steady-state MCT-1 protein levels in a panel of transformed B-cell lines derived from patients with non-Hodgkin lymphoma. Western blotting was performed with MCT-1 polyclonal antibody on 40 μg total protein from 7 transformed B-cell lines. Results showed that most B-cell lines expressed high levels of MCT-1 protein and that MCT-1 levels are closely correlated with PCNA expressions in these cell lines. Jurkat and PBL cells served as positive and negative controls for MCT-1 signals, respectively.
Steady-state MCT-1 protein levels in a panel of transformed B-cell lines derived from patients with non-Hodgkin lymphoma. Western blotting was performed with MCT-1 polyclonal antibody on 40 μg total protein from 7 transformed B-cell lines. Results showed that most B-cell lines expressed high levels of MCT-1 protein and that MCT-1 levels are closely correlated with PCNA expressions in these cell lines. Jurkat and PBL cells served as positive and negative controls for MCT-1 signals, respectively.
MCT-1 protein levels are increased in a subset of patients with DLBCL
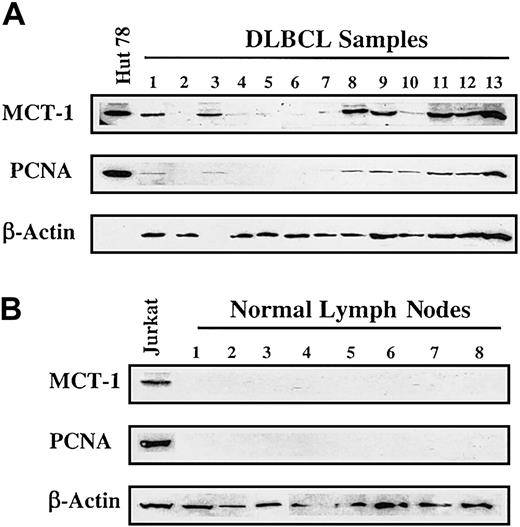
Based on the results obtained from NHL cell lines, we proceeded to analyze primary lymphoma samples. We examined lymph node biopsy specimens obtained at initial diagnosis from patients with DLBCL. As shown in Figure 3A, 7 specimens displayed readily detectable MCT-1 protein. Positive findings were found in 7 of 17 (41%) NHL patients and in 0 of 10 (0%) control subjects (Figure 3B). This difference was statistically significant using Fisher exact test (41% vs 0%; P = .026). All 4 transformed lymphomas in our group demonstrated strong signals for MCT-1 protein. Elevated MCT-1 protein levels were also shown to correlate with increased PCNA levels (Figure 3A-B).
MCT-1 protein levels are increased in primary samples from a subset of patients. (A) Western blotting was carried out to detect MCT-1 and PCNA proteins from grossly involved lymph nodes of patients with newly diagnosed DLBCL. Seven of 13 specimens displayed elevated MCT-1 protein levels and were shown to correlate with increased PCNA levels. All 4 transformed lymphomas in our group demonstrated strong signals for MCT-1 protein (samples 3, 8, 9, and 11). (B) Ten normal lymph nodes examined had no detectable MCT-1 or PCNA. The Jurkat cell line served as a positive control for MCT-1 and PCNA protein expression.
MCT-1 protein levels are increased in primary samples from a subset of patients. (A) Western blotting was carried out to detect MCT-1 and PCNA proteins from grossly involved lymph nodes of patients with newly diagnosed DLBCL. Seven of 13 specimens displayed elevated MCT-1 protein levels and were shown to correlate with increased PCNA levels. All 4 transformed lymphomas in our group demonstrated strong signals for MCT-1 protein (samples 3, 8, 9, and 11). (B) Ten normal lymph nodes examined had no detectable MCT-1 or PCNA. The Jurkat cell line served as a positive control for MCT-1 and PCNA protein expression.
MCT-1 protein is not expressed in chronic lymphocytic leukemia
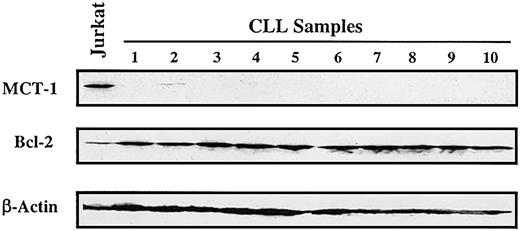
In primary uncultured samples (n = 10) of B-cell chronic lymphocytic leukemia (CLL), we found low to undetectable levels of MCT-1 protein in the peripheral lymphocytes from untreated patients (Figure 4). These results are not unexpected because leukemic cells in this indolent lymphoid malignancy are primarily arrested in the G0/G1 stage.12,13
MCT-1 protein is not expressed in chronic lymphocytic leukemia. Western blotting was performed on 40 μg whole cell lysate with MCT-1 polyclonal antibody. All samples were isolated from peripheral blood of untreated patients (with more than 80% lymphocytes). Protein from Jurkat cells was served as MCT-1—positive control. Control immunoblotting with β-actin verified equal loading. Bcl-2 protein was universally expressed in the patients we analyzed. Peripheral lymphocytes from primary uncultured B-CLL samples demonstrated low to undetectable levels of MCT-1 protein.
MCT-1 protein is not expressed in chronic lymphocytic leukemia. Western blotting was performed on 40 μg whole cell lysate with MCT-1 polyclonal antibody. All samples were isolated from peripheral blood of untreated patients (with more than 80% lymphocytes). Protein from Jurkat cells was served as MCT-1—positive control. Control immunoblotting with β-actin verified equal loading. Bcl-2 protein was universally expressed in the patients we analyzed. Peripheral lymphocytes from primary uncultured B-CLL samples demonstrated low to undetectable levels of MCT-1 protein.
Overexpression of MCT-1 promotes cell proliferation
To examine the effect of constitutive overexpression of MCT-1 on cell-cycle progression of stably transfected lymphoid cell lines, we performed confocal microscopy on EC155-Vector5 or EC155—MCT-17 cell lines. The EC155—MCT-17 cells showed a marked increase in the proportion of cells staining positively for PCNA, both by confocal analysis and by Western blot analysis (Figure 5).
Confocal immunofluorescence microscopy of EC155 cell lines. EC155-Vector5 and EC155—MCT-17 cells were fixed with methanol and incubated with blocking solution and primary antibody, mouse monoclonal anti-V5, or anti-PCNA. Next, secondary antimouse IgG2a-fluorescein was used for hybridization. Cells were spread on slides and mounted on coverglass with mounting medium. Slides were examined using a Zeiss LSM510 confocal scanning laser microscope. Results showed that MCT-1 overexpressing cells had elevated PCNA protein levels compared with control. Original magnification, × 40.
Confocal immunofluorescence microscopy of EC155 cell lines. EC155-Vector5 and EC155—MCT-17 cells were fixed with methanol and incubated with blocking solution and primary antibody, mouse monoclonal anti-V5, or anti-PCNA. Next, secondary antimouse IgG2a-fluorescein was used for hybridization. Cells were spread on slides and mounted on coverglass with mounting medium. Slides were examined using a Zeiss LSM510 confocal scanning laser microscope. Results showed that MCT-1 overexpressing cells had elevated PCNA protein levels compared with control. Original magnification, × 40.
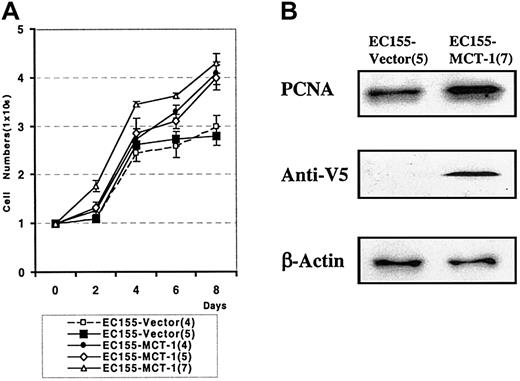
We also observed a significant difference in the growth rate of MCT-1 overexpressing cells. The growth curve demonstrates the increased growth rate in 3 independent clones overexpressing MCT-1 compared with vector controls (P < .001) (Figure 6A). MCT-1 overexpressing cells also demonstrate a higher percentage of cells in S-phase than do matched vector control cells, as shown by the increased level of PCNA protein staining (Figure 6B). These aggregate data support the role of MCT-1 in cell proliferation.
MCT-1 overexpression increases the growth rate of lymphoid cells.(A) EC155-Vector or EC155—MCT-1 cells were seeded at 0.5 × 10⁶ cells/mL in triplicate T-25 flasks. Cells were counted every other day by using the trypan blue exclusion method for 8 days. The growth curve demonstrated the significantly increased growth rate in EC155—MCT-1 clones. Data were derived from 3 independent experiments with each clone. Error bars denote mean ± SD. (B) The EC155—MCT-1 cells showed a marked increase in PCNA level.
MCT-1 overexpression increases the growth rate of lymphoid cells.(A) EC155-Vector or EC155—MCT-1 cells were seeded at 0.5 × 10⁶ cells/mL in triplicate T-25 flasks. Cells were counted every other day by using the trypan blue exclusion method for 8 days. The growth curve demonstrated the significantly increased growth rate in EC155—MCT-1 clones. Data were derived from 3 independent experiments with each clone. Error bars denote mean ± SD. (B) The EC155—MCT-1 cells showed a marked increase in PCNA level.
EC155—MCT-1 cells survive in serum starvation
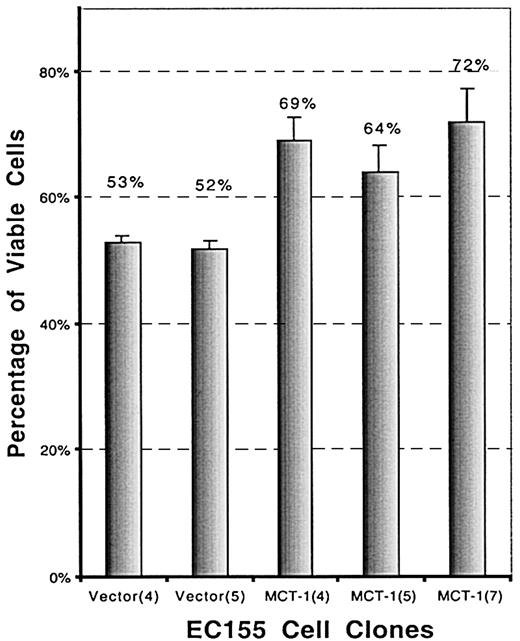
To investigate a possible role of MCT-1 in cell survival, the effect of serum deprivation was investigated. Serum deprivation resulted in significantly increased death in the vector controls than in the MCT-1 overexpressing clones. The viability of EC155—MCT-1 after 72-hour serum starvation is significantly higher than that of EC155-vector control (P < .01), as determined by trypan blue dye exclusion (Figure 7).
MCT-1 promotes cell survival in serum-starvation culture. EC155-Vector or EC155—MCT-1 cells (2 × 10⁵cells /mL) were seeded in triplicate wells in 12-well plates in serum-starved culture (0.2% FBS). Cell viability was analyzed by using the trypan blue exclusion method at certain time points. Data were presented as percentage of viable cells (mean ± SD) and were derived from 3 independent experiments with each clone. The viability of EC155—MCT-1 after 72 hours of serum starvation was significantly higher than that of EC155-vector control.
MCT-1 promotes cell survival in serum-starvation culture. EC155-Vector or EC155—MCT-1 cells (2 × 10⁵cells /mL) were seeded in triplicate wells in 12-well plates in serum-starved culture (0.2% FBS). Cell viability was analyzed by using the trypan blue exclusion method at certain time points. Data were presented as percentage of viable cells (mean ± SD) and were derived from 3 independent experiments with each clone. The viability of EC155—MCT-1 after 72 hours of serum starvation was significantly higher than that of EC155-vector control.
MCT-1 protein protects against apoptosis
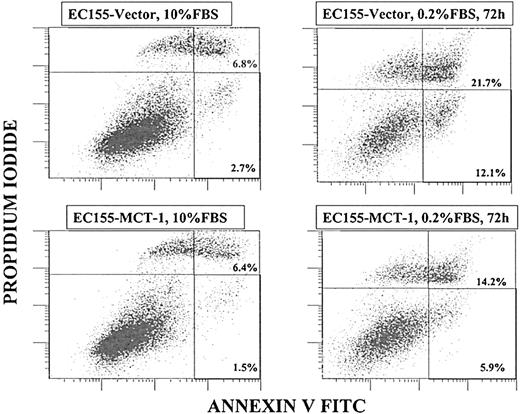
To prove that cell death resulted from apoptosis, annexin V binding assays were performed. Annexin V binds to phosphatidylserine, a phospholipid that normally is present at the inner leaflet of the cell membrane but that, during apoptosis, is exposed at the outer leaflet. In the presence of serum, neither cell line significantly bound annexin V. However, after 48 to 72 hours of serum depletion, the EC155-Vector5 cells heavily stained with annexin V-FITC, and EC155—MCT-17 cultures stained significantly less (Figure 8). The data presented are representative of the other clones as well. Another hallmark of early apoptosis is mitochondrial membrane permeabilization, which is regulated by numerous effectors, including the proteins from the Bcl-2/Bax family. We have observed the increase in mitochondrial membrane permeabilization after serum starvation occurring more frequently in the EC155-Vector5 cell line than in the EC155—MCT-17 cell line (data not shown).
MCT-1 protein protects against apoptosis. Annexin V binding assay by flow cytometry was performed to compare cell apoptosis induction in EC155-Vector5 and EC155—MCT-17 cell lines. After 72 hours of serum starvation, total annexin V-positive cells of the EC155—MCT-17 line was significantly less than that of EC155-Vector5 (20.1% vs 33.8%). Similar results were obtained with other MCT-1 overexpressing clones. The data suggest a protective function of MCT-1 against apoptosis induced by serum starvation.
MCT-1 protein protects against apoptosis. Annexin V binding assay by flow cytometry was performed to compare cell apoptosis induction in EC155-Vector5 and EC155—MCT-17 cell lines. After 72 hours of serum starvation, total annexin V-positive cells of the EC155—MCT-17 line was significantly less than that of EC155-Vector5 (20.1% vs 33.8%). Similar results were obtained with other MCT-1 overexpressing clones. The data suggest a protective function of MCT-1 against apoptosis induced by serum starvation.
MCT-1 enhances AKT phosphorylation at residue of Ser473
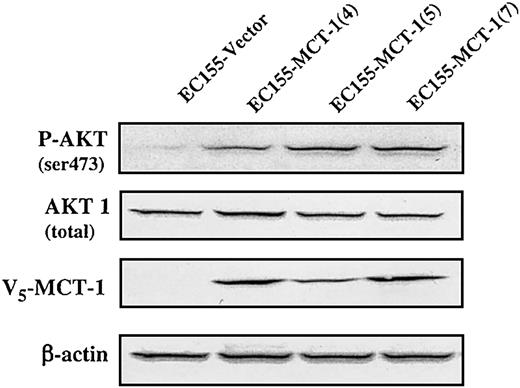
AKT plays a critical role in controlling the balance between cell survival and apoptosis.14 This protein kinase is activated by growth/survival factors and is involved in phosphoinositide 3-kinase (PI3-kinase) signaling transduction. Akt is activated by PDK1-dependent phosphorylation at Thr308 and Ser473 residues.15,16 The specific antibody against phospho-Ser473 on AKT was used to test EC155-Vector and EC155—MCT-1 cells (Figure 9). Our data revealed that phosphorylation level of AKT on Ser473 residue was significantly increased in MCT-1 overexpressing clones. Thus, MCT-1 may enhance AKT kinase activation to promote cell survival by inhibiting apoptosis.
MCT-1 overexpression enhances AKT phosphorylation at residue of Ser473. Western blot analysis of extracts (150 μg) was performed on EC155-Vector and EC155—MCT-1 cell lines. Nitrocellulose membranes were immunoblotted by anti-V5 after rehybridization with anti—phospho-AKT (Ser473), AKT, and actin antibodies after stripping overnight with 200 mM glycine (pH 2.5). The phosphorylation level of AKT on Ser473 residue was increased significantly in MCT-1 overexpressing cells compared with the vector control.
MCT-1 overexpression enhances AKT phosphorylation at residue of Ser473. Western blot analysis of extracts (150 μg) was performed on EC155-Vector and EC155—MCT-1 cell lines. Nitrocellulose membranes were immunoblotted by anti-V5 after rehybridization with anti—phospho-AKT (Ser473), AKT, and actin antibodies after stripping overnight with 200 mM glycine (pH 2.5). The phosphorylation level of AKT on Ser473 residue was increased significantly in MCT-1 overexpressing cells compared with the vector control.
Discussion
The MCT-1 candidate oncogene product transforms fibroblasts and pushes them through the G1/S-phase of the cell cycle.3,17 In the present study, we examined the expression status of the recently discovered candidate oncogene MCT-1 in a diverse panel of primary lymphoid tumors and lymphoid cell lines. We also investigated the role of MCT-1 on cell growth and in protecting lymphoid cells against apoptosis. Our results demonstrated that MCT-1 protein expression was significantly elevated in some samples of aggressive lymphoma, including diffuse large B-cell lymphoma (DLBCL) and IL-2—independent T-cell lymphoid tumors. By contrast, chronic lymphocytic leukemia (CLL), an indolent lymphoproliferative disorder,12,13 and the IL-2—dependent T-cell lines exhibited low to undetectable amounts of MCT-1 protein. We also observed a significant difference in the growth rate of MCT-1 overexpressing cells. Elevated MCT-1 protein levels were shown to strongly correlate with increased proliferating cell nuclear antigen (PCNA) levels. We showed that MCT-1 protein levels are associated with increased cell proliferation in human primary lymphoid tumors. Furthermore, we demonstrated that forced expression in lymphoid cell lines increased their proliferative rates using 2 independent assays, growth curve and PCNA staining. We detected no evidence of point mutations in the coding region of MCT-1 in those tumors with elevated levels of MCT-1 protein. The finding that elevated MCT-1 protein expression is more frequent in transformed lymphomas is consistent with our hypothesis that this candidate oncogene provides a growth advantage to lymphoma cells and may be associated with a more aggressive clinical course. It is possible that a minor population of normal lymphocytes expresses MCT-1 protein below our detection limit and that the primary DLBCL shown here may represent the in vivo transformation of relatively rare MCT-1—expressing normal B cells. Once MCT-1 antibodies that work on paraffin-embedded tissues are available, we will be able to more critically address this issue and evaluate the relationship between MCT-1 protein levels and clinical parameters in a large study of DLBCL. The mechanism(s) of increased MCT-1 protein levels in a subset of human lymphoid tumors is unknown and is an area of active research in our laboratory.
The impact of decreased/increased MCT-1 protein levels on cell-cycle progression and protection against apoptosis in lymphoid tumors may shed new light on the physiological relevance of MCT-1. Given that cells that are deprived of essential growth factors normally undergo apoptosis, the inhibition of apoptosis is thought to be an important requirement in the process of oncogenesis. In view of the biologic relevance of apoptosis, we investigated whether the increased protection against cell death by MCT-1 in vitro was caused by an inhibition of apoptosis. Inhibition of apoptosis by MCT-1 would provide a physiological selective advantage in vivo for MCT-1—transformed cells. The trypan blue dye assay measures the number of surviving cells but does not distinguish between death by necrosis or apoptosis. We have shown by annexin V staining and mitochondrial membrane permeabilization that increased MCT-1 protein expression in lymphoid cells results in protection against apoptosis induced by serum starvation. The best-described antiapoptotic pathway is the PI3-kinase/Akt pathway. Generally, PKB/Akt activity is correlated with the phosphorylation of Ser473 and Thr308.15,16 Under our experimental conditions, serum-starved EC155—MCT-1 cells and EC155-Vector cells contain similar amounts of total PKB/Akt protein. However, we found that with starvation, the SER(P) 473 PKB levels in EC155—MCT-1 cells are increased compared with EC155-Vector cells. Thus, the PKB/Akt phosphorylation levels in these cells correspond well with the differential resistance we observed against apoptosis induced by serum starvation. MCT-1 may function as a positive up-stream regulator of AKT, or MCT-1 could modulate Akt activity by inhibiting phosphatase activity, such as a tumor-suppressor PTEN. The molecular mechanism(s) underlying the antiapoptotic activity of MCT-1 and its putative involvement in PI3/AKT signaling pathway are under investigation. Our results suggest that the inhibition of apoptosis may be an important mechanism of MCT-1.
The demonstration that MCT-1 has in vitro transforming and antiapoptotic functions does not yet prove a primary role in lymphomagenesis. Additional experiments demonstrating transformation in whole animal studies are ongoing and are of critical importance to address this issue. Although the underlying mechanisms are still unclear, others have found that molecular determinants predict outcome more accurately than clinical parameters18,19 and that the identification of novel genes may result in models that can predict outcome. Indeed, investigators have shown that molecular profiling can segregate otherwise identical presentations of DLBCL into prognostic groups.20-22 Molecular profiling may be able to predict outcome and to drive therapeutic decisions in these patients and may prove to be complementary to the clinical prognostic factors in use today. The identification of novel genes that encode proteins, which confer a growth advantage to lymphoma cells, will help to clarify molecular profiling data. As the function of the MCT-1 gene in regulating cell growth and apoptosis is further characterized, its putative role in lymphomagenesis will be elucidated. Ultimately, overexpressed or modified proteins may serve as targets for protein-specific therapy.
Prepublished online as Blood First Edition Paper, March 13, 2003; DOI 10.1182/blood-2002-11-3486.
The publication costs of this article were defrayed in part by page charge payment. Therefore, and solely to indicate this fact, this article is hereby marked “advertisement” in accordance with 18 U.S.C. section 1734.



This feature is available to Subscribers Only
Sign In or Create an Account Close Modal