Abstract
To modulate alloreactivity after hematopoietic stem cell transplantation, “suicide” gene-modified donor T cells (GMCs) have been administered with an allogeneic T-cell–depleted marrow graft. We previously demonstrated that such GMCs, generated after CD3 activation, retrovirusmediated transduction, and G418 selection, had an impaired Epstein-Barr virus (EBV) reactivity, likely to result in an altered control of EBV-induced lymphoproliferative disease. To further characterize the antiviral potential of GMCs, we compared the frequencies of cytomegalovirus (CMV)–specific CD8+ T (CMV-T) cells and EBV-specific CD8+ T (EBV-T) cells within GMCs from CMV- and EBV-double seropositive donors. Unlike anti-EBV responses, the anti-CMV responses were not altered by GMC preparation. During the first days of culture, CMV-T cells exhibited a lower level of CD3-induced apoptosis than did EBV-T cells. In addition, the CMV-T cells escaping initial apoptosis subsequently underwent a higher expansion rate than EBV-T cells. The differential early sensitivity to apoptosis could be in relation to the “recent activation” phenotype of EBV-T cells as evidenced by a higher level of CD69 expression. Furthermore, EBV-T cells were found to have a CD45RA–CD27+CCR7– effector memory phenotype, whereas CMV-T cells had a CD45RA+CD27–CCR7– terminal effector phenotype. Such differences could be contributive, because bulk CD8+CD27– cells had a higher expansion than did bulk CD8+CD27+ cells. Overall, ex vivo T-cell culture differentially affects apoptosis, long-term proliferation, and overall survival of CMV-T and EBV-T cells. Such functional differences need to be taken into account when designing cell and/or gene therapy protocols involving ex vivo T-cell manipulation.
Introduction
Graft-versus-host disease (GVHD) remains a major source of morbidity and mortality after allogeneic hematopoietic stem cell (HSC) transplantation. GVHD results from the recognition by mature immunocompetent donor cells present in the graft of alloantigens expressed by the recipients. GVHD can be efficiently prevented by T-cell depletion of the graft. However, donor T cells also have a considerable role in engraftment facilitation, and they significantly contribute to major therapeutic aspects, such as control of graft rejection, increased graft-versus-leukemia effect, and antiviral immune responses.1 Thus, separating the beneficial and harmful properties of donor T cells remains a major concern in allogeneic HSC transplantation. We have, therefore, developed a new approach aimed at controlling donor T cells, by administering, together with a T-cell–depleted bone marrow graft, donor T lymphocytes that have been modified by ex vivo transfer of the Herpes Simplex thymidine kinase (HS-tk) gene.2 This conditional toxicity, or “suicide,” gene renders gene-modified cells (GMCs) sensitive to a prodrug, ganciclovir (GCV). Should subsequent GVHD occur, GCV injection would lead to the specific and selective in vivo depletion of donor alloreactive GMCs while keeping other cells unaltered. One could thus preserve the beneficial effects of T cells on engraftment and tumor control early after transplantation and throughout the posttransplantation period for patients not experiencing severe GVHD. GCV-induced selective immunosuppression, restricted to proliferating donor mature GMCs infused with the HSC graft, should result in a weaker toxicity than the broad immunosuppressive agents presently used for GVHD treatment.
Other major complications of HSC transplantation include cytomegalovirus (CMV) infection and Epstein-Barr virus–associated lymphoproliferative disease (EBV-LPD).3 Delayed lymphocyte infusion of donor T cells can significantly contribute to the treatment of EBV-LPD.4,5 HS-tk–expressing GMCs, either administered together with the HSC graft or used as donor cells in delayed lymphocyte infusion, might also contribute to prevent or treat EBV-LPD.6
We have initiated phase 1/2 clinical studies to evaluate the toxicity of HS-tk–expressing GMC infusion and the possibility to control GVHD through GCV administration.7 In our first cohort of patients given escalating doses of HS-tk–expressing donor T cells with a bone marrow graft from an HLA-identical sibling, 3 of 12 patients developed EBV-LPD.8 Although these patients were at high risk of EBV-LPD (recipient age, intensive conditioning regimen, low T-cell dose, use of cyclosporine, and, in one patient, a second transplantation following antithymoglobulin treatment), we could not exclude a functional defect of GMCs. We observed that GMCs had an impaired potential to develop in vitro anti-EBV responses, resulting from both culture-dependent (early activation-induced cell death [AICD]) and G418 selection–dependent toxicities, toxicities preferentially restricted to anti-EBV T cells.9 We, therefore, examined whether a similar impairment occurred for another significant antiviral response after transplantation, namely anti-CMV reactivity. By analyzing and comparing in vitro anti-EBV versus anti-CMV GMC reactivity, we found that the ex vivo expansion and transduction/selection processes could have different consequences, depending on T-cell antigen specificities. Furthermore, we demonstrate that a different phenotype of CD8+ anti-EBV (EBV-T) and CD8+ anti-CMV T (CMV-T) cells may account, at least in part, for the observed differential ex vivo culture–induced behavior.
Materials and methods
Peripheral blood mononuclear cell isolation and subset selection
Whole blood was taken from HLA-A2– and/or HLA-B7–positive, EBV, and CMV double-seropositive healthy volunteer adult donors after informed consent had been given. Peripheral blood mononuclear cells (PBMCs) were isolated by Histopaque-1077 (Sigma, St Louis, MO) density gradient centrifugation. When indicated, a CD8+ immunomagnetic separation was performed with a CD8 MultiSort kit (Miltenyi Biotec, Paris, France) according to the manufacturer's recommendations. Briefly, cells were stained with CD8 microbeads and incubated in buffer at 4°C for 20 minutes. After washing, cells were separated on an LS column (Miltenyi Biotec). When indicated, a CD27+ immunomagnetic separation was performed with a CD27 monoclonal antibody (mAb) (Immunotech, Marseille, France) and goat-antimouse microbeads (Miltenyi Biotec) on an LS column. Samples were analyzed on a FACSCalibur flow cytometer (Becton Dickinson, Le Pont de Claix, France) using CellQuest Software (Becton Dickinson) to assess sample purity. Purity was more than 95% for CD8+ fractions and more than 90% for CD27+ and CD27– fractions.
Retroviral vectors
G1Tk1SvNa and SFCMM3 vectors have previously been described10 ; they were provided by GTI (Gaithersburg, MD) and by Molmed (Milano, Italy), respectively. Both are amphotropic retroviral vectors encoding the HS-tk gene under viral long terminal repeat (LTR) control and a selection gene (neomycine-phosphotransferase I and truncated NGF receptor [ΔLNGFR], respectively) under internal SV40 large T-antigen promotor control.
Preparation of gene-modified T cells with the G1Tk1SvNa vector
Generation of gene-modified T cells requires a 12-day culture, as previously described.9,11 After isolation by centrifugation over Histopaque-1077 and washes, PBMCs were resuspended in culture medium, consisting of RPMI 1640 medium (Biowhittaker, Emerainville, France), 10% vol/vol human serum (EFS Bourgogne/Franche-Comté, Besançon, France), and recombinant human interleukin 2 (IL-2; Cetus, Rueil Malmaison, France) at a final concentration of 500 IU/mL. Cells were activated by 10 ng/mL soluble CD3 mAb (OKT3; Jansen-Cilag, Levallois Perret, France) and incubated at 37°C, 5% CO2. After a 3-day culture, the cells were counted and transferred for 24 hours into the retroviral vector–containing medium supplemented with IL-2 (1000 IU/mL) and protamine sulfate (5 μg/mL; Sanofi-Winthrop, Gentilly, France). A cell aliquot was cultured in parallel without the retroviral vector. Twenty-four hours after initiation of transduction, cells were centrifuged, resuspended in culture medium, and incubated for 24 hours at 37°C, 5% CO2. From day 5 to day 12, positive selection was performed by culturing the transduced cells in a medium containing G418 (800 μg/mL; Sigma). Nontransduced, selected cells and nontransduced, nonselected cells (Co cells) were cultured in parallel in a medium with and without G418, respectively. At the end of selection (day 12), dead cells were removed by centrifugation over Histopaque-1077. Cell viability was assessed by the trypan blue dye exclusion assay. G418-resistant transduced cells are referred to as NeoR+ GMCs. Viable cells were washed twice with phosphate-buffered saline (PBS; Biowhittaker), resuspended in RPMI 1640 medium, 10% vol/vol human serum, and either used immediately for experiments or cryopreserved with 8% vol/vol dimethylsulphoxide (Braun, Boulogne, France) in liquid nitrogen.
Preparation of gene-modified T cells with the SFCMM3 vector
Cells were activated by soluble CD3 mAb + IL-2 and transduced as described earlier for G1Tk1SvNa vector. However, the G418-based selection was replaced by a positive magnetic-based selection at day 5 as follows: cells were stained with culture supernatant of antihuman NGF-R mAb-secreting hybridoma (HB8737, clone 20.4; ATCC, Manassas, VA), incubated with goat-antimouse immunoglobulin (IgG) (H+L) microbeads (Miltenyi Biotec), and positively selected with magnetic cell sorter (MACS; Miltenyi Biotec), following the manufacturer's instructions. Selected cells were cultured until day 12 in a culture medium with IL-2 (500 IU/mL). Positively selected transduced cells are referred to as ΔLNGFR+ GMCs. NeoR+ GMCs and ΔLNGFR+ GMCs contained similar amounts of T cells (approximately 95%), of which approximately 60% were CD8+, and approximately 5% were CD3–CD56+ natural killer (NK) cells.12
Flow cytometry
Monoclonal antibodies and major histocompatibility complex (MHC)/peptide tetramers. CD27-fluorescein isothiocyanate (FITC), CD27-phycoerythrin (PE), CD45RA-CyChrome, CD69-FITC mAbs, and goat antirat IgG-allophycocyanin (APC) antibodies were purchased from Becton Dickinson or BD PharMingen (San Diego, CA); CD8–phycoerythrincyanin 5 and CD45RA–energy-coupled dye (ECD) mAbs were purchased from Immunotech (Marseille, France); CD8 APC-Cy7 mAbs and goat anti-rat IgG-PE antibodies were purchased from Caltag Laboratories (Burlingame, CA). Anti-CCR7 rat IgG mAb 3D12 was provided by Drs. M. Lipp and R. Forster (Max Delbrück Institute, Berlin, Germany). Synthesis of PE- and APC-labeled HLA-A*0201 tetramer complexed with EBV- or CMV-derived peptides (lytic protein BMLF1 [GLCTLVAML], latent protein EBNA-3C [VLEETSVML], and IE1 early antigen [LLDFVRFMGV], pp65 late antigen [NLVPMVATV], respectively) was performed as previously described.13,14
Tetramer staining. Peripheral blood mononuclear cells or purified CD8+ cells from EBV- and CMV-double seropositive healthy individuals were stained with PE- or APC-labeled tetramers for 1 hour at room temperature in PBS, 0.2% bovine serum albumin (BSA), 50 μM EDTA (ethylenediaminetetraacetic acid) and incubated with appropriate mAbs for 20 minutes at 4°C. After washing, cells were immediately analyzed on a fluorescence-activated cell sorter (FACS) Vantage SE or a FACSCalibur flow cytometer using CellQuest software (Becton Dickinson). Analysis was gated on CD8+ lymphocytes. Cells (PBMC, Co, GMC) obtained from HLA-A2+ EBV- and/or CMV-seronegative donors were used as negative controls.
Cell death determination by annexin-V staining. After performing membrane staining with tetramers and appropriate mAbs, 1 × 10⁶ cells were incubated with 1 μL annexin-V–FITC (Immunotech) at 4°Cin500 μL final volume of binding buffer, following the manufacturer's recommendations. After incubation, cells were immediately analyzed by flow cytometry, without being washed or fixed.
CFSE staining. Cultured cells were washed in PBS at day 3 of culture and incubated (5 × 10⁶ cells/mL) for 10 minutes at room temperature in PBS containing 5 μM 5-carboxyfluorescein diacetate succinimidyl ester (CFSE; Molecular Probes, Leiden, the Netherlands). Cells were washed with 2 volumes human serum and then washed twice with PBS before being cultured until day 5. They were then labeled with tetramers and analyzed by flow cytometry. Results are expressed as the mean fluorescence intensity (MFI) of tetramer+ cells.
Enzyme-linked immunospot (ELISPOT) assay
The frequency of EBV-T and CMV-T cells was determined using a human interferon γ (IFN-γ) ELISPOT kit (Diaclone, Besançon, France), following the manufacturer's instructions. Briefly, a 96-well polyvinylidene fluoride (PDVF) flat-bottom plate was coated with a capture anti–IFN-γ mAb, incubated overnight at 4°C, and then washed 3 times with washing buffer. The plate was saturated with 2% skimmed dry milk for 2 hours at room temperature to block nonspecific adsorption and then emptied. Responder cells (100 000; PBMC, Co, GMC) were seeded with 105 irradiated (45 Gy) autologous PBMCs in the absence or presence of peptides (10 μg/well) in 200 μL RPMI 1640 medium, 10% vol/vol human serum and incubated at 37°C, 5% CO2 for 18 hours. The peptides used for HLA-A2–positive donors were identical to those used for tetramer production (see “Tetramer staining”). The peptides used for HLA-B7–positive donors were derived from CMV IE72 (CRVLCCYVL) and pp65 (TPRVTGGGAM and RPHERNGFTV) proteins. After washing, a biotinylated anti–IFN-γ mAb was incubated for 1.5 hours at 37°C. After 3 washes, streptavidin–alkaline phosphatase was added for 1 hour at 37°C. The plates were then washed extensively and revealed with a bromo-chloro-indoyl phosphate (BCIP) substrate. Individual IFN-γ–producing cells were detected as purple spots and counted by a KS ELISPOT Reader (Zeiss, Le Pecq, France). Results are expressed as the number of spots per 105 CD8+ cells, according to the following formula: (mean number of spots in stimulated wells – mean number of spots in unstimulated wells)/frequency of CD8+ cells among the seeded cells.
Statistical analysis
Statistical analysis was performed with SigmaStat software (Jandel Scientific, Erkrath, Germany). Data were compared using a paired Student t test or Mann-Whitney rank sum test, depending on Gaussian or non-Gaussian distribution of values.
Results
Viral complications in patients receiving allogeneic GMCs
We previously reported the occurrence of EBV-LPD in 3 of 12 patients given suicide gene-expressing GMCs with a T-cell–depleted bone marrow transplant (BMT) from an HLA-identical EBV-seropositive sibling donor.8 In view of our previous findings that GMC production was associated with reduced in vitro EBV reactivity of donor T cells,9 patients' GMCs may have failed to be protective against EBV. By contrast, none of the recipients of GMCs produced from CMV-seropositive donors developed CMV infection early after transplantation.8 This finding led us to investigate the effect of the gene transfer process on CMV reactivity, as compared with EBV reactivity.
Frequency of BMLF1 and pp65 tetramer-specific CD8+ T cells in GMCs
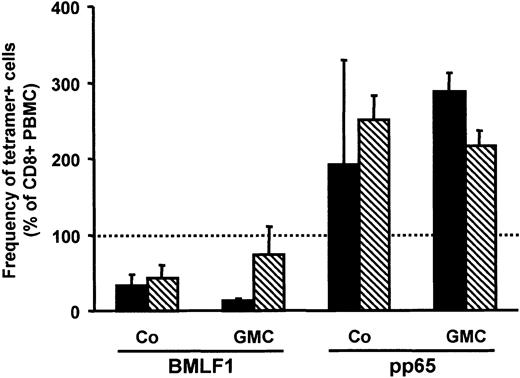
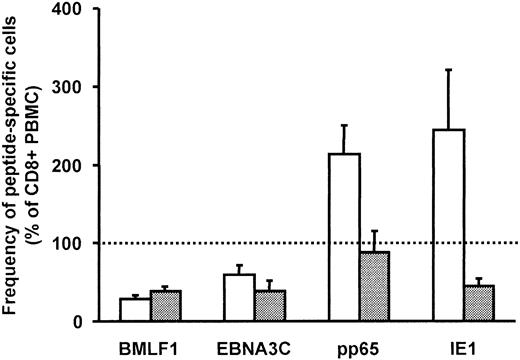
Peripheral blood mononuclear cells from HLA-A2–positive, EBV-, and/or CMV-seropositive volunteer donors were activated by soluble CD3 mAb and retrovirally transduced. Selection was performed as previously described, using either G418 for NeoR+ GMCs or immunomagnetic sorting for ΔLNGFR+ GMCs.9,11 The frequencies of EBV-T cells and CMV-T cells among PBMCs, Co cells, and GMCs were assessed by flow cytometry using fluorescent HLA-A2/BMLF1 and HLA-A2/pp65 tetramer staining. As previously described,9 the frequency of BMLF1-specific CD8+ T cells was lower in Co cells than in PBMCs (Figure 1) and even lower in G418-selected GMCs (Figure 1, black bars) but not in GMCs selected by immunomagnetic sorting (Figure 1, hatched bars). In contrast to BMLF1-specific CD8+ T cells, the frequency of pp65-specific CD8+ T cells was similar, or even higher, in Co cells or GMCs versus PBMCs (Figure 1). We extended our observations to other EBV and CMV epitopes by staining Co cells with HLA-A2/EBNA-3C or HLA-A2/IE1 tetramers. As observed for BMLF1, the frequency of EBNA-3C–specific CD8+ T cells was significantly lower (P = .0001 and P = .04, respectively), whereas, as observed for pp65, the frequency of IE1-specific CD8+ T cells was not significantly different in Co cells and in PBMCs (Figure 2, white bars).
Frequency of BMLF1- or pp65-specific cells among CD8+ GMCs or CD8+ Co cells. PBMCs, Co cells, and GMCs were stained with CD8-PC5 mAb and BMLF1 or pp65 tetramers to assess the percentage of tetramer+ cells among CD8+ cells. The frequency of tetramer+ cells within CD8+ PBMCs was set as the 100% reference (dotted line). Data are expressed as the variation (mean ± SE) of the percentage of tetramer+ cells in CD8+ GMCs or CD8+ Co cells, as compared with the CD8+ PBMC reference. ▪ indicates results obtained with G418-selected GMCs and their respective Co cells (n = 3); and ▧, results from NGFR-selected GMCs and their respective Co cells (n = 3).
Frequency of BMLF1- or pp65-specific cells among CD8+ GMCs or CD8+ Co cells. PBMCs, Co cells, and GMCs were stained with CD8-PC5 mAb and BMLF1 or pp65 tetramers to assess the percentage of tetramer+ cells among CD8+ cells. The frequency of tetramer+ cells within CD8+ PBMCs was set as the 100% reference (dotted line). Data are expressed as the variation (mean ± SE) of the percentage of tetramer+ cells in CD8+ GMCs or CD8+ Co cells, as compared with the CD8+ PBMC reference. ▪ indicates results obtained with G418-selected GMCs and their respective Co cells (n = 3); and ▧, results from NGFR-selected GMCs and their respective Co cells (n = 3).
Frequency of HLA-A2–restricted BMLF1, EBNA-3C, pp65, or IE1 peptide–specific cells among CD8+ Co cells. The frequency of tetramer+ cells or IFN-γ+ cells, evaluated by ELISPOT assay, within CD8+ PBMCs was set as the 100% reference (dotted line). Data are expressed as the variation of the percentage of tetramer+ (□) or IFN-γ+ (▦) cells in CD8+ Co cells, as compared with the CD8+ PBMC reference (mean ± SE of 13 experiments for BMLF1 and pp65 and 7 experiments for EBNA-3C and IE1).
Frequency of HLA-A2–restricted BMLF1, EBNA-3C, pp65, or IE1 peptide–specific cells among CD8+ Co cells. The frequency of tetramer+ cells or IFN-γ+ cells, evaluated by ELISPOT assay, within CD8+ PBMCs was set as the 100% reference (dotted line). Data are expressed as the variation of the percentage of tetramer+ (□) or IFN-γ+ (▦) cells in CD8+ Co cells, as compared with the CD8+ PBMC reference (mean ± SE of 13 experiments for BMLF1 and pp65 and 7 experiments for EBNA-3C and IE1).
Determination of EBV and CMV peptide–reactive cell frequencies using IFN-γ ELISPOT assay
To confirm phenotypic results, we performed IFN-γ ELISPOT functional assays. As previously reported,9 IFN-γ–secreting cell frequency was lower in Co cells than in PBMCs (P = .01) on BMLF1 peptide stimulation (Figure 2). In accordance with our tetramer staining results, EBNA-3C–reactive cell frequencies were lower in Co cells than in PBMCs (P = .03), whereas pp65-reactive cell frequencies remained overall unaffected. However, despite stable IE1 tetramer+ cell frequencies, IE1-reactive cell frequencies determined by IFN-γ ELISPOT assay were lower in Co cells (P = .03). Differences between phenotypical (tetramer staining) and functional (ELISPOT) assays have been reported when evaluating virus-specific T cells.15,16 These differences may be related, in our study, to differences between the expansion and survival potential of CMV-specific cells and their ability to secrete IFN-γ. We, therefore, extended our functional assay to other CMV-derived peptides. Results with 3 HLA-B7–restricted CMV peptides, derived from pp65 (TPR and RPH peptides) and IE-72 (CRV peptide) proteins, further strengthened our findings that ex vivo culture did not reduce the frequency of CMV-T cells (142% ± 53%, 138% ± 40%, and 202% ± 85% of PBMCs, respectively; n = 3). Because similar results were found with the different peptides derived from the same virus, further experiments were performed with one immunodominant peptide for each virus (BMLF1 for EBV and pp65 for CMV).
BMLF1-specific CD8+ T cells exhibit a lower relative cell expansion than pp65-specific CD8+ T cells
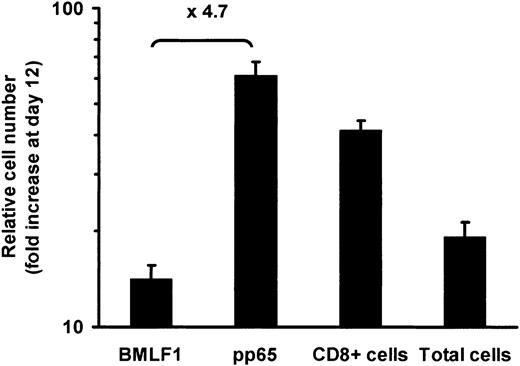
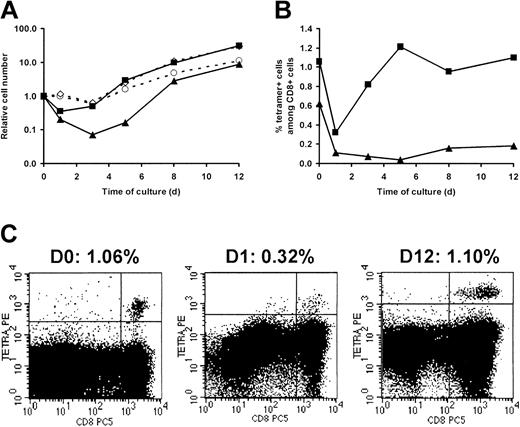
With the use of PBMCs from CMV- and EBV-double seropositive donors, we calculated the expansion rate of HLA-A2–restricted pp65- and BMLF1-specific CD8+ T cells over the culture period required to produce GMCs, ie from day 0 to day 12. As shown in Figure 3, the expansion at day 12 of pp65-specific CD8+ T cells was significantly (P = .023) higher than BMLF1-specific CD8+ T-cell expansion, whereas the expansion of total CD8+ T cells as well as total cell numbers usually occurred between the expansion of pp65- and that of BMLF1-specific CD8+ T cells. Kinetic studies revealed that absolute numbers of BMLF1- and pp65-specific CD8+ T cells decreased during the first days of culture. The decrease was greater for BMLF1-specific CD8+ T cells than for pp65-specific CD8+ T cells. Subsequently, both T-cell subsets increased with a persistent difference between them (Figure 4A). Similar findings were observed when examining the frequencies of BMLF1- or pp65-specific CD8+ T cells over the first days of culture (Figure 4B). However, after an initial decrease, the frequency of BMLF1-specific CD8+ T cells subsequently remained very low, whereas the frequency of pp65-specific CD8+ cells increased markedly, with day-12 levels similar to day-0 levels (Figure 4B). Representative profiles of HLA-A2/pp65 tetramer staining at different times of the culture are shown in Figure 4C.
Expansion of BMLF1- and pp65-specific CD8+ T cells from day 0 to day 12. BMLF1-specific, pp65-specific, CD8+, and total cell numbers were calculated from the percentage of tetramer+ and CD8+ cells and from cell numeration from day 0 to day 12 (mean ± SE, n = 8). The mean ratio of pp65-specific CD8+ T-cell expansion to BMLF1-specific CD8+ T-cell expansion is indicated on the graph.
Expansion of BMLF1- and pp65-specific CD8+ T cells from day 0 to day 12. BMLF1-specific, pp65-specific, CD8+, and total cell numbers were calculated from the percentage of tetramer+ and CD8+ cells and from cell numeration from day 0 to day 12 (mean ± SE, n = 8). The mean ratio of pp65-specific CD8+ T-cell expansion to BMLF1-specific CD8+ T-cell expansion is indicated on the graph.
Kinetics of BMLF1- and pp65-specific CD8+ T-cell expansion over a 12-day ex vivo culture. PBMCs from an HLA-A2+ double seropositive donor were activated by CD3 mAb and 500 UI/mL IL-2 (1 representative experiment of 5). At the indicated time, cells were stained with CD8-PC5 mAb and PE-labeled BMLF1 or pp65 tetramers. (A) Expansion of BMLF1-specific (▴), pp65-specific (▪), CD8+ (⋄), and total cells (○) was calculated over the 12-day culture as described for Figure 3. (B) Data are expressed as the percentage of BMLF1 (▴) and pp65 (▪) tetramer+ cells within CD8+ cells. (C) Flow cytometry profiles of pp65 tetramer staining at day 0, 1, and 12 of culture. The percentage of tetramer+ cells among CD8+ cells is indicated above each profile.
Kinetics of BMLF1- and pp65-specific CD8+ T-cell expansion over a 12-day ex vivo culture. PBMCs from an HLA-A2+ double seropositive donor were activated by CD3 mAb and 500 UI/mL IL-2 (1 representative experiment of 5). At the indicated time, cells were stained with CD8-PC5 mAb and PE-labeled BMLF1 or pp65 tetramers. (A) Expansion of BMLF1-specific (▴), pp65-specific (▪), CD8+ (⋄), and total cells (○) was calculated over the 12-day culture as described for Figure 3. (B) Data are expressed as the percentage of BMLF1 (▴) and pp65 (▪) tetramer+ cells within CD8+ cells. (C) Flow cytometry profiles of pp65 tetramer staining at day 0, 1, and 12 of culture. The percentage of tetramer+ cells among CD8+ cells is indicated above each profile.
Apoptosis of BMLF1-specific CD8+ T cells is higher than that of pp65-specific CD8+ T cells
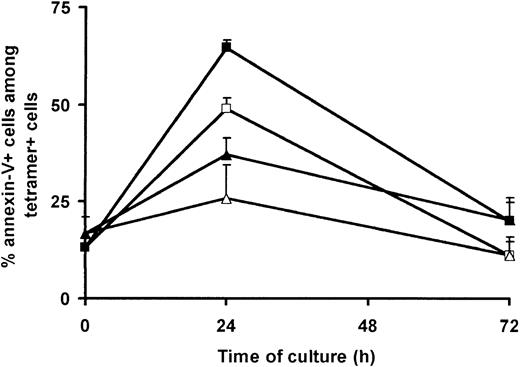
Culture-dependent loss of BMLF1-specific CD8+ T cells results, at least in part, from a preferential apoptosis of these cells, occurring early (ie, within the first 3 days) after CD3 mAb-induced PBMC activation.9 As we observed an initial decrease of pp65-specific CD8+ T-cell frequency, but no loss at day 12, we hypothesized that pp65-specific CD8+ T cells were not prone to such early apoptosis. To explore this hypothesis, we combined tetramer-PE staining with annexin-V–FITC staining to assess the percentage of apoptotic cells among BMLF1- and pp65-specific CD8+ T cells using EBV- and CMV-double seropositive donors. As previously shown by us,9 the spontaneous (ie, in the absence of activation) apoptosis of BMLF1-specific CD8+ T cells increased after 24 hours of culture (48.9% ± 2.8% annexin-V+ cells) and decreased thereafter (Figure 5). Moreover, after CD3 mAb activation, the fraction of apoptotic BMLF1-specific CD8+ T cells was further increased at day 1 (64.6% ± 2.0% annexin-V+ cells), thus demonstrating the induction of AICD (nonactivated versus CD3-activated cultures, P = .025). Spontaneous apoptosis and CD3 mAb-induced apoptosis of pp65-specific CD8+ T cells followed the same kinetics as BMLF1-specific CD8+ T cells, but to a lower extent (nonactivated versus CD3-activated cultures, P = .096). The CD3 mAb-induced apoptosis of pp65-specific CD8+ T cells (37.0% ± 4.5% annexin-V+ cells at day 1) was significantly lower than that of BMLF1-specific CD8+ T cells (P = .006) and was similar to the CD3 mAb-induced apoptosis of IE1-specific CD8+ T cells (48.8% ± 11.1% annexin-V+ cells at day 1) or, as previously reported, to the apoptosis observed in the overall CD8+ T cell population.9
Spontaneous and activation-induced cell death of BMLF1- and pp65-specific CD8+ T cells. PBMCs from HLA-A2+ double seropositive donors were cultured in the absence (white symbols) or presence (black symbols) of CD3 mAb and 500 UI/mL IL-2. At the indicated time, cells were stained with annexin-V–FITC, CD8-PC5 mAb, and PE-labeled BMLF1 (squares) or pp65 (triangles) tetramers. Data are expressed as the percentage of annexin-V+ cells within the tetramer+ cells (mean ± SE, n = 5).
Spontaneous and activation-induced cell death of BMLF1- and pp65-specific CD8+ T cells. PBMCs from HLA-A2+ double seropositive donors were cultured in the absence (white symbols) or presence (black symbols) of CD3 mAb and 500 UI/mL IL-2. At the indicated time, cells were stained with annexin-V–FITC, CD8-PC5 mAb, and PE-labeled BMLF1 (squares) or pp65 (triangles) tetramers. Data are expressed as the percentage of annexin-V+ cells within the tetramer+ cells (mean ± SE, n = 5).
Relationship between CD69 expression by BMLF1-specific CD8+ T cells and sensitivity to AICD
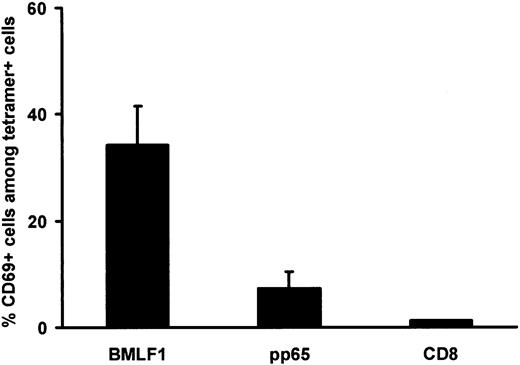
Because the apoptosis of BMLF1-specific CD8+ T cells was mostly activation induced, we performed a double staining of fresh PBMCs with tetramers and an early activation marker, CD69. As shown in Figure 6, CD69 expression was significantly higher among BMLF1-specific CD8+ T cells (34.2% ± 7.4%) than among pp65-specific CD8+ T cells (7.3% ± 3.1%, P = .03) or than among total CD8+ T cells (1.2% ± 0.1%, P = .01 versus BMLF1). Bulk cultured cell analysis showed that 17.6% ± 4.1% of CD8+ CD69– T cells were annexin-V positive 24 hours after CD3 mAb activation, versus 53.5% ± 7.0% (P = .04) of annexin-V–positive cells within the small CD8+CD69+ subset (1.2% ± 0.1% of CD8+ cells), thus demonstrating that recently activated (CD69+) T cells in vivo are more susceptible to AICD than CD69–CD8+ T cells. Altogether, these results suggest that BMLF1-specific CD8+ T cells may be more sensitive to AICD than pp65-specific CD8+ T cells because of their recent activation status, as attested by their higher level of CD69 expression.
CD69 expression by BMLF1- and pp65-specific CD8+ T cells at initiation of culture. Percentage of CD69+ cells within BMLF1-specific, pp65-specific, and total CD8+ T cells. Staining was performed on PBMCs from EBV- and CMV-seropositive HLA-A2 donors (mean ± SE, n = 5).
CD69 expression by BMLF1- and pp65-specific CD8+ T cells at initiation of culture. Percentage of CD69+ cells within BMLF1-specific, pp65-specific, and total CD8+ T cells. Staining was performed on PBMCs from EBV- and CMV-seropositive HLA-A2 donors (mean ± SE, n = 5).
BMLF1- and pp65-specific CD8+ T cells exhibit a different cell surface phenotype
We examined whether the differential behavior of anti-BMLF1 and anti-pp65 cells could be related to their phenotype. Both types of cells are expected to be memory and/or effector cells.17 Different cell surface phenotypes have been ascribed to naive, memory, and effector CD8+ T cells. A direct phenotypic comparison of BMLF1- and pp65-specific CD8+ T cells has not yet, to our knowledge, been reported. Most reported studies are based on different cell surface marker combinations and especially different EBV-versus CMV-seropositive donors. We thus directly compared CD8+ EBV-T and CMV-T cell phenotype within 8 EBV-/CMV-double seropositive donors by combining BMLF1 or pp65 tetramer staining with a CD8/CD45RA/CD27/CCR7 staining. This comparison allowed us to analyze the frequency of either (1) CD45RA+CCR7+ (naive phenotype), CD45RA–CCR7+ (central memory, Tcm), CD45RA–CCR7– (effector memory, Tem), and CD45RA+CCR7– (effector) CD8 T cells18 or (2) CD45RA+CD27+ (naive phenotype), CD45RA–CD27+ and CD45RA–CD27– (referred to as memory and/or effector memory), and CD45RA+CD27– (effector) CD8 T cells.19
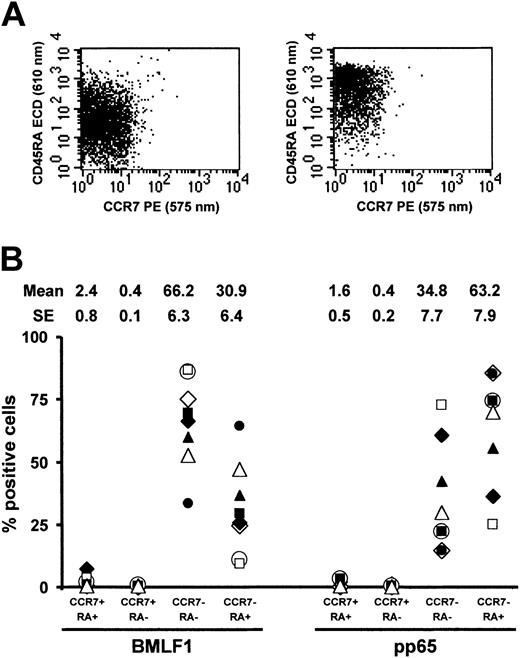
As shown in Figure 7, BMLF1-specific T cells were predominantly CD45RA–CCR7– Tem cells (66.2% ± 6.3%), whereas most of the remaining cells were CD45RA+CCR7– effector cells (30.9% ± 6.4%). By contrast, pp65-specific T cells were mainly CD45RA+CCR7– effector cells (63.2% ± 7.9%), whereas most of the remaining cells were CD45RA–CCR7– Tem cells (34.8% ± 7.7%). BMLF1- and pp65-specific CD8+ T cells were thus significantly different in terms of CD45RA–CCR7– cell (P = .006) and CD45RA+CCR7– cell frequencies (P = .003).
CD45RA and CCR7 coexpression by BMLF1- and pp65-specific CD8+ T cells. (A) Representative profiles of CD45RA and CCR7 coexpression by BMLF1 tetramer+ (left panel) and pp65 tetramer+ (right panel) CD8+ cells. (B) Percentage of CD45RA+CCR7+, CD45RA–CCR7+, CD45RA–CCR7–, and CD45RA+CCR7– cells among BMLF1- and pp65-specific CD8+ T cells from 8 EBV- and CMV-seropositive HLA-A2 donors.
CD45RA and CCR7 coexpression by BMLF1- and pp65-specific CD8+ T cells. (A) Representative profiles of CD45RA and CCR7 coexpression by BMLF1 tetramer+ (left panel) and pp65 tetramer+ (right panel) CD8+ cells. (B) Percentage of CD45RA+CCR7+, CD45RA–CCR7+, CD45RA–CCR7–, and CD45RA+CCR7– cells among BMLF1- and pp65-specific CD8+ T cells from 8 EBV- and CMV-seropositive HLA-A2 donors.
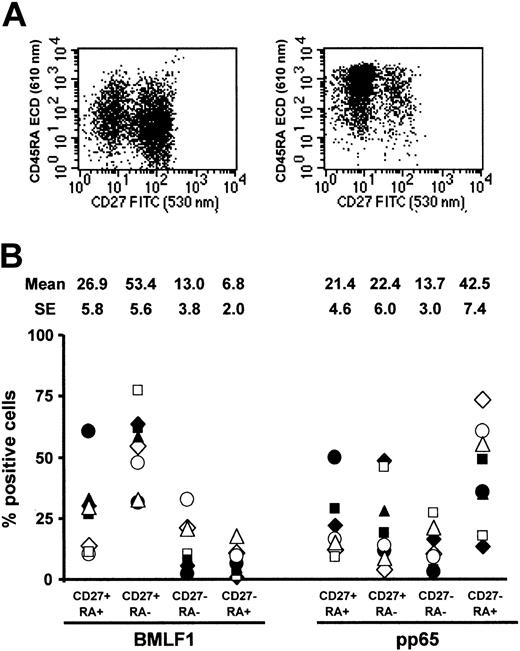
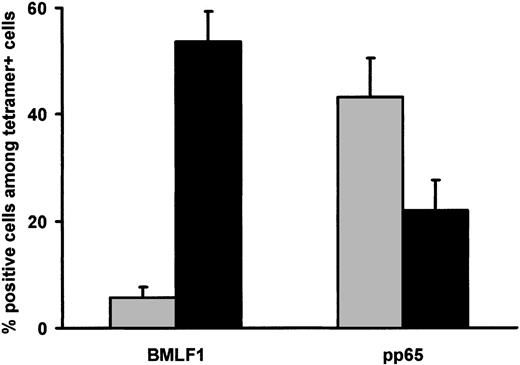
BMLF1-specific T cells were mainly CD45RA–CD27+ memory cells (53.4% ± 5.6%) (Figure 8), whereas remaining cells were mainly CD45RA–CD27– cells (13.0% ± 3.8%) and CD45RA+ CD27– cells (6.8% ± 2.0%). By contrast, CD45RA–CD27+, CD45RA–CD27–, and CD45RA+CD27– cells represented, respectively, 22.4% ± 6.0%, 13.7% ± 3.0%, and 42.5% ± 7.4% of pp65-specific CD8+ T cells. BMLF1- and pp65-specific CD8+ T cells were thus significantly different in terms of CD45RA–CD27+ memory cell (P = .0001) and CD45RA+CD27+ effector cell frequencies (P = .001). Finally, combined CCR7 and CD27 staining (Figure 9) demonstrated that the majority of BMLF1-specific CD8+ T cells (53.6% ± 5.7%) exhibited a CD45RA–CCR7–CD27+ phenotype, whereas a large fraction of the pp65-specific CD8+ T cells (43.2% ± 7.2%) were CD45RA+CCR7–CD27– terminal effector cells (P < .0004).
CD45RA and CD27 coexpression by BMLF1- and pp65-specific CD8+ T cells. (A) Representative profiles of CD45RA and CD27 coexpression by BMLF1 tetramer+ (left) and pp65 tetramer+ (right) CD8+ cells. (B) Percentage of CD45RA+CD27+, CD45RA–CD27+, CD45RA–CD27–, and CD45RA+CD27– cells among BMLF1- and pp65-specific CD8+ T cells from 8 EBV- and CMV-seropositive HLA-A2 donors.
CD45RA and CD27 coexpression by BMLF1- and pp65-specific CD8+ T cells. (A) Representative profiles of CD45RA and CD27 coexpression by BMLF1 tetramer+ (left) and pp65 tetramer+ (right) CD8+ cells. (B) Percentage of CD45RA+CD27+, CD45RA–CD27+, CD45RA–CD27–, and CD45RA+CD27– cells among BMLF1- and pp65-specific CD8+ T cells from 8 EBV- and CMV-seropositive HLA-A2 donors.
CD45RA, CCR7, and CD27 expression by BMLF1- and pp65-specific CD8+ T cells at initiation of culture. Percentage of CD45RA–/CCR7–/CD27+ (▪) and CD45RA+/CCR7–/CD27– cells (▦) within BMLF1-specific and pp65-specific CD8+ T cells from EBV- and CMV-seropositive HLA-A2 donors (mean ± SE, n = 8).
CD45RA, CCR7, and CD27 expression by BMLF1- and pp65-specific CD8+ T cells at initiation of culture. Percentage of CD45RA–/CCR7–/CD27+ (▪) and CD45RA+/CCR7–/CD27– cells (▦) within BMLF1-specific and pp65-specific CD8+ T cells from EBV- and CMV-seropositive HLA-A2 donors (mean ± SE, n = 8).
Relationship between the CD8+ T-cell differentiation phenotype and cell behavior during culture
Because (1) BMLF1- and pp65-specific CD8+ T cells exhibited a different sensitivity to apoptosis and (2) they were associated mainly with CD45RA–CCR7–CD27+ and CD45RA+CCR7–CD27– subsets, respectively, we examined whether a CD45RA/CCR7/CD27 phenotype was correlated with increased sensitivity to early apoptosis. Highly purified (> 98%) CD8+ cells were activated by soluble CD3 mAb + IL-2 and stained 24 hours later with annexin-V and CD27, CD45RA, and CCR7 mAbs. Apoptosis was found to be similar in the CD8+CD45RA–CCR7–CD27+ subset (33.7% ± 3.8% annexin-V+ cells) and in the CD8+CD45RA+CCR7–CD27– subset (36.3% ± 7.2% annexin-V+ cells), thus suggesting that a differential CD45RA and/or CD27 expression was not associated with a differential sensitivity to AICD.
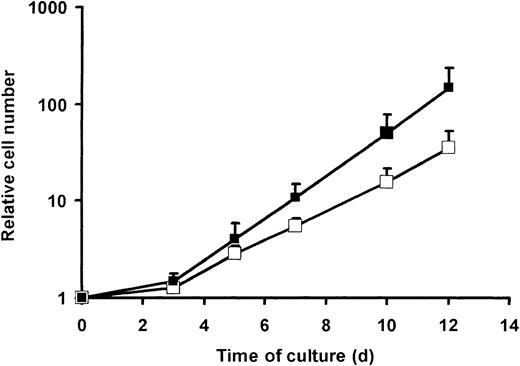
The second parameter accounting for a maintained CMV reactivity in GMCs was a higher expansion of pp65-specific CD8+ T cells (mostly CD27–) as compared with BMLF1-specific CD8+ T cells (mostly CD27+) (Figures 3, 4). To broaden our observations, bulk-purified CD27– and CD27+ T cells were activated by CD3 mAb plus IL-2. CD27– cells had a similar or even lower proliferation than did CD27+ cells, as assessed by thymidine incorporation after 3 days (41 ± 11 × 103 versus 44 ± 22 × 103 cpm, respectively, n = 2) or 5 days (32 ± 2 × 10³ versus 52 ± 5 × 10³ cpm, respectively, n = 2) of culture. By contrast, when cells were enumerated later (ie, at day 12), a constantly higher cell expansion rate of CD8+CD27– T cells versus CD8+CD27+ T cells was observed (Figure 10). This result is in agreement with the higher expansion of pp65-specific CD8+ T cells than BMLF1-specific CD8+ T cells illustrated in Figures 3, 4.
Expansion of CD8+CD27+ and CD8+CD27– cells from day 0 to day 12. CD27+ cells were immunomagnetically purified from PBMCs, and the CD27+ (□) and CD27– (▪) fractions were activated by CD3 mAb and cultured in the presence of 500 UI/mL IL-2 until day 12. At the indicated time, cells were stained with CD8-PC5 and numerated to determine relative cell number (mean ± SE, n = 5).
Expansion of CD8+CD27+ and CD8+CD27– cells from day 0 to day 12. CD27+ cells were immunomagnetically purified from PBMCs, and the CD27+ (□) and CD27– (▪) fractions were activated by CD3 mAb and cultured in the presence of 500 UI/mL IL-2 until day 12. At the indicated time, cells were stained with CD8-PC5 and numerated to determine relative cell number (mean ± SE, n = 5).
Balance between cell death and cell division determines the differential expansion rate of BMLF1- and pp65-specific CD8+ T cells
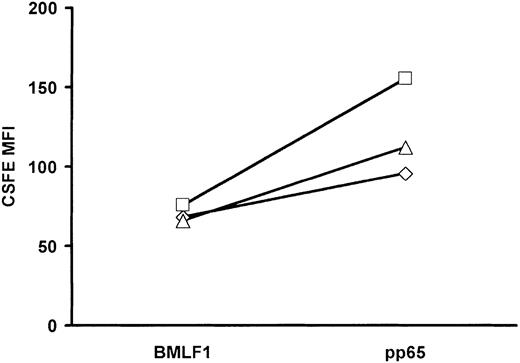
The higher apoptosis rate among BMLF1-specific CD8+ T cells versus pp65-specific CD8+ T cells (Figure 5) may have resulted in the differential cell loss observed during the first 3 days of culture (Figure 4A). To explain the subsequent expansion of pp65-specific CD8+ T cells, we hypothesized that pp65-specific CD8+ T cells that had escaped early apoptosis may have had a higher cell division rate than BMLF1-specific CD8+ T cells. Alternatively, both subsets may be equally proliferating with a higher cell death of BMLF1-specific CD8+ T cells as cell division occurs. In this case, BMLF1-specific CD8+ T cells might accumulate less rapidly than pp65-specific CD8+ T cells, thus resulting in a lower expansion rate. To discriminate between these 2 hypotheses, CD3 mAb-activated cells were stained with CFSE at day 3 of culture and stained for BMLF1 or pp65 tetramer at day 5 of culture. As shown in Figure 11, the MFI of CFSE-labeled BMLF1-specific CD8+ T cells was lower at day 5 than the MFI of CFSE-labeled pp65-specific CD8+ T cells, suggesting that BMLF1-specific CD8+ T cells divide more rapidly than pp65-specific CD8+ T cells. This result, when combined with higher numbers of pp65-specific CD8+ T cells at day 12, suggests that BMLF1-specific CD8+ T cells die rapidly throughout the 12-day culture.
Mean fluorescence intensity of CSFE-labeled BMLF1- and pp65-specific CD8+ T cells at day 5 of culture. CD3-activated cells were labeled at day 3 of culture with CSFE and cultured until day 5. Co cells were then stained with BMLF1 or pp65 tetramers. Data indicate the MFI of CSFE labeling within tetramer+ cells from 3 donors.
Mean fluorescence intensity of CSFE-labeled BMLF1- and pp65-specific CD8+ T cells at day 5 of culture. CD3-activated cells were labeled at day 3 of culture with CSFE and cultured until day 5. Co cells were then stained with BMLF1 or pp65 tetramers. Data indicate the MFI of CSFE labeling within tetramer+ cells from 3 donors.
Discussion
The administration of suicide gene-expressing GMCs is a promising approach to control alloreactivity after HSC transplantation. In this setting, the immune function of infused GMCs, especially their antiviral reactivity, is of crucial importance. We have previously established that the gene transfer process could significantly reduce the frequency of EBV-T cells in GMCs as compared with PBMCs and control cultured (Co) cells. Two critical events are responsible for the loss of EBV-T cells during GMC production: (1) early sensitivity to AICD during the first 3 days of culture, and (2) toxicity of G418 on NeoR+ EBV-T GMCs during selection.
To further explore the antiviral reactivity of ex vivo gene-modified T cells, we analyzed in parallel GMC and Co cell reactivity to another relevant virus in transplantation, CMV, using peptides derived from early (IE1, IE72) and late (pp65) CMV antigens. Our results demonstrate that, using either tetramer staining or ELISPOT assay, CMV-specific CD8 T-cell frequencies were not altered in the course of GMC preparation, very much unlike what was observed with EBV-T cells.
As previously reported for BMLF1-specific CD8+ T cells,9 we observed that initial CD3 mAb stimulation induced pp65-specific CD8+ T-cell apoptosis but to a lower extent. The initial loss of pp65-specific cells was thus lower than the loss of BMLF1-specific CD8+ T cells, and the subsequent expansion of cells that had escaped early apoptosis was higher in the pp65-specific subset than in the BMLF1-specific subset. Moreover, whereas G418 selection (and not immunomagnetic selection) has been shown to further enhance the loss of BMLF1-specific transduced T cells, neither the transduction nor the G418 selection process was harmful to pp65-specific transduced T cells, as Co cells and GMCs selected with either G418 or immunomagnetic sorting had similar pp65-specific T-cell frequencies.
We examined whether the differential behavior of pp65-versus BMLF1-specific CD8+ T cells during ex vivo culture was related to phenotypical differences. The combination of CD45RA and CCR7 markers allowed us to discriminate 4 CD8+ populations that developed consecutively in the course of CD8+ differentiation18 : (1) CD45RA+CCR7+ naive cells, (2) CD45RA–CCR7+ Tcm cells, (3) CD45RA–CCR7– Tem cells, and (4) CD45RA+CCR7– cytotoxic effector cells. Another marker combination, involving CD45RA and CD27, has also been used to describe the phenotypes of CD45RA+CD27+ (naive), CD45RA–CD27+ (memory), CD45RA–CD27– (undefined memory and/or effector), and CD45RA+CD27– (effector) cells. A sequential loss of CD45RA, CCR7, and CD27 during the transition from naive to effector/memory cells and finally a re-expression of CD45RA by terminal effector cells have been described.19-21
On the basis of these findings, we combined CD45RA, CD27, and CCR7 markers and established that pp65-specific CD8+ T cells exhibited a different, more differentiated, phenotype than BMLF1-specific CD8+ T cells: the former were mainly CD45RA+CCR7–CD27– terminal effector cells (as has recently been described by van Leeuwen et al22 ), whereas the latter were mainly CD45RA–CCR7–CD27+ cells. These cells might be considered as early Tem, ie, Tem cells (CD45RA–CCR7–) at an early stage of differentiation (CD27+). These results are in agreement with recent reports demonstrating different cell phenotypes depending on the antigenic specificity of antiviral cells.16,17,21,23-25
As BMLF1-specific CD8+ T cells had a higher overall apoptosis sensitivity than pp65-specific CD8+ T cells, we tried to correlate this sensitivity to their phenotypes. The phenotypic differences between BMLF1-versus pp65-specific CD8+ T cells were not associated with the differences in apoptosis occurring after CD3 mAb activation in BMLF1-specific CD8+ T cells versus pp65-specific CD8+ T cells. We did not find any significant differences in terms of apoptosis levels between bulk CD8+ early Tem cells (that contain most of the BMLF1-specific T cells) and bulk CD8+ effector cells (that contain most of the pp65-specific T cells). However, the level of ex vivo CD69 expression could be a parameter contributing to the differential sensitivity to apoptosis. In agreement with Catalina et al,26 we found that BMLF1-specific fresh CD8+ cells frequently expressed the early activation marker CD69. A novel finding was a significantly higher frequency of CD69+ cells within BMLF1-specific fresh CD8+ T cells than within pp65-specific CD8+ T cells or tetramer-negative cells. We also found that the small CD69+ fraction among bulk fresh CD8+ T cells was more sensitive to AICD than CD69–CD8+ T cells.
We noted another difference between pp65- and BMLF1-specific CD8+ T cells: the former had a higher expansion rate during the 12 days of ex vivo culture than the latter. In addition, this difference correlated with their phenotypic differences: CD27-purified T cells (containing most of the pp65-specific T cells) showed higher expansion rates after CD3 mAb activation than did CD27+-purified T cells (that contain most of the BMLF1-specific T cells). These results were rather unexpected, because terminally differentiated effector cells are usually considered to have a low proliferative potential as well as a weaker division potential than memory cells.16,27,28 Such discrepancy with previous reports may be related to the methodology used to evaluate T-cell expansion. In our hands, CD27– cell proliferation, evaluated after 3 to 5 days of culture by thymidine incorporation, was similar or even lower than CD27+ cell proliferation, a finding in agreement with other studies.19 By contrast, cell numeration performed on day 12 showed that the CD27– subset had a significantly higher expansion rate than the CD27+ subset.
In accordance with the early Tem phenotype of BMLF1-specific CD8+, CFSE staining established that such EBV-T cells had a higher division rate than pp65-specific CD8+ T cells. One hypothesis is that pp65-specific CD8+ T cells might accumulate more efficiently during culture, despite exhibiting a slower cell division rate than BMLF1-specific CD8+ T cells, because of reduced sensitivity to apoptosis. Although definitive demonstration is still lacking, this hypothesis is further supported by a recent report by van Leeuwen et al,22 establishing that pp65-specific CD8+ T cells can expand in vitro.
Other cell culture–related parameters may also affect cell proliferation, such as nature of initial activation or length of culture.9,29 The type and concentration of cytokines used during GMC preparation may also be relevant in this respect. CD45RA–CD27+ cells, unlike CD45RA+CD27– cells, secrete IL-2 on polyclonal stimulation.19 Thus, in the presence of low exogenous IL-2 concentrations, autocrine IL-2 secretion by CD45RA–CD27+ cells might favor their expansion at the expense of CD45RA+CD27– cell expansion. By contrast, in the presence of high exogenous IL-2 concentrations, as used in our culture conditions, IL-2 might not be a limiting factor, thereby allowing for the preferential expansion of CD45RA+CD27– cells (containing most of the pp65-specific T cells) over the CD45RA–CD27+ cells (containing most of the BMLF1-specific T cells). This hypothesis is further substantiated by the observation that CMV reactivity can be lost when CD3 mAb-stimulated T cells are expanded in the presence of low IL-2 concentrations (25-50 UI/mL).30
Associating IL-2 to other cytokines, such as IL-7 or IL-15, or CD3 mAb with other costimulatory signals, such as CD28 or CD137, may also be relevant to selectively drive the ex vivo survival and expansion of naive or memory cells.31-35 In this respect, we found that CD28 costimulation improved the expansion of CD8+CD27+ cells (mainly CD28+) as compared with the expansion of CD8+CD27– cells (mainly CD28–) (data not shown). Such a finding is in agreement with our previous study reporting that replacing initial CD3 activation by CD3/CD28 costimulation limited the loss of EBV-T cells.9
Overall, ex vivo T-cell culture differentially affects apoptosis, long-term proliferation, and overall survival of CMV-T and EBV-T cells. Such findings reveal significant functional differences between EBV-T cells and CMV-T cells which need to be taken into account when designing cell and/or gene therapy protocols involving ex vivo T-cell manipulation. Optimal cell culture conditions may differ depending on the antigenic specificity of GMCs.
Prepublished online as Blood First Edition Paper, May 1, 2003; DOI 10.1182/blood-2002-11-3407.
Supported by the Programme Hospitalier de Recherche Clinique (PHRC 2000 no. RC39), the Association Française contre la Myopathie, and the Ministère de l'Enseignement Supérieur et de la Recherche (Centre Réseau de Développement des Thérapies Géniques [CRTG]), the Association pour la Recherche sur le Cancer (grants 4350 and 7665), the Ligue contre le Cancer, Comité du Doubs, and the European Community (Biomed contracts CT97-2074 and QLK3-CT-2001-01265). P.M. has benefited from a grant from the Ligue Contre le Cancer, Comité du Doubs.
The publication costs of this article were defrayed in part by page charge payment. Therefore, and solely to indicate this fact, this article is hereby marked “advertisement” in accordance with 18 U.S.C. section 1734.
We thank the immunology laboratory, particularly Mrs Agnès Lienard and Mr Pascal Batard for their helpful assistance in flow cytometry, and Mrs Jackie Kerveillant for editorial assistance.

This feature is available to Subscribers Only
Sign In or Create an Account Close Modal