Abstract
Human Vα24+Vβ11+ natural killer T (NKT) cells are a distinct CD1d-restricted lymphoid subset specifically and potently activated by α-galactosylceramide (α-GalCer) (KRN7000) presented by CD1d on antigen-presenting cells. Preclinical models show that activation of Vα24+Vβ11+ NKT cells induces effective antitumor immune responses and potentially important secondary immune effects, including activation of conventional T cells and NK cells. We describe the first clinical trial of cancer immune therapy with α-GalCer–pulsed CD1d-expressing dendritic cells. The results show that this therapy has substantial, rapid, and highly reproducible specific effects on Vα24+Vβ11+ NKT cells and provide the first human in vivo evidence that Vα24+Vβ11+ NKT cell stimulation leads to activation of both innate and acquired immunity, resulting in modulation of NK, T-, and B-cell numbers and increased serum interferon-γ. We present the first clinical evidence that Vα24+Vβ11+ NKT cell memory produces faster, more vigorous secondary immune responses by innate and acquired immunity upon restimulation.
Introduction
Human Vα24+Vβ11+ natural killer T (NKT) cells are a distinct CD1d-restricted lymphoid subset specifically activated and induced to proliferate by α-galactosylceramide (α-GalCer) (KRN7000) presented by CD1d on antigen-presenting cells (APCs), including dendritic cells (DCs) and monocyte-derived DCs (MoDCs).1-5 Preclinical murine in vivo and human in vitro data suggest NKT cell activation may be therapeutic for human malignancy.6,7 NKT cells have direct antitumor cytotoxicity, dependent on and independent of target CD1d expression,8 and antiproliferative actions9 that may contribute to clinical antitumor activity.
Potentially critical for successful human tumor eradication are secondary immune effects, including cytokine release9,10 and activation of conventional T cells11 and NK cells12-17 resulting from the hypothesized pivotal role of NKT cells in bridging, coordinating, and activating innate and acquired immunity.11
A human clinical study showed that direct intravenous administration of α-GalCer results in disappearance of peripheral blood (PB) NKT cells within 24 hours, and with multiple administrations at weekly intervals, NKT cell numbers remain below pretreatment levels.18 Furthermore, it has been demonstrated in murine models that administration of α-GalCer–pulsed DCs has more potent antitumour activities than direct administration of α-GalCer alone.19 In addition to their essential role in NKT cell activation, DCs may have a crucial intermediary role in secondary immune effects of activated NKT cells as the latter alter DC functions, including cytokine production.20,21 In view of these earlier murine and clinical studies and to confirm the proposed key immune-activating activities of NKT cells, we have undertaken a clinical phase 1 study to determine the effects of α-GalCer–pulsed DCs in human subjects. We evaluated clinical and immunologic effects of α-GalCer–pulsed MoDCs administered at 2-week intervals to 12 human subjects with metastatic malignancy.
Materials and methods
Overview of study design
The study was a phase 1, open-labeled clinical study involving 12 patients with metastatic malignancy (Table 1). Subjects received a median of 5 × 10⁶ CD1d-expressing immature MoDCs generated from plastic adherent monocytes cultured with interleukin 4 (IL-4) and granulocytemacrophage colony-stimulating factor (GM-CSF). Subjects involved in another of our studies with metastatic malignancy (n = 3) receiving therapy with MoDCs prepared with the use of identical protocols, but with addition of tumor lysate or tumor-specific peptides rather than α-GalCer, were used as controls but had less extensive immunologic evaluations than for the study described here. One subject (KS103) received 2 series of treatments with KRN7000-pulsed MoDCs, several months apart, and subsequently (6 months later) a series of treatments with tumor lysate–pulsed MoDCs. Protocols were based on those previously described22 with our minor modifications,23 except that 100 ng/mL α-GalCer was added to cultures for 24 hours prior to administration. The phenotypes of MoDCs administered were CD3–, CD19–, CD14–, CD86+, CD83 (weak), CD40+, and HLA-DR (strongly positive). The study had research ethics committee approval from the Queensland Institute of Medical Research, the University of Queensland, and the Royal Brisbane Hospital, and subjects provided written informed consent.
Patient characteristics and clinical status
Study no. . | Age, y . | Sex . | Diagnosis . | Site of malignancy at enrollment . | Prior therapy . | Baseline NKT cell level, × 106/L . |
|---|---|---|---|---|---|---|
| KS101 | 53 | F | Breast cancer | Bones, liver, lung | S,R,H | 1.3 |
| KS102 | 61 | M | Colon cancer | Colon, retroperitoneum | S,R,C | 0.15 |
| KS103 | 27 | F | Liver cancer | Liver, lungs | S | 13.3 |
| KS104 | 64 | M | Melanoma | Subcutaneous, liver | S, I | 0.50 |
| KS202 | 64 | M | Melanoma | Lungs | S | 1.72 |
| KS203 | 39 | M | Peritoneal adenocarcinoma | Peritoneum | S | 1.54 |
| KS204 | 57 | M | Renal cell carcinoma | Lungs, kidney, liver | S, R | 12.79 |
| KS205 | 51 | M | Peritoneal adenocarcinoma | Peritoneum | I | 1.23 |
| KS301 | 65 | M | Prostate carcinoma, plus renal cell carcinoma | Prostate, bones, lymph nodes, kidney | H, S | 0.7 |
| KS302 | 33 | M | Lung adenocarcinoma | Lungs, mediastinum, bones | C | 0.8 |
| KS303 | 49 | M | Renal cell carcinoma | Lungs, mediastinum, adrenal gland | S | 1.17 |
| KS304 | 47 | F | Lung adenocarcinoma | Lungs, mediastinum, bones, liver | C | 1.14 |
S indicates surgery; R, radiotherapy; H, hormonal antineoplastic therapy; C, chemotherapy; and I, immunotherapy.
Immunologic monitoring
Immunophenotype. Immunologic monitoring included immunophenotyping of PB by 3-color flow cytometry to determine relative numbers and with the use of automated full blood counts (FBCs), absolute concentrations of NKT cells (Vα24+Vβ11+CD3+), T-cell subsets (CD3+CD4+ or CD3+CD8+), NK cells (CD3-CD56+), and B cells (CD19+). Antibodies were anti-Vα24 T-cell receptor (TCR) fluorescein isothiocyanate (FITC) (immunoglobulin G1) IgG1,Vβ11 TCR phycoerythrin (PE) IgG2a, anti-CD3 phycoerythrin cyanin 5 (PC5) IgG1 for NKT cell assessment, and anti-CD3 FITC IgG1, anti-CD4 PE) IgG1, anti-CD8 PC5) IgG1, anti-CD56 PC5 IgG1, and anti-CD19 PE IgG1 (Beckman Coulter, Sydney, Australia). Appropriate isotype controls were used. To establish a pretreatment baseline, samples were collected on at least 3 occasions over at least a 2-week period prior to the first treatment. Samples were collected immediately prior to treatment; 6 hours after treatment administration; then on days 1, 2, 5, 7, and 10 after each treatment; and then weekly until 4 weeks after the final treatment. To ensure accuracy of flow cytometric evaluation of Vα24+Vβ11+ NKT cells that are present at very low frequencies in PB, up to 1 × 10⁶ cells were assessed in order to acquire more than 100 NKT cell events.
Activation status. Activation status of B cells, T cells, and NK cells was determined by expression of surface CD69 (anti-CD69 IgG2b PC5; Beckman Coulter) and cytoplasmic interferon-γ (IFN-γ) (anti–IFN-γ IgG1 PE; Beckman Coulter) according to the manufacturer's protocol with costaining for CD56, CD3, and CD19. To allow evaluation of in vivo activation, an in vitro activation step (eg, using phorbol 12–myristate 13–acetate [PMA]) prior to analysis was not undertaken. Activation status of bone marrow T, B, and NK cells, by means of surface CD69 expression, was performed on aspirate samples collected before the first treatment and 7 days after the second treatment.
Serum cytokine analysis. Serum IFN-γ, IL-12, and IL-4 were assessed before (time point 0) and at intervals (6 hours and days 1, 2, and 7) after each treatment. Serum was separated from clotted PB within 10 minutes of collection and cryopreserved at –80°C until analyzed. Cytokine levels were assessed by means of enzyme-linked immunosorbent assay (ELISA) (BD OptEIA ELISA Kits; Becton Dickinson, San Diego, CA) according to the manufacturer's instructions.
NK functional assays. The cytotoxicity of PB mononuclear cells (PBMNCs) against K562, with or without IFN-γ (50 ng/mL), was assessed by the standard 4-hour 51Cr-release assay performed in triplicate at an effector-to-target (E/T) (MNC/K562) ratio of 40:1 as published.8 The counts per minute of spontaneous release was always lower than 15% of the counts per minute of maximum release. Sufficient cells were available for data to be obtained from 11 subjects (n = 11).
Trafficking of MoDCs
Indium111-oxine–labeled MoDCs (20% of the total MoDC dose was labeled) were infused intravenously immediately after the unlabeled cells.24 The proportion of indium-labeled MoDCs within different organs was determined immediately after administration and at 4, 6, 24, and 48 hours later. Control injections of free Indium111-oxine were administered several weeks later to confirm that labeled DCs, rather than free indium released from the DCs, were being tracked.
Statistical analysis
Our analysis of more than 50 subjects with cancer has confirmed that NKT cell frequency in peripheral blood is skewed toward low levels. Therefore nonparametric statistics using the Wilcoxon signed rank test were performed to compare pretreatment baseline levels with posttreatment results. With the exception of these statistical analyses, data shown are plotted directly from raw data.
Results
Immune responses to administration of α-GalCer–pulsed MoDCs
Administration of α-GalCer–pulsed MoDCs resulted in strikingly reproducible immune responses. Direct effects on PB NKT cells were observed as well as marked secondary immune effects, including closely linked and corresponding changes in PB levels of conventional T cells, NK cells, and B cells not observed in control subjects and activation of T and NK cells.
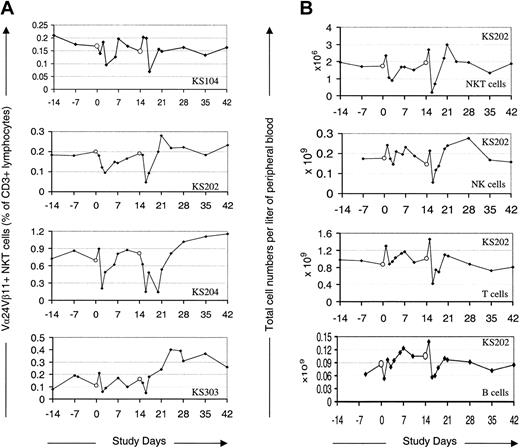
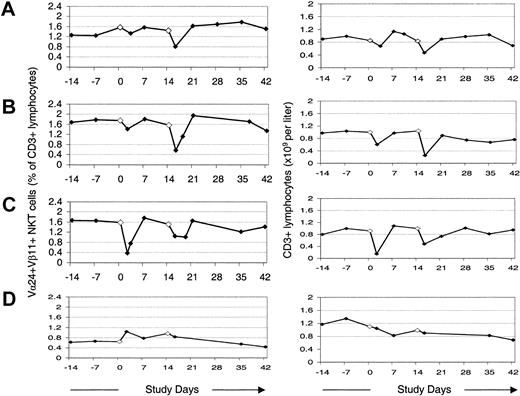
α-GalCer–pulsed MoDCs modulate PB levels of NKT, T, NK, and B cells. PB levels of the NKT cells, NK cells, T cells, and B cells reproducibly but transiently fell to a nadir around 1 to 2 days after each treatment (Figure 1A). This decrease was most notable in the case of NKT cells (up to 18-fold decrease; mean decrease, 3-fold), and less so for NK cells (up to 9-fold decrease; mean decrease, 1.9-fold) and T cells (up to 3-fold decrease; mean decrease, 1.8-fold). The PB NKT cell levels, as a percentage of all CD3+ cells, fell in most cases within 6 hours of treatment (see “Induction of NKT cell memory”), whereas T and NK cells increased by this time point before falling to a nadir during the following 1 to 2 days. The degree to which NK cells decreased correlated with the NKT cell decrease as a proportion of total CD3+ cells (R = 0.7), supporting published data that specific interaction between α-GalCer–pulsed DCs and NKT cells was responsible for the NK cell changes. These posttreatment events did not occur following therapy in control subjects (n = 3) with MoDCs pulsed with peptide antigens or tumor lysate (Figure 2). Following the transient decrease, mean PB levels of NKT cells and NK cells rose by day 7 to a peak significantly above the injection-day baseline (P < .03 and P < .04 for NKT and NK cells, respectively). These increases were modest and generally not sustained, with NKT cell and NK levels returning to, or close to, baseline levels during the observation period. However, in contrast to what occurred after the first treatment, there is a very interesting trend toward the NKT cell levels' being more sustained after the second treatment. Specifically, NKT cells remained above baseline levels for at least 2 weeks in 6 of the 12 subjects; in 2 of these subjects, the NKT cells were still above baseline at the final monitoring point 4 weeks after the final treatment.
Peripheral blood levels of NKT, NK, T, and B cells following administration of α-GalCer–pulsed MoDCs. Empty circles (○) indicate administration of α-GalCer–pulsed MoDCs. (A) Four representative cases of Vα24+Vβ11+ NKT cells as a percentage of CD3+ cells following administration of α-GalCer–pulsed MoDCs. (B) Peripheral blood levels of Vα24+Vβ11+ NKT cells, NK cells, T cells, and B cells in one representative case (KS202) following administration of α-GalCer–pulsed MoDCs.
Peripheral blood levels of NKT, NK, T, and B cells following administration of α-GalCer–pulsed MoDCs. Empty circles (○) indicate administration of α-GalCer–pulsed MoDCs. (A) Four representative cases of Vα24+Vβ11+ NKT cells as a percentage of CD3+ cells following administration of α-GalCer–pulsed MoDCs. (B) Peripheral blood levels of Vα24+Vβ11+ NKT cells, NK cells, T cells, and B cells in one representative case (KS202) following administration of α-GalCer–pulsed MoDCs.
Changes in peripheral blood Vα24+Vβ11+ NKT cells as a percentage of total T cells, and numbers of T cells in peripheral blood following administration of MoDCs. (A) Initial series of treatments with α-GalCer–pulsed MoDCs. (B-C) A second (B) and third (C) series of treatments with α-GalCer–pulsed MoDCs several months later. (D) Treatments with autologous tumor lysate–pulsed MoDCs 6 months later.
Changes in peripheral blood Vα24+Vβ11+ NKT cells as a percentage of total T cells, and numbers of T cells in peripheral blood following administration of MoDCs. (A) Initial series of treatments with α-GalCer–pulsed MoDCs. (B-C) A second (B) and third (C) series of treatments with α-GalCer–pulsed MoDCs several months later. (D) Treatments with autologous tumor lysate–pulsed MoDCs 6 months later.
Following study therapy, T and B cells also rose in some cases, but changes were less marked and less frequent. In most cases, peak levels of NKT, NK, B, and T cells were higher and more sustained following the second treatment.
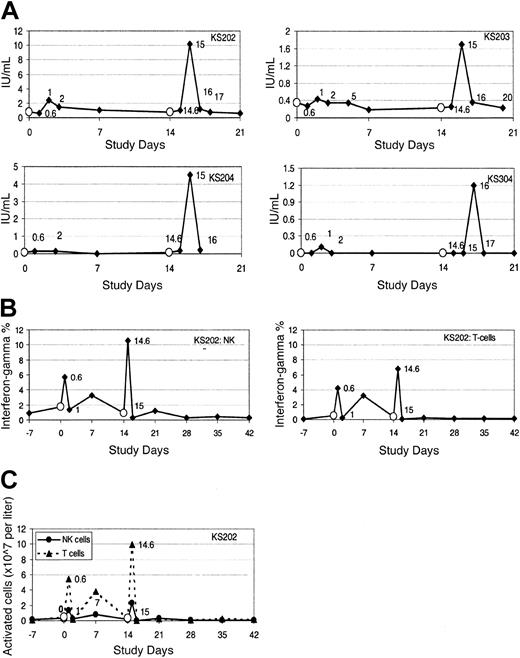
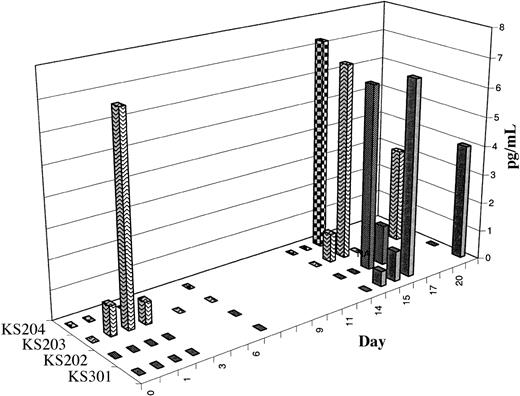
Activation of NKT cells results in increased serum interferon-γ and IL-12. After therapy, serum levels of IFN-γ transiently but significantly increased in all evaluable cases (n = 10). Representative examples are shown in Figure 3A. Serum IL-12 levels increased in 6 of 9 evaluable cases; the time course is shown in Figure 4. In contrast, serum IL-4 levels decreased in the 24 hours following study therapy in most but not all cases (data not shown). In most cases, a priming treatment was required for induction of increases in serum IFN-γ and IL-12, with detectable increases in peripheral blood occurring only after the second treatment. Study subjects frequently experienced mild systemic symptoms (see “Induction of NKT cell memory”) coinciding with the laboratory evidence for cytokine release and immune activation.
Serum and cytoplasmic IFN-γ increase following administration of α-GalCer–pulsed MoDCs. (A) Serum IFN-γ levels following therapy with α-GalCer–pulsed MoDCs in 4 representative cases. (B-C) The percentage (B) and total number (C) of PB NK cells and T cells expressing cytoplasmic IFN-γ, indicating the time course of in vivo activation of NK cells and T cells following therapy with α-GalCer–pulsed MoDCs in one representative patient (KS202). Empty circles (○) indicate administration of α-GalCer–pulsed MoDCs.
Serum and cytoplasmic IFN-γ increase following administration of α-GalCer–pulsed MoDCs. (A) Serum IFN-γ levels following therapy with α-GalCer–pulsed MoDCs in 4 representative cases. (B-C) The percentage (B) and total number (C) of PB NK cells and T cells expressing cytoplasmic IFN-γ, indicating the time course of in vivo activation of NK cells and T cells following therapy with α-GalCer–pulsed MoDCs in one representative patient (KS202). Empty circles (○) indicate administration of α-GalCer–pulsed MoDCs.
Time course of increases in serum IL-12 levels following administration of α-GalCer–pulsed MoDCs. The data are shown as the increase in serum IL-12 levels above pretreatment baseline levels for 4 subjects in whom serum cytokine levels increased following study therapy.
Time course of increases in serum IL-12 levels following administration of α-GalCer–pulsed MoDCs. The data are shown as the increase in serum IL-12 levels above pretreatment baseline levels for 4 subjects in whom serum cytokine levels increased following study therapy.
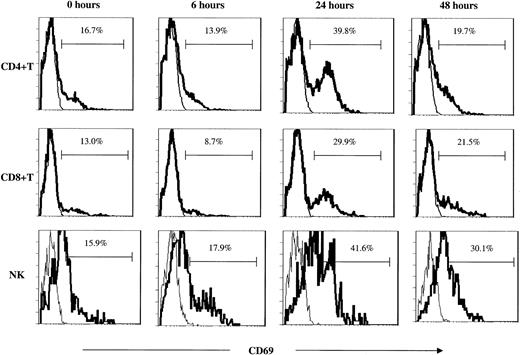
Activation of NK and T cells in peripheral blood and bone marrow. Analysis of the early activation marker surface CD69 and of intracellular IFN-γ production, both undertaken without an in vitro activation step, confirmed rapid but transient in vivo activation of NK and T cells following administration of study therapy (Figures 3B-C and 5). Activation of immune effector cells was associated with the transient decrease in PB levels of these cells. Increases in these activation markers were more striking after administration of the second treatment, but in some cases occurred even after a single treatment. The low posttreatment NKT cell levels preclude accurate assessment of NKT cell activation status. Activation of bone marrow (BM) T and NK cells (up-regulation of surface CD69) was observed in samples taken 7 days after the second intravenous treatment. Activation of BM immune effector cells was greatest when treatment had a more pronounced effect on PB NKT cell numbers (data not shown).
T- and NK-cell activation as determined by CD69 up-regulation. Surface CD69 expression on peripheral blood T-cell subsets and NK cells following study therapy in one representative case (KS203). The figures represent CD69 (bold line) overlaid with IgG2b isotype control (thin line) following the first of 2 intravenous treatments.
T- and NK-cell activation as determined by CD69 up-regulation. Surface CD69 expression on peripheral blood T-cell subsets and NK cells following study therapy in one representative case (KS203). The figures represent CD69 (bold line) overlaid with IgG2b isotype control (thin line) following the first of 2 intravenous treatments.
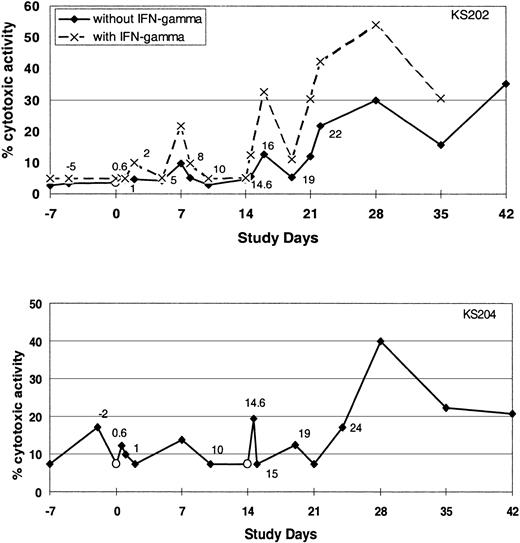
Administration of α-GalCer–pulsed DCs activates NK cell cytotoxicity. To determine whether proliferation and activation of the NK cells were associated with enhanced cytotoxic activity, we evaluated NK cell cytotoxicity against K562 targets. Treatment-related increases in NK-mediated cytotoxicity were observed in some but not all subjects (5 of 11 evaluable subjects) (Figure 6).
Cytotoxic activity of NK cells. The cytotoxicity of PBMCs before and after intravenous injection of α-GalCer–pulsed MoDCs against the K562 cell line with or without IFN-γ as determined by Cr-release assay. Data shown are from 2 of the subjects in whom increases in NK cell cytotoxicity were observed.
Cytotoxic activity of NK cells. The cytotoxicity of PBMCs before and after intravenous injection of α-GalCer–pulsed MoDCs against the K562 cell line with or without IFN-γ as determined by Cr-release assay. Data shown are from 2 of the subjects in whom increases in NK cell cytotoxicity were observed.
Induction of NKT cell memory. A decrease in PB NKT cells as a fraction of PB T cells was observed by 6 hours following 33% and 82% of first and second treatments, respectively. There was also a substantial priming effect in the degree to which NKT cell levels fell below baseline levels. In comparison with the first intravenous treatment, the second intravenous treatment resulted in a greater fall in NKT cells, as a percentage of CD3+ cells, in more than 90% of cases. Of particular interest, the priming effect on NKT cells translated into secondary immune effects that were faster and greater in magnitude. In comparison with the first treatment, after the second treatment, T and NK cells initially fell faster and further (Figure 1); larger numbers of NK and T cells were activated (Figure 3); subsequent peak levels of NKT and NK cells were higher or more sustained; serum IFN-γ levels were greater (Figure 3); and systemic symptoms suggestive of immune activation were more frequent.
Trafficking of α-GalCer–pulsed MoDCs
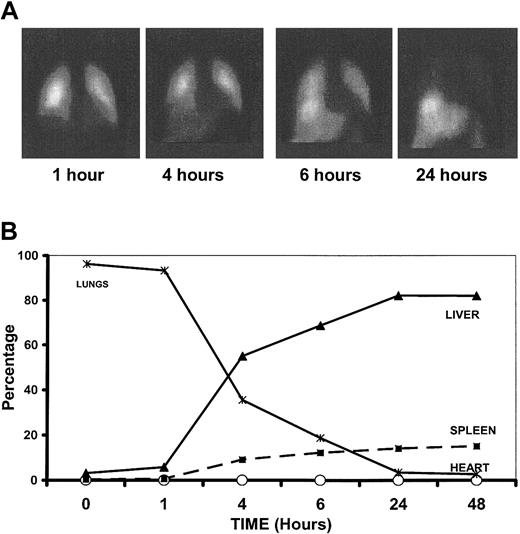
Within 5 minutes of intravenous infusion, almost 100% of MoDCs were within the lungs, where the majority remained until 4 to 6 hours after infusion, by which time MoDCs were appearing in the liver and, to a lesser extent, the spleen (Figure 7). By 24 hours, most of the MoDCs had migrated from the lung to the liver and spleen, with smaller numbers in the bone marrow. Control injections of free indium without MoDCs confirm migration of intact MoDCs. MoDCs pulsed with peptide antigens were distributed similarly (data not shown), indicating that α-GalCer does not significantly alter trafficking properties of the DCs.
Trafficking of α-GalCer–pulsed MoDCs. (A) Gamma-camera images demonstrating distribution of Indium111-oxine–labeled α-GalCer–pulsed MoDCs at 1, 4, 6, and 24 hours after intravenous infusion. (B) Relative distribution of α-GalCer–pulsed MoDCs in various organs following intravenous administration.
Trafficking of α-GalCer–pulsed MoDCs. (A) Gamma-camera images demonstrating distribution of Indium111-oxine–labeled α-GalCer–pulsed MoDCs at 1, 4, 6, and 24 hours after intravenous infusion. (B) Relative distribution of α-GalCer–pulsed MoDCs in various organs following intravenous administration.
Clinical outcomes
Following administration of study therapy, the majority of patients experienced temporary exacerbation of tumor symptoms, many of which were clearly inflammatory: for example, tender enlargement of palpable tumor deposits or involved lymph nodes (occurring in 5 of 5 patients with nodal metastases), bone pain, respiratory symptoms in subjects with pulmonary metastases, and biochemical abnormalities (eg, tumor-related elevations in lactate dehydrogenase [LDH] or tumor marker levels, eg, carcinoembryonic antigen [CEA]). These flares are interpreted as inflammatory responses to the tumor because they had a strong temporal relationship to study therapy, were reproducible in terms of timing and nature with subsequent treatment episodes, were transient (generally lasting only 1 to 3 days), and did not occur outside the study period. Minor systemic side effects, including fever, malaise, lethargy, and headache, unrelated to the malignancy and temporally related to immunologic responses, occurred following study therapy in 9 of 12 patients. Although hepatotoxicity has been observed in murine models of NKT cell activation, abnormalities of liver function tests resulting from study therapy were not observed.
Tumor responses were not a focus of this study, but it is of interest that following study therapy sustained decreases in serum tumor markers occurred in 2 patients with adenocarcinoma (KS102 and KS203) lasting for 4 and 12 months respectively; 1 subject (KS303) developed extensive necrosis of tumor (renal cell carcinoma) infiltrating bone marrow; and 2 patients with hepatic infiltration with tumor had reductions in serum hepatocellular enzyme levels.
Discussion
This clinical study demonstrates that therapy with MoDCs pulsed with the specific NKT cell ligand, α-GalCer, results in sufficient activation of NKT cells to increase PB numbers and to produce substantial secondary immune effects, including T-cell activation, increased NK cells, activation and enhanced cytotoxicity of NK cells, and increased serum IFN-γ and IL-12. Murine studies show that IFN-γ production and enhanced NK cell cytotoxicity are important for antitumor actions following NKT cell activation.12-14 The capacity of small numbers of α-GalCer–pulsed MoDCs and responding NKT cells to secondarily activate far greater numbers of immune effectors is remarkable and attests to the pivotal role of this small population in the initiation of a cascade of immunologic events.
We provide the first in vivo evidence that human NKT cells, with a key role in early, innate immune responses, display immunologic memory that is manifested as more rapid, vigorous, and sustained effects following a second stimulation. This priming effect extended to secondary immune effects of NKT cells, enhancing the capacity of NKT cells to activate both innate (NK-cell) and acquired (T-cell) immunity and hastening the onset of secondary immune effects.
Our results are pivotal for further clinical evaluation of human NKT activation, which may have therapeutic benefits for malignancy, a range of autoimmune diseases,25-27 therapy or prevention of infection,28,29 and inhibition of graft-versus-host disease.30 While there are many similarities between murine and human CD1d α-GalCer–reactive NKT cells, there are some major differences, including organ and tissue distribution, that may have an impact on any putative clinical role for these cells.31 Activation of murine NKT cells in the liver, either with therapeutic intent32 or in the setting of certain infections,33,34 results in severe and potentially fatal liver damage. These observations raised the possibility that liver toxicity could preclude a therapeutic role for in vivo human NKT activation. Our study indicates that NKT cell activation, sufficient to activate both innate and acquired immunity in human subjects, is not associated with liver toxicity.
Activation of T and NK cells and increased NK cell number may occur as a direct consequence of NKT cell activation, for example owing to local cytokine release, or indirectly with the administered DCs playing an important intermediary role in the secondary immune effects.17,20,21,35 In vitro, activation of NKT cells results in up-regulation of a number of DC functions, including release of IL-12 and other cytokines able to activate T and NK cells. The sources of the increased serum IL-12 and the relative contribution of NKT cells, T cells, and NK cells to increased serum IFN-γ are unknown, but following NKT cell activation in mice, DC and NK cells are the major sources of serum IL-12 and IFN-γ, respectively.12 The interplay between NKT cells and DCs may amplify early immune responses and be critical to the coordination of T-, NK-, and B-cell activation.
Potential mechanisms for the transient fall in PB NKT cells following study therapy include activation-induced apoptosis, as observed in murine hepatic NKT cells13,32,36 ; localization of responding cells to tissues, perhaps, at least initially, in contact with the administered MoDCs; or down-regulation of surface TCR.37,38 A role for altered localization following initial activation is supported by the subsequent, highly parallel decreases in T cells, NK cells, and B cells.
The dominant site of immune activation following study therapy is unknown. Administered MoDCs may interact with PB NKT cells as they randomly pass through the organs, a hypothesis supported by the rapid decreases in PB NKT cells following study therapy. Initially MoDCs were retained in the lung, enriched for NKT cells,39 but started appearing in the liver and spleen by 4 hours. Therefore, resident NKT cells in any of these organs could also contribute to immune responses detected at 6 hours.
Immature MoDCs were selected as CD1d-expressing APCs for this study on the basis of in vitro data indicating their potent stimulation of NKT cells and evidence that CD1d expression was higher on immature MoDCs than on mature MoDCs. Substantial clinical data indicate conventional cytotoxic T lymphocyte (CTL) induction by peptide-pulsed MoDCs.40 Adjuvant effects of NKT cell activation on antigen-specific CTLs, such as those previously demonstrated in murine models,11 were not evaluated in our clinical study, but CD8+ T cells were clearly activated in response to the study therapy. Clinical studies to evaluate adjuvant immunologic effects on antigen-specific CTLs of DCs copulsed with α-GalCer and peptides are warranted. Our intensive immune monitoring schedule revealed the highly cyclical nature of immune responses to DC-based immune therapy and illustrates how the timing of PB monitoring can significantly affect whether therapy is interpreted as suppressive or stimulatory.
Conclusions regarding disease outcome are preliminary, as this was a heterogenous, small group of patients. However the high frequency of therapy-induced, clinically apparent inflammatory responses at tumor sites provides compelling evidence for clinically relevant antitumor responses. We did not undertake tumor biopsies to determine the nature of the inflammatory responses. The absence of flares in the patients outside the therapeutic period and the reproducible temporal relationship to study therapy is strong corroborating evidence that these effects were a result of the study therapy. With greater numbers of treatments, or the combination of this therapy with potentially additive or synergistic therapeutic maneuvers (eg, peptide antigen–pulsed DCs), objective tumor responses are anticipated.
In summary, our results provide the first clinical evidence that human NKT cells can bridge innate and acquired immunity, that this may be useful in the therapeutic setting, and that human NKT cell memory responses result in faster and more vigorous secondary immune response to NKT cell activation.
Prepublished online as Blood First Edition Paper, September 25, 2003; DOI 10.1182/blood-2003-04-1155.
Supported by the Queensland Cancer Fund; Suncorp Metway; Kirin Brewery Co. Pty Ltd; Royal Brisbane Hospital Research Foundation; and the Leukaemia Foundation of Queensland.
The publication costs of this article were defrayed in part by page charge payment. Therefore, and solely to indicate this fact, this article is hereby marked “advertisement” in accordance with 18 U.S.C. section 1734.
We would like to acknowledge Mr Yoshitaka Ando (Kirin Brewery Co Ltd, Tokyo, Japan) for helpful discussions; Dr Steven Porcelli (Albert Einstein College of Medicine, Yeshiva University, New York, NY) for providing CD1d monoclonal antibodies; Dr Jill Hows (University of Bristol, United Kingdom) for her long-standing support; Dr Marissa Bartlett (Royal Brisbane Hospital) for assistance with tracking studies; Dr M. Nishimura (Japanese Red Cross Tokyo Metropolitan Blood Center); Alyce Maksoud and Helen Clague (Queensland Institute of Medical Research) for technical assistance and data processing; and the nursing staff for valuable support. We would also like to thank Kirin Brewery for providing clinical grade α-GalCer (KRN7000) for these studies.

This feature is available to Subscribers Only
Sign In or Create an Account Close Modal