Abstract
In vitro studies indicate the therapeutic potential of mTOR inhibitors in treating multiple myeloma. To provide further support for this potential, we used the rapamycin analog CCI-779 in a myeloma xenograft model. CCI-779, given as 10 intraperitoneal injections, induced significant dose-dependent, antitumor responses against subcutaneous growth of 8226, OPM-2, and U266 cell lines. Effective doses of CCI-779 were associated with modest toxicity, inducing only transient thrombocytopenia and leukopenia. Immunohistochemical studies demonstrated the antitumor responses were associated with inhibited proliferation and angiogenesis, induction of apoptosis, and reduction in tumor cell size. Although CCI-779-mediated inhibition of the p70 mTOR substrate was equal in 8226 and OPM-2 tumor nodules, OPM-2 tumor growth was considerably more sensitive to inhibition of proliferation, angiogenesis, and induction of apoptosis. Furthermore, the OPM-2 tumors from treated mice were more likely to show down-regulated expression of cyclin D1 and c-myc and up-regulated p27 expression. Because earlier work suggested heightened AKT activity in OPM-2 tumors might induce hypersensitivity to mTOR inhibition, we directly tested this by stably transfecting a constitutively active AKT allele into U266 cells. The in vivo growth of the latter cells was remarkably more sensitive to CCI-779 than the growth of control U266 cells.
Introduction
The phosphatidylinositol 3-kinase/AKT (PI3-K/AKT) signaling pathway is important for the survival and growth of multiple myeloma (MM) cells and is an attractive target for antitumor therapy.1-3 An important downstream target of PI3-K/AKT is the mammalian target of rapamycin (mTOR), which mediates phosphorylation of p70S6 kinase (p70) and 4E-BP1,4 proteins responsible for the translation and expression of D-type cyclins and c-myc.5,6 By preventing these phosphorylation events, mTOR inhibitors down-regulate such expression and induce G1 cell cycle arrest.7 In addition, these drugs up-regulate expression of the p27 CDK inhibitor, which may also contribute to G1 arrest.8 The in vitro sensitivity of MM cells to the antitumor effects to mTOR inhibitors frequently correlates with heightened AKT activity.9-11
Rapamycin is a classical mTOR inhibitor. The poor solubility that compromised rapamycin as an intravenous agent led to the development of a more soluble ester analog of rapamycin, CCI-779.12 We have shown in vitro anti-MM activity of rapamycin and CCI-779.9,11,13 Exposure to these mTOR inhibitors prevents the proliferation of PTEN- and RAS-mutated myeloma cell lines and of interleukin-6 (IL-6)-stimulated proliferation of nonmutated myeloma clones. To provide a further preclinical rationale for the development of mTOR inhibitors in patients, we initiated the current study testing the effects of CCI-779 in vivo against human MM tumor growth in a murine xenograft model. Our results confirm that CCI-779 is effective in vivo against myeloma cells and demonstrate inhibited proliferation, angiogenesis, and induction of tumor cell apoptosis.
Materials and methods
Myeloma cell lines and transfection
The human 8226, U266, and OPM-2 MM cell lines were maintained as previously described.2,13 Constitutively activated myristoylated-AKT (myr-AKT) cDNA expression vector was purchased from Upstate (Charlottesville, VA). Transfection of U266 cells was accomplished by electroporation (230 V for 25 ms), as previously described.14 Stable transfections were selected in neomycin (350 mg/mL), and successful transfection was determined by Western blotting with antibodies specific for total and phosphorylated AKT (Ser473).
Reagents
Primary antibodies against total and phosphorylated p70, signal transducer and activator of transcription 3 (STAT3), AKT, c-myc, and actin were purchased from Cell Signaling (Beverly, MA). Cyclin D1 antibody and Matrigel were purchased from BD Biosciences (Palo Alto, CA). Cyclin D1 antibody was specific for D1 and did not cross-react with D2 or D3. Ki-67 antibody was purchased from DAKO (Carpenteria, CA). Rat anti-mouse CD34 antibody was purchased from Caltag Laboratories (Burlingame, CA). CCI-779 was provided by Wyeth-Ayerst (Pearl River, NY).
Animals
Four- to 6-week-old male nonobese diabetic/severe combined immunodeficient (NOD/SCID) mice were obtained from Jackson Laboratories (Bar Harbor, ME). The mice were maintained 4 to a cage in pathogen-free conditions. All animal studies were conducted in accordance with protocols approved by the Animal Research Committee of the West Los Angeles Veterans Administration Medical Center.
Xenograft model
We used the murine myeloma xenograft model of Leblanc et al15 with minor modifications. Cell lines were mixed with Matrigel (BD Bioscience), as previously described,15 and were then injected subcutaneously into the left flanks (200 μL per mouse containing 7.5 × 10⁶ 8226 cells, 3 × 10⁷ U266 cells, or 3 × 10⁷ OPM-2 cells) of the mice. Tumor growth was monitored daily, and mice were randomized to drug-treated or control groups (8-14 mice per group) when the tumor volume reached approximately 200 to 400 mm3. Tumors were measured at their greatest length and width, and the volume was calculated as 4π/3 × (tumor width/2)2 × (tumor length/2)15 . CCI-779 was prepared as previously described.14 Briefly, a 50-mg/mL stock solution was prepared in 100% EtOH. On the day of injections, the drug was diluted in 5% Tween-80, 5% polyethylene glycol-400 (Sigma, St Louis MO) to the appropriate final concentration (final concentration of EtOH is 0.4%). The CCI-779 drug solution (200 μL) was administered intraperitoneally each day for 5 days, followed by 2 days of no drug and then 5 additional daily injections (total of 10 injections). Mice were humanely killed when tumor volume reached more than 2000 mm3.
Immunohistochemistry
At day 6 (OPM-2 and 8226) or day 13 (8226 only), some additional mice were humanely killed with CO2, and each tumor mass was excised. The tumor was bisected using a razor blade: half the tumor was immediately placed in 10% buffered formaldehyde overnight, and the other half was frozen for protein extraction. Formaldehyde-fixed tumors were embedded in paraffin and cut into 5 μm-thick serial sections using standard histologic procedures. Immunohistochemical staining with anti-Ki-67 or anti-CD34 primary antibody was conducted using standardized automated methods.16 For expression detection, we used the DAKO Envision System, which uses a peroxidase-labeled synthetic polymer conjugated to goat anti-rabbit or goat anti-rat antibody with diaminobenzidine as the substrate to induce brown. Sections were counterstained with hematoxylin and eosin. The proliferation index was determined by assaying the area of Ki-67 staining using the MetaMorph software (see “Morphometric analysis”) from 10 randomly selected fields at 20× magnification. Angiogenesis was determined by assaying the area of CD34 staining microvessels using the MetaMorph software from 10 randomly selected fields at 20× magnification.
Apoptosis was measured using the ApopNexin Biotin Apoptosis Detection Kit (Intergen, Purchase, NY). Briefly, sections were deparaffinized, rehydrated, and microwaved with 30 mM sodium citrate. DNA strand breaks were labeled by conjugation with 30 μM digoxigenin-11-deoxyuridine triphosphate (dUTP) to the 3′-OH sites and catalyzed by 0.3 U/μL terminal deoxynucleotidyl transferase (TdT) for 60 minutes at 37°C. Samples in which TdT was omitted from the reaction were used as negative controls, and samples treated with DNase I were used as positive controls for DNA strand breaks. Sections were counterstained with hematoxylin. The apoptotic index (AI) was determined by counting the total number of positive nuclei in 10 randomly selected fields at 20× magnification.
Morphometric analysis
Morphometric analysis of cell size was performed on tissue sections with a Nikon Microphot-SA microscope (Melville, NY) equipped with plan-apochromat lenses (20× and 40× magnification). A digital camera (SPOT-RT; Diagnostic Instruments, McHenry, IL) was used to capture images with a resolution of 1520 × 1080 pixels. MetaMorph software (version 6.1; Universal Imaging, West Chester, PA) was used to perform cellular morphometric analysis of Ki-67-stained nuclei from 4 high-power field images (40 × magnification). Final images for publication were prepared using Adobe Photoshop software (version 7.0; Adobe Systems, San Jose, CA).
Western blot analysis
Frozen tumors were minced with a razor blade, then processed in a glass tissue homogenizer on ice. Protein was extracted in ice-cold lysis buffer (1% Triton X-100, 0.5% NP40, 10 mM Tris [pH 7.4], 150 mM NaCl, 1 mM EGTA [ethyleneglycotetraacetic acid], 0.2 mM Na3VO4, 0.2 mM NaF, and 0.2 mM phenylmethylsulfonyl fluoride). Twenty-five micrograms protein from each sample was boiled for 10 minutes in 1 × sodium dodecyl sulfate (SDS) gel-loading buffer (Bio-Rad, Hercules, CA). Proteins were separated by 10% SDS-polyacrylamide gel electrophoresis (SDS-PAGE) and were transferred onto polyvinylidene difluoride membranes. Membranes were blocked for 1 hour in 5% nonfat dried milk, 10 mM Tris (pH 7.5), 100 mM NaCl, and 0.1% Tween-20 and were then washed 3 times and incubated with primary specific antibodies for 1 hour. After 3 more washes, membranes were incubated with 1 μg/mL horseradish peroxidase-labeled anti-mouse immunoglobulin G (IgG), and protein bands were detected using an enhanced chemiluminescence system.
Statistics
To assess tumor growth curves, tumor volumes were calculated as mean ± SEM. Repeated-measures analysis of variance was used to determine the statistical significance of differences between the growth of tumors by comparing tumor volumes at the start and at the end of treatment in the experimental groups. For other analyses, the Student t test was used to determine significance.
Results
CCI-779 is minimally toxic to NOD/SCID mice
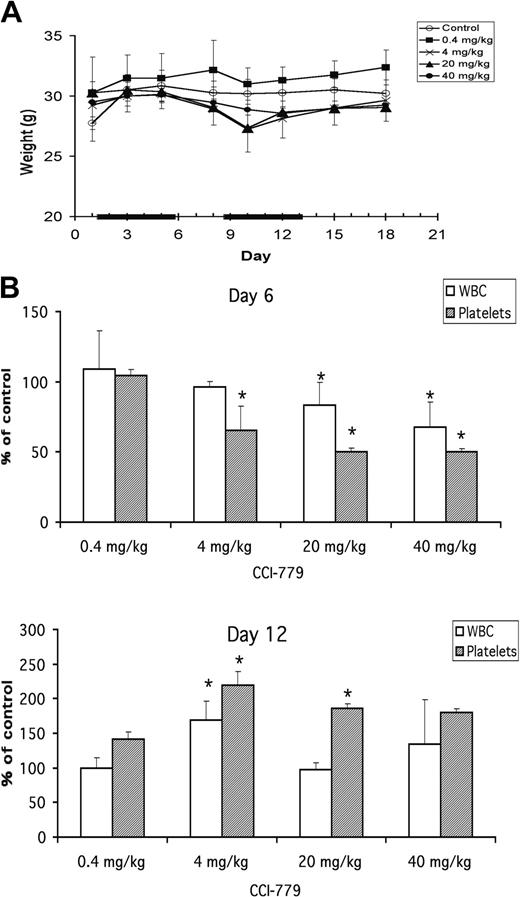
To assess the potential in vivo antimyeloma effects of CCI-779, we slightly modified the murine xenograft model of Leblanc et al.15 Instead of using beige-nude-XID (BNX) mice, we used NOD/SCID mice because our preliminary experiments showed more consistent subcutaneous myeloma tumor growth in this strain. To first test the toxicity of CCI-779 in these tumor-free mice, we injected increasing doses of the drug intraperitoneally (versus vehicle control) for 5 consecutive days, rested the mice for 2 days, and then injected daily for another 5 consecutive days. The drug-treated mice (n = 4 per group) demonstrated some minimal weight loss in a short window of time midway through the second 5-day treatment course, though this was not statistically significant (Figure 1A). No other visible drug-induced adverse effects were noted. In particular, none of the mice developed dermatitis, which is a frequently reported adverse effect of CCI-779.17
Minimal toxicity of CCI-779 in NOD/SCID mice. Mice (4 per group) were injected intraperitoneally with vehicle alone or with varying doses of CCI-779 daily for 10 days, as described in “Materials and methods.” (A) Weight shown in grams (mean ± SD; n = 4). Solid bars on x-axis denote days of treatment. (B) Platelet and WBC counts enumerated at day 6 (upper panel) and day 12 (lower panel) of treatment and shown as percentage of control (vehicle alone) (mean±SD; n = 4). Asterisks denote values significantly different (P < .05) from control.
Minimal toxicity of CCI-779 in NOD/SCID mice. Mice (4 per group) were injected intraperitoneally with vehicle alone or with varying doses of CCI-779 daily for 10 days, as described in “Materials and methods.” (A) Weight shown in grams (mean ± SD; n = 4). Solid bars on x-axis denote days of treatment. (B) Platelet and WBC counts enumerated at day 6 (upper panel) and day 12 (lower panel) of treatment and shown as percentage of control (vehicle alone) (mean±SD; n = 4). Asterisks denote values significantly different (P < .05) from control.
Examination of blood counts identified significant (P < .05) thrombocytopenia and leukopenia after the first 5 days of CCI-779 administration (Figure 1B, top panel). These cytopenias were dose dependent, and platelet counts were more sensitive to the inhibitory effect than white blood cell (WBC) counts. Interestingly, by day 12 (Figure 1B, lower panel), after 5 additional intraperitoneal injections, platelet and WBC counts had recovered and, in some cases, overshot the baseline values. By day 18, WBC counts had returned to normal, whereas platelet counts remained slightly elevated (not shown). Mice were observed for an additional 2 weeks after the cessation of CCI-779 therapy, and no additional untoward adverse effects were noted.
CCI-779 significantly inhibits myeloma cell growth in vivo
NOD/SCID mice were first challenged with 8226 myeloma cells (7.5 × 10⁶ cells/mouse) by subcutaneous injection. When the tumors measured approximately 200 mm3, the mice were randomized to receive intraperitoneal injections of vehicle or CCI-779 at 0.4 mg/kg, 4.0 mg/kg, and 20 mg/kg. Because a dose of 40 mg/kg CCI-779 produced the most toxicity in terms of inhibited WBC and platelet counts (Figure 1B), we used 20 mg/kg as the highest dose tested in our tumor-challenged mice. We used the same treatment regimen that had tested the toxicity of 5 consecutive daily injections, followed by 2 days of rest, and then 5 additional daily injections.
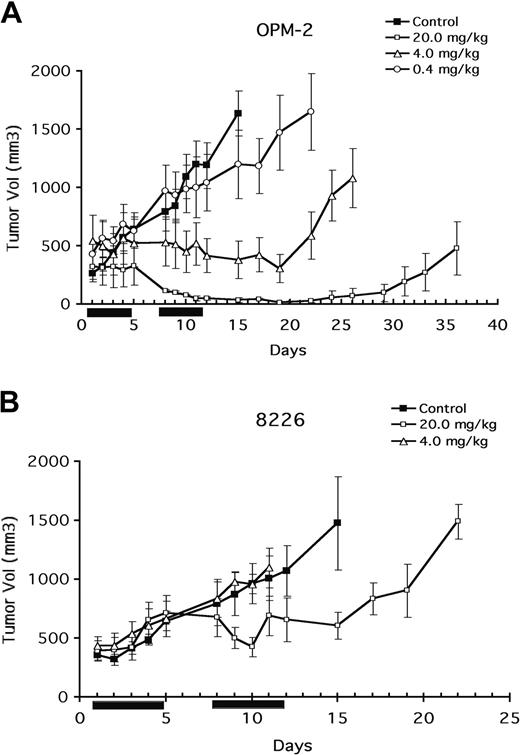
Figure 2 demonstrates a significant (P < .05) antitumor effect of 20 mg/kg CCI-779 on 8226 tumor growth that was evident by 8 to 9 days after the start of treatment (Figure 2B). Progressive tumor growth was prevented with this dose though an actual decrease in tumor size was not observed. In contrast, 4 mg/kg and 0.4 mg/kg (the latter not shown in Figure 2) had no effect. Tumor growth after treatment with 20 mg/kg was suppressed for approximately 15 days. Subsequently, however, progressive tumor growth was renewed.
Antitumor effect of CCI-779. Mice (8-14 per group) challenged subcutaneously with OPM-2 (A) or 8226 (B) cells. When tumor size reached 200 mm3, mice were randomly assigned to receive vehicle alone or varying doses of CCI-779 intraperitoneally for 10 days, as described in “Materials and methods.” Results are tumor size (mean ± SEM). Solid bars on x-axis denote days of intraperitoneal treatment.
Antitumor effect of CCI-779. Mice (8-14 per group) challenged subcutaneously with OPM-2 (A) or 8226 (B) cells. When tumor size reached 200 mm3, mice were randomly assigned to receive vehicle alone or varying doses of CCI-779 intraperitoneally for 10 days, as described in “Materials and methods.” Results are tumor size (mean ± SEM). Solid bars on x-axis denote days of intraperitoneal treatment.
In previous studies,14 the presence of PTEN mutations correlated with a heightened sensitivity to mTOR inhibitors. Our previous study11 suggested that was also true of myeloma cells. Therefore, we tested the ability of CCI-779 to inhibit tumor growth in mice after challenge with the PTEN-mutated OPM-2 cell line. Using the same treatment protocol, OPM-2 growth was found to be more sensitive to CCI-779 than 8226 growth had been. As shown in Figure 2B, the highest dose of CCI-779 (20 mg/kg), induced a significant (P < .05) reduction in tumor volume, and tumors completely disappeared by day 12 of therapy. However, approximately 3 to 4 weeks after treatment, 75% of the tumors reappeared, whereas 25% of regressed tumors never regrew (observations out to 60 days). The next lowest dose of CCI-779 (4 mg/kg) induced a significant antitumor effect that was less effective. The duration of this antitumor response lasted only approximately 10 days after the termination of CCI-779 injections. In contrast, 0.4 mg/kg CCI-779 had only a modest effect. At day 12 of treatment, a calculated ED50 for CCI-779 in preventing OPM-2 tumor growth was 2 mg/kg, whereas the ED50 against 8226 was 20 mg/kg.
Effects of CCI-779 in vivo on proliferation, angiogenesis, apoptosis, and cell size in MM cells
Inhibiting mTOR function induces G1 arrest.7 However, mTOR can also regulate cell size,18 with mTOR inhibition resulting in decreased cell volume. In addition, under some conditions,19 mTOR inhibitors can induce apoptosis. A CCI-779-induced effect on either or all of these parameters could participate in the observed antitumor response. To investigate this issue, we performed histologic studies on excised tumors.
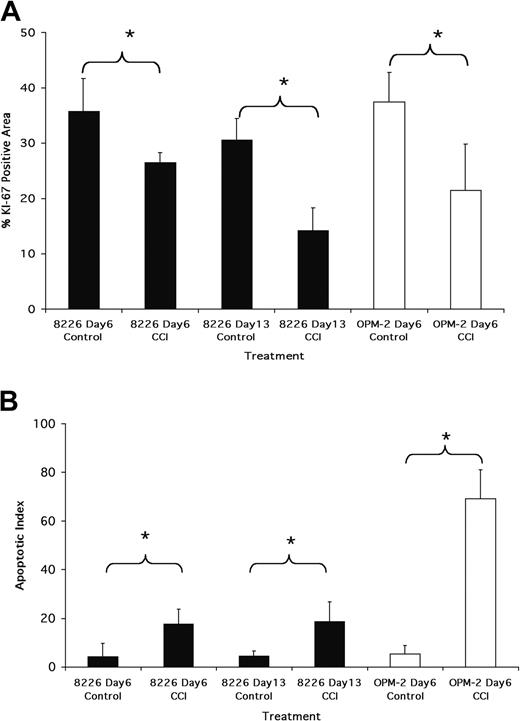
Immunohistochemistry (IHC) for Ki-67 expression, used as an assessment of proliferation, demonstrated that CCI-779 induced a significant inhibition of cell cycle transit. Figure 3A is a quantitative assessment of area stained with Ki-67 in tumors harvested after 6 days of treatment with 20 mg/kg CCI-779 in OPM-2-challenged mice and after 6 and 13 days in 8226-challenged mice. As shown, a significant decrease in Ki-67 staining in 8226 tumors was seen at day 6 (approximately 25% reduction; P < .05). At day 13, the decrease in Ki-67 staining was even greater, approximating 50% of control. The effect on Ki-67 staining in OPM-2 tumors by treatment with 20 mg/kg CCI-779 was even more impressive, with a decrease of approximately 40% (P < .001) after 6 days of treatment (Figure 3A). The disappearance of OPM-2 tumors by day 13 after treatment precluded us from obtaining data on Ki-67 staining at that time point.
Antitumor effects of CCI-779. (A) Ki-67 staining of tumors. OPM-2- or 8226-challenged mice were treated with vehicle alone or 20 mg/kg CCI-779. Tumors were harvested at days 6 and 13 (8226 mice) or day 6 (OPM-2 mice), and sections were stained for Ki-67. Results represent area of microscopic field (original magnification, 20×) stained positively, assessed as described in “Materials and methods.” Data are mean ± SD, n = 10 fields, for each group. * denotes significant differences (P < .05) between control and CCI-779-treated mice. (B) Terminal deoxynucleotidyl transferase-mediated dUTP nick end labeling (TUNEL) staining of tumors. Mice challenged and treated similarly to those described in panel A. Tumor sections stained by TUNEL assay to identify apoptosis. Results are number of TUNEL-stained apoptotic nuclei/microscopic field (original magnification, 20×), mean ± SD, n = 10 fields for each group. Asterisks denote significant differences (P < .05) between control and CCI-779-treated mice.
Antitumor effects of CCI-779. (A) Ki-67 staining of tumors. OPM-2- or 8226-challenged mice were treated with vehicle alone or 20 mg/kg CCI-779. Tumors were harvested at days 6 and 13 (8226 mice) or day 6 (OPM-2 mice), and sections were stained for Ki-67. Results represent area of microscopic field (original magnification, 20×) stained positively, assessed as described in “Materials and methods.” Data are mean ± SD, n = 10 fields, for each group. * denotes significant differences (P < .05) between control and CCI-779-treated mice. (B) Terminal deoxynucleotidyl transferase-mediated dUTP nick end labeling (TUNEL) staining of tumors. Mice challenged and treated similarly to those described in panel A. Tumor sections stained by TUNEL assay to identify apoptosis. Results are number of TUNEL-stained apoptotic nuclei/microscopic field (original magnification, 20×), mean ± SD, n = 10 fields for each group. Asterisks denote significant differences (P < .05) between control and CCI-779-treated mice.
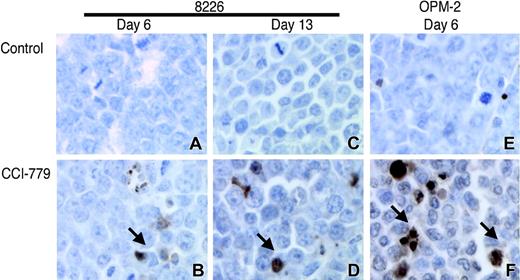
To assess the induction of apoptosis, we used the in situ TdT-mediated dUTP nick-end labeling (TUNEL) assay. As shown in Figure 3B, a small but significant increase in apoptotic nuclei was observed in 8226 tumors treated with 20 mg/kg CCI-779 at day 6 and day 13 compared with vehicle-treated control tumors (t test; P < .05). The induction of apoptosis in OPM-2 tumors was considerably more impressive. As shown, a marked apoptotic response was seen as early as day 6. These findings strongly suggest that in addition to producing a cytostatic effect, inducing apoptosis plays a role in CCI-779-dependent myeloma regression, especially in OPM-2 tumors. Figure 4 shows representative sections of TUNEL-stained tumors, demonstrating the effects of CCI-779 on 8226 and OPM-2 tumors.
CCI-779 induces myeloma cell apoptosis. Representative slides of TUNEL-stained sections for 8226- and OPM-2-challenged mice treated with vehicle or 20 mg/kg CCI-779. Original magnification, ×40. Arrows show several TUNEL-positive apoptotic nuclei.
CCI-779 induces myeloma cell apoptosis. Representative slides of TUNEL-stained sections for 8226- and OPM-2-challenged mice treated with vehicle or 20 mg/kg CCI-779. Original magnification, ×40. Arrows show several TUNEL-positive apoptotic nuclei.
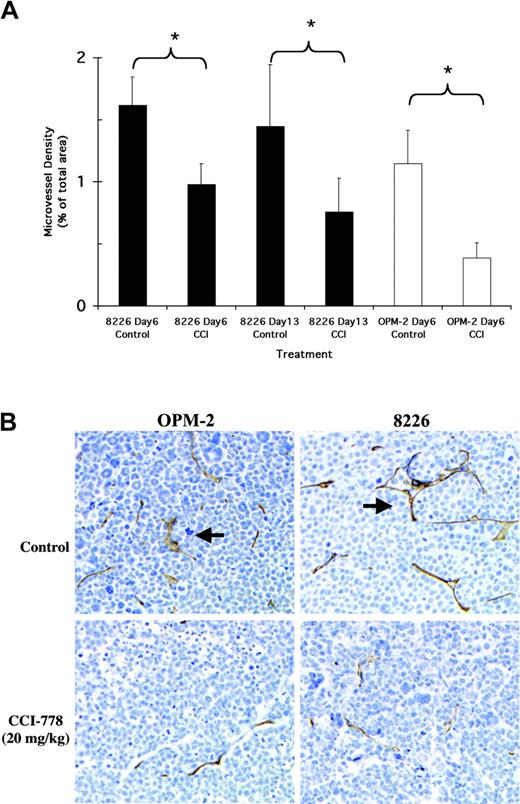
We also tested whether CCI-779 (20 mg/kg) inhibited angiogenesis in excised 8226 and OPM-2 tumors. Immunohistochemical analysis of microvessel density, as measured by in situ staining of mouse endothelial cells with CD34, revealed a significant (t test; P < .05) inhibition of angiogenesis by 20 mg/kg CCI-779 in OPM-2 (a decrease of 66% at day 6) and 8226 (decreases of 39% at day 6 and 47% at day 13) cells compared with control-treated tumors (Figure 5A). The decrease in CD34+ microvessel density strongly correlated with decreases in cellular proliferation and with increased apoptosis of CCI-779-treated OPM-2 and 8226 cells. Figure 5B shows representative sections of CD34+-stained tumors, demonstrating the effects of CCI-779 on angiogenesis in OPM-2 and 8226 tumors.
Antiangiogenic effects of CCI-779. (A) Mice challenged and treated as in Figure 3, and angiogenesis assayed as described in “Materials and methods.” Results represent CD34+ area of microscopic field (original magnification, ×20) stained positively, assessed as described in “Materials and methods.” Data are mean ± SD, n = 10 fields, for each group. Asterisks denote significant differences (P < .05) between control and CCI-779-treated mice. (B) Representative slides of CD34-stained sections for 8226- and OPM-2-challenged mice treated with vehicle or 20 mg/kg CCI-779 at day 6. Original magnification, ×40. Arrows show several microvessels.
Antiangiogenic effects of CCI-779. (A) Mice challenged and treated as in Figure 3, and angiogenesis assayed as described in “Materials and methods.” Results represent CD34+ area of microscopic field (original magnification, ×20) stained positively, assessed as described in “Materials and methods.” Data are mean ± SD, n = 10 fields, for each group. Asterisks denote significant differences (P < .05) between control and CCI-779-treated mice. (B) Representative slides of CD34-stained sections for 8226- and OPM-2-challenged mice treated with vehicle or 20 mg/kg CCI-779 at day 6. Original magnification, ×40. Arrows show several microvessels.
Morphometric analysis was used to assay a possible CCI-779-induced decrease in individual cell size. In 8226 tumors, there was a small but significant (P < .05) reduction in cell size by day 6 (87.39 ± 2.46 μm vs 77.06 ± 6.6 μm) in the CCI-779-treated tumors compared with controls (t test; P < .05). However, at day 13, there was no significant difference (t test; P > .05). In contrast, by day 6 we observed a marked decrease in cell size in OPM-2 tumors (301 ± 147 μm vs 60.12 ± 15 μm) (t test, P < .001). However, because apoptosis is associated with decreased cell size, it is unclear whether this was a direct effect of mTOR inhibition or a secondary effect of apoptosis in OPM-2 cells.
CCI-779 inhibits the p70 cellular signaling pathway
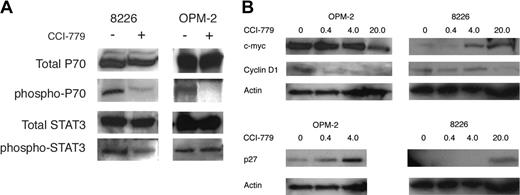
CCI-779 specifically targets the ability of mTOR to phosphorylate downstream target molecules, particularly p70. Therefore, we hypothesized that CCI-779 would specifically inhibit the phosphorylation of p70 in MM tumor cells. Western blot analysis of excised 8226 and OPM-2 tumors clearly demonstrated that CCI-779 (20 mg/kg) inhibited the phosphorylation of p70 at Thr389, an mTOR-specific phosphorylation site in 8226 and OPM-2 tumors (Figure 6A). In contrast, CCI-779 had little or no effect on STAT3 phosphorylation in OPM-2 cells and only a slight inhibitory effect in 8226 cells, suggesting some in vivo molecular specificity.
CCI-779's effects on p70S6kinase phosphorylation and cell-cycle regulatory proteins in vivo. After 5 days of vehicle alone or CCI-779 treatment (20 mg/kg) in 8226- or OPM-2-challenged mice, tumor nodules were harvested, and extracted protein was immunoblotted for expression of total p70S6kinase (p70), phosphorylated p70, total STAT-3, or phosphorylated STAT-3. This experiment was repeated 2 additional times with identical results. (B) Effects of CCI-779 on expression of cyclin D1, p27, and c-myc. OPM-2- or 8226-challenged mice were treated with vehicle alone or varying doses of CCI-779 (shown above blots as mg/kg) for 5 days, after which tumor nodules were harvested, and extracted protein was immunoblotted for expression of p27, c-myc, cyclin D1, and actin. This experiment was repeated once with identical results.
CCI-779's effects on p70S6kinase phosphorylation and cell-cycle regulatory proteins in vivo. After 5 days of vehicle alone or CCI-779 treatment (20 mg/kg) in 8226- or OPM-2-challenged mice, tumor nodules were harvested, and extracted protein was immunoblotted for expression of total p70S6kinase (p70), phosphorylated p70, total STAT-3, or phosphorylated STAT-3. This experiment was repeated 2 additional times with identical results. (B) Effects of CCI-779 on expression of cyclin D1, p27, and c-myc. OPM-2- or 8226-challenged mice were treated with vehicle alone or varying doses of CCI-779 (shown above blots as mg/kg) for 5 days, after which tumor nodules were harvested, and extracted protein was immunoblotted for expression of p27, c-myc, cyclin D1, and actin. This experiment was repeated once with identical results.
CCI-779-induced effects on c-myc, cyclin D1, and p27 expression
By inhibiting mTOR, both rapamycin and CCI-779 can prevent the translation and expression of D-type cyclins and c-myc.5,6 These effects may account for the induction of G1 arrest, and the ability to down-regulate expression of these proteins can determine relative sensitivity to these drugs. In addition, mTOR inhibitors may also up-regulate the expression of the p27 CDK inhibitor, which may contribute to G1 arrest.8 To evaluate these effects in the current study, immunoblot assays on harvested tumor was performed for cyclin D1, c-myc, and p27 protein expression (Figure 6B). In the sensitive OPM-2 tumors, CCI-779 had a modest effect on c-myc expression, only decreasing it by 50% (by densitometry) at the highest dose (20 mg/kg). Expression of cyclin D1 was more susceptible to inhibition, with remarkable decreases even at the lowest CCI-779 dose (0.4 mg/kg). Up-regulated expression of the p27 CDK inhibitor was also present at the low 0.4 and 4 mg/kg doses. In contrast, CCI-779 effects on the more resistant 8226 tumors were less impressive. The drug actually increased c-myc expression in a dose-dependent fashion, decreased cyclin D1, and up-regulated p27 expression at the highest dose (20 mg/kg). Thus, the differential effects on myc/cyclin/p27 expression mirror the relative sensitivities of these 2 tumors to CCI-779-induced cytoreduction.
The antibody we used to assay cyclin D1 was specific for D1 without cross-reactivity to D2 or D3. This specificity was confirmed by preliminary experiments with recombinant D1 or D2 protein. When immunoblot assays were also performed using an antibody specific for cyclin D2 (specificity confirmed with recombinant proteins), though 8226 and OPM-2 cells robustly expressed cyclin D2 when grown in vitro, we could not detect D2 expression in 8226 or OPM-2 tumors harvested from control untreated mice.
AKT activity regulates the in vivo sensitivity of MM tumors to CCI-779
In previous experiments, the presence of PTEN mutations correlated with a heightened sensitivity to CCI-779 in vivo and in vitro.10,11,14 Furthermore, the above results describe a much greater effect in vivo against OPM-2 MM cells, which demonstrated heightened AKT activity, compared with 8226 cells, which contained quiescent AKT. To more directly test a regulatory role of AKT in sensitivity to CCI-779 in vivo, we stably transfected U266 MM cells with a constitutively activated myr-AKT construct. Western blot analysis of transfected U266 cells clearly demonstrated the up-regulation of phosphorylated AKT in myr-AKT but not in control cells (Figure 7A). Using the same in vivo treatment regimen previously described, U266 cells overexpressing activated AKT were more sensitive to CCI-779 than U266 control cells. As shown in Figure 7B, CCI-779 (20 mg/kg) induced a significant (P < .05) antitumor effect in the myr-AKT-transfected U266 cells by day 8 (tumor volume reduction, 60%) and this effect was even more pronounced by day 13 (tumor volume reduction, 73%). In contrast, CCI-779 (20 mg/kg) had little or no effect on the growth of control U266 cells on day 8 (tumor volume reduction, 20%) or day 13 (tumor volume reduction, 30%).
AKT activity in myr-AKT-transfected U266 cells. (A) Expression of total and phosphorylated AKT (Ser473) was determined in U266 cells transfected with myr-AKT or empty vector (EV) control cells, as described in “Materials and methods.” (B) AKT activity regulates tumor sensitivity to CCI-779. Mice (8 per group) were challenged subcutaneously with 3 × 10⁷ myr-AKT transfected U266 or EV-transfected U266 cells, as described in Figure 2. When tumor size reached 200 mm3, mice were randomly assigned to receive vehicle alone (▪) or 20 mg/kg CCI-779 (□) intraperitoneally for 10 days, as described in “Materials and methods.” Results indicate the mean ± SEM volume (mm3) of CCI-779-treated tumors compared with vehicle control tumors assayed on days 8 and 13 of treatment.
AKT activity in myr-AKT-transfected U266 cells. (A) Expression of total and phosphorylated AKT (Ser473) was determined in U266 cells transfected with myr-AKT or empty vector (EV) control cells, as described in “Materials and methods.” (B) AKT activity regulates tumor sensitivity to CCI-779. Mice (8 per group) were challenged subcutaneously with 3 × 10⁷ myr-AKT transfected U266 or EV-transfected U266 cells, as described in Figure 2. When tumor size reached 200 mm3, mice were randomly assigned to receive vehicle alone (▪) or 20 mg/kg CCI-779 (□) intraperitoneally for 10 days, as described in “Materials and methods.” Results indicate the mean ± SEM volume (mm3) of CCI-779-treated tumors compared with vehicle control tumors assayed on days 8 and 13 of treatment.
Discussion
This study demonstrates an in vivo antitumor effect induced by the mTOR inhibitor CCI-779 against human MM cells. Effective doses were minimally toxic with transient decreases seen in platelet and, less intensely, in WBC counts. In phase 1 studies, thrombocytopenia was also more frequent and more severe than leukopenia.12 Interestingly, cytopenias resolved spontaneously during continued therapy between days 6 and 12 of treatment. This phenomenon is reminiscent of the experience with mTOR inhibitor rapamycin use in recipients of renal transplants, in whom thrombocytopenia and leukopenia developed during the first 4 weeks of treatment but then resolved spontaneously.19 The doses of CCI-779 used in our mouse model were comparable to doses used in phase 1-2 studies (25-250 mg as a single dose), which were effective in blocking p70S6K activity downstream of mTOR in peripheral blood lymphocytes used as surrogates for tumor tissue.20 Efficacy in the myeloma xenograft model was associated with an induction of G1 arrest and apoptosis in tumor cells. These results further support the potential of mTOR inhibitors in the treatment of MM, previously suggested by our in vitro studies.9,11,13
The differential in vivo sensitivities of the 2 tumor lines (8226 and OPM-2) we studied reflected their different sensitivities to in vitro treatment. The 8226 cell line has an ED50 of 3.0 nM for in vitro induction of G1 arrest, and the OPM-2 line has an ED50 of 0.2 nM.11 The increased sensitivity of the OPM-2 cell line may be related to its PTEN-mutated state and resultant heightened AKT activity. In several other tumor models, heightened AKT activity correlates with hypersensitivity to CCI-779 in vitro and in vivo.14 In support of this hypothesis, U266 cells transfected with constitutively activated myr-AKT were significantly more sensitive to the antitumor effects of CCI-779 than control U266 cells in our xenograft model (Figure 7B). These findings are reminiscent of other studies in which altered AKT activity in prostate and glioblastoma cells regulates sensitivity to CCI-779 in vitro and in vivo.10,14
Although the incidence of PTEN mutation or PTEN silencing in myeloma is unknown, other molecular abnormalities may contribute to a heightened basal level of AKT activity and sensitivity to CCI-779. For example, myeloma cells expressing activating N-RAS or K-RAS mutations contain hyperactivated AKT down-stream of RAS signaling and are hypersensitive to mTOR inhibitors in vitro.9 Furthermore, these mutations are relatively common in myeloma patients, occurring in as many as 50% in some studies.21 Thus, if future clinical studies are performed with CCI-779 in myeloma patients, correlations of outcome should be attempted with the presence or absence of PTEN or RAS mutations and, if possible, with MM cell AKT status. Whether resistant cells alter their AKT or mTOR status as an adaptation to treatment with mTOR inhibitors is also testable, and future studies will be designed to ask these questions of the 75% of OPM-2 tumors that relapse after therapy.
Of the parameters that could determine tumor size, significant CCI-779-induced alterations were demonstrated in proliferative capacity, apoptosis, and angiogenesis. CCI-779 also decreased cell size to a modest extent that might have been part of an antitumor response, but sometimes responses were observed in the absence of decreases in cell volume (ie, at day 13 in 8226 tumors). The decrease in proliferation, assessed by Ki-67 staining, was not surprising. The mTOR inhibitor rapamycin basically induces G1 arrest,7 and our previous studies of 8226 and OPM-2 cell lines demonstrate an CCI-779-induced decrease in G1-S-phase transition after in vitro treatment.11 G1 arrest is presumably caused by diminished D-cyclin and c-myc expression and increased p27 CDK inhibitor expression. CCI-779-induced effects on cyclin D1, c-myc, and p27 expression in 8226-compared with OPM-2-challenged mice roughly correlated with the observed sensitivity to tumor cytoreduction. In the markedly sensitive OPM-2 tumors, a strong inhibition of cyclin D1 expression and an increase in p27 expression was seen even at the lowest dose of CCI-779, and a modest inhibition of c-myc expression was present at the 20 mg/kg dose. In the less sensitive 8226 tumors, cyclin D1 expression was decreased and p27 expression was increased only at the highest CCI-779 dose, and c-myc expression actually increased.
In previous studies of in vitro-grown 8226 and OPM-2 cell lines, cyclin D1 expression was modest.22,23 In contrast, cyclin D2 expression was significant probably because of the overexpression of the c-maf transcription factor.24 Using antibodies specific for cyclin D1 or D2, our studies of in vitro-grown 8226 and OPM-2 cells are similar (not shown), with significantly greater cyclin D2 expression. However, when these same antibodies were used in immunoblot assays on tumor nodules removed from untreated mice, cyclin D2 expression could not be detected. The reasons for this discrepancy are unknown. With little cyclin D2 expression in vivo, D1 expression might have become enhanced and might have been primarily used as the driving force for G1-S transition, thus explaining a possible key role of CCI-779-induced D1 inhibition in the observed antitumor response.
In contrast to the Ki-67 results, the induction of apoptosis was surprising because exposing 8226 or OPM-2 cells to rapamycin or CCI-779 in vitro does not result in apoptosis.11,25 However, as with the Ki-67 results, the in vivo induction of apoptosis was greater in the hypersensitive OPM-2 tumors than in 8226 tumors. One obvious difference between in vivo and in vitro conditions is the requirement for angiogenesis to maintain tumor cell viability in the former condition. Immunohistochemistry analysis demonstrated a CCI-779-dependent inhibition of angiogenesis in tumor beds in OPM-2 and 8226 cells, possibly inducing a hypoxic apoptotic response in treated tumors. As with the inhibition of proliferation, angiogenesis in OPM-2 tumors was more sensitive to CCI-779 treatment than it was in 8226 cells. Recent experiments have shown that the AKT/mTOR pathway regulates the expression of vascular endothelial growth factor (VEGF)26 and hypoxia inducible factor-1α (HIF-1α).27 Therefore, it is possible that myeloma cells with heightened AKT activity are more sensitive to the CCI-779-mediated inhibition of these critical angiogenic factors. Alternatively, other factors occurring in vivo but not in vitro could interact with CCI-779 to result in tumor cell apoptosis. Whether this differential effect was also caused by differences in AKT activity will be tested in future studies.
In summary, our results provide further support for the potential of CCI-779 in the treatment of patients with myeloma. CCI-779 demonstrated a dose-dependent antitumor effect in a myeloma xenograft model and was relatively nontoxic at effective doses. In phase 2 studies of myeloma patients, it will be interesting to see whether efficacy correlates with AKT status and induced cyclin/myc/p27 alterations, as it appears to do in preclinical studies.
Prepublished online as Blood First Edition Paper, August 10, 2004; DOI 10.1182/blood-2004-03-1153.
Supported by grant CA 96920 from the National Institutes of Health; research funds from the Veteran's Administration, including Cancer Gene Medicine, the Research Enhancement Awards Program; and funds from the Multiple Myeloma Research Foundation.
An Inside Blood analysis of this article appears in the front of this issue.
The publication costs of this article were defrayed in part by page charge payment. Therefore, and solely to indicate this fact, this article is hereby marked “advertisement” in accordance with 18 U.S.C. section 1734.
We thank Nazlin Sharif for performing the immunohistochemistry procedures and Anushree Sharma for her contributions to this study.


This feature is available to Subscribers Only
Sign In or Create an Account Close Modal