Abstract
In this study we quantified the proliferation rate of normal and malignant plasma cells (PCs) by ex vivo incorporation of 5-bromo-2′-deoxyuridine (BrdU; labeling index, LI) using flow cytometry. We show that all bone marrow PCs, either normal or malignant, include a subset of proliferating PCs present within the CD45bright fraction. Indeed, medullary normal and malignant PCs were always heterogeneous for CD45 expression, and proliferation was always restricted primarily to the CD45bright compartment. Moreover, an inverse correlation was found between LI or CD45 and B-cell lymphoma 2 (Bcl-2) in both malignant and normal PCs, the most proliferating CD45bright PCs have the lowest Bcl-2 expression. We investigated expression of molecules of interest in multiple myeloma (MM)—that is, CD138, CD19, CD20, CD27, CD28, CD56, and CD11a—to further characterize the CD45bright fraction. Among all of these molecules, only CD11a was exclusively expressed by CD45bright proliferating myeloma cells. In conclusion, proliferating myeloma cells are characterized by the specific CD45bright CD11apos Bcl-2low phenotype. (Blood. 2005;105:4845-4848)
Introduction
Multiple myeloma (MM) is primarily conceptualized as an accumulative disease. Indeed, most studies evaluating the labeling index (LI) of plasma cells (PCs) revealed that it rarely exceeded 1%. However, as early as 1981, Drewinko et al1 showed that in vivo myeloma cells were generally nonproliferating, although a small fraction of them could proliferate (growth fraction, GF). Thus, they proposed the concept that this minor GF could give rise to the major nonproliferating fraction.
Myeloma cells either lack or express a weak to intermediate level of CD45.2,3 However, in previous studies we have shown that CD45 and also CD11a are frequently expressed by a subset of myeloma cells only.3 It has been demonstrated that CD45 expression is highly correlated with the proliferation rate of myeloma cells.4,5 With regard to normal counterparts, PCs are heterogeneous in terms of CD45 phenotype. Recently, Medina et al6 confirmed the association of maturity with decreasing CD45 expression.7-9 Generation of PCs from B cells, mainly studied in vitro in humans, is a multistep process that involves both proliferation and maturation/differentiation.10-13 The aim of this study was to evaluate the proliferation of different types of normal PCs in relation to their phenotype, especially to CD45, to understand the biology of polyclonal and monoclonal PC expansions that are reactive plasmacytoses (RP) and MM, respectively.
Study design
Samples and reagents
Forty-nine consecutive patients with MM (25 at diagnosis, 24 at relapse) were included in this study. Bone marrow and blood samples from healthy donors or patients with reactive plasmacytosis, and tonsil samples were obtained and prepared as described.3,13 Approval was obtained from the Nantes University Hospital Institutional Review Board for these studies. Informed consent was provided according to the Declaration of Helsinki. Antibodies directed against (1) CD11a, CD19, CD45, CD138, Apo2.7 and (2) CD28, CD38, CD56, 5-bromo-2′deoxyuridine (BrdU) were from Beckman Coulter (Miami, FL) and BD Biosciences (San Jose, CA), respectively.
Cell staining
Mononuclear cells (MNCs; 0.5-3 × 10⁶) were stained in a 4-color assay with anti-CD45-fluorescein isothiocyanate (FITC; J33), anti-CD138-phycoerythrin cyanine 5 (PECy5; B-B4), anti-CD38-APC (HB7) and control-PE, anti-CD56-PE (MY31), anti-CD28-allophycocyanin (PE; L293), anti-CD19-PE (J4.119), anti-APO2.7-PE (2.7A6A3), anti-CD11a-PE (25.3) monoclonal anti-bodies (mAbs) as described.14 To determine CD45-FITC fluorescent staining, MNCs were stained with isotype-FITC, anti-CD38-APC, anti-CD45-PECy5, and anti-CD138-PE mAbs. For intracellular Bcl-2 staining, MNCs were first stained with anti-CD38-APC, anti-CD45-PECy5, and anti-CD138-PE mAbs, then with anti-Bcl-2-FITC (124; Dako, Glostrup, Denmark) or control isotype-FITC mAbs after permeabilization (Intra Prep; Beckman Coulter). For LI, cells were incubated overnight with or without 50 μM BrdU (5-bromo-2′-deoxyuridine; Sigma, St Louis, MO) at 37°C in culture medium, then stained with anti-CD45-APC, anti-CD38-PE, and anti-CD138-PECy5 mAbs (with anti-CD45-APC and anti-CD38-PE mAbs for tonsil and blood PCs), permeabilized, and stained with anti-BrdU as described.12
Flow cytometry analysis
Statistical analysis
Statistical analyses were performed using nonparametric Wilcoxon rank sum, Spearman correlation coefficient, and the sign tests.
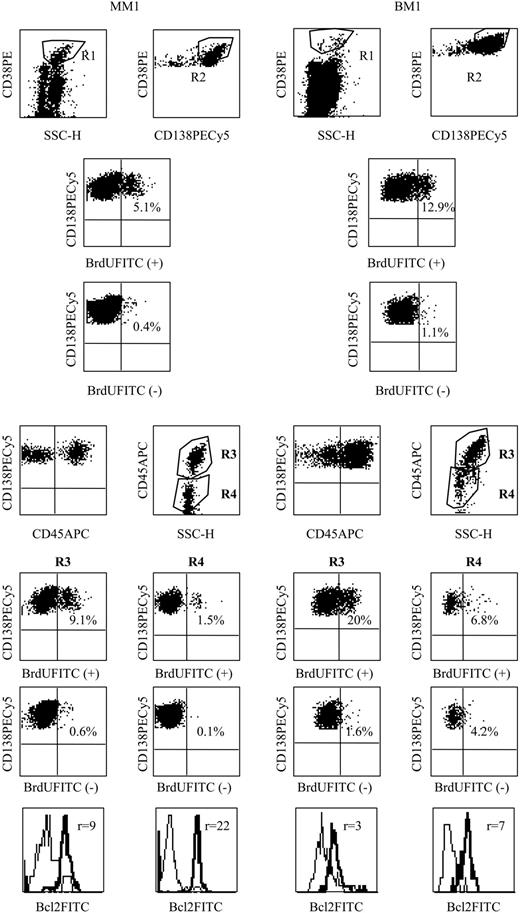
CD45 phenotype and LI of myeloma and bone marrow PCs. PC phenotype analysis was performed in 2 steps. In the first step, 15 000 total events were acquired to draw a PC gate in the side scatter (SSC)/CD38++ dot-plot (R1). In the second step, an acquisition of 15 000 PCs (at least 1000 PCs for very low plasmacytoses) was performed through the R1 live-gate. PCs were identified by coexpression of CD38 and CD138 (gate R2). A third region was set on the light scatter of the cells satisfying both R1 and R2 to exclude debris or apoptotic PCs with a low CD138 expression and a characteristic light-scatter distribution.12 The lack of Apo 2.7 staining in the gated population confirmed that cells were not apoptotic.15 Then 2 PC subpopulations were identified on the CD45 versus SSC dot plot: R3 was set around PC with a large SSC expressing a high level of CD45, while R4 was set around PC with low SSC and negative or weak CD45 expression. The analyses of the phenotype and the LI were performed in these 2 PC subpopulations, separately and simultaneously. The percentage of BrdU+ PCs within the population incubated with BrdU (BrdU+) or without (control, BrdU-) were indicated within the cytograms. For example, in patient MM1 the global LI was 1.7% (3.1%-1.4%) but 8.5% (9.1%-0.6%) in R3 and 1.4% (1.5%-0.1%) in R4. Overlay histograms represent the immunofluorescence of Bcl-2 (thick line) over the control (thin line). r indicates the ratio of MFI.
CD45 phenotype and LI of myeloma and bone marrow PCs. PC phenotype analysis was performed in 2 steps. In the first step, 15 000 total events were acquired to draw a PC gate in the side scatter (SSC)/CD38++ dot-plot (R1). In the second step, an acquisition of 15 000 PCs (at least 1000 PCs for very low plasmacytoses) was performed through the R1 live-gate. PCs were identified by coexpression of CD38 and CD138 (gate R2). A third region was set on the light scatter of the cells satisfying both R1 and R2 to exclude debris or apoptotic PCs with a low CD138 expression and a characteristic light-scatter distribution.12 The lack of Apo 2.7 staining in the gated population confirmed that cells were not apoptotic.15 Then 2 PC subpopulations were identified on the CD45 versus SSC dot plot: R3 was set around PC with a large SSC expressing a high level of CD45, while R4 was set around PC with low SSC and negative or weak CD45 expression. The analyses of the phenotype and the LI were performed in these 2 PC subpopulations, separately and simultaneously. The percentage of BrdU+ PCs within the population incubated with BrdU (BrdU+) or without (control, BrdU-) were indicated within the cytograms. For example, in patient MM1 the global LI was 1.7% (3.1%-1.4%) but 8.5% (9.1%-0.6%) in R3 and 1.4% (1.5%-0.1%) in R4. Overlay histograms represent the immunofluorescence of Bcl-2 (thick line) over the control (thin line). r indicates the ratio of MFI.
Results and discussion
Myeloma cells and bone marrow PCs were heterogeneous: proliferation was restricted to the CD45bright SSChigh compartment
The percentage of BrdU-positive myeloma cells was low, generally around 1% (n = 49 patients). In all patients, myeloma cells were heterogeneous for CD45 expression and SSC, allowing a delineation of 2 compartments: CD45brightSSChigh and CD45int/lowSSClow. The CD45brightSSChigh compartment was always present, representing 12% (median) of myeloma cells (illustrated in Figure 1). The second compartment CD45int/lowSSClow represented the majority of tumor cells (88%). We observed that the LI of the CD45brightSSChigh compartment was always greater than that of the CD45int/lowSSClow compartment and far above 1% (median, 6.8%; n = 49; Table 1). In general, the CD45brightSSChigh compartment had a 6.8 higher proliferative level than the CD45int/lowSSClow compartment (P < .01). As outlined in Table 1, the LI of the CD45bright compartment could reach 40% of myeloma cells, which was similar to what we observed in reactive plasmacytoses,12 suggesting that in these patients, almost all CD45bright myeloma cells were proliferating. Of note, the total LI correlated highly with the LI of the CD45bright compartment (r = 0.81, P < .001) and less with that of the CD45low compartment (r = 0.44, P < .01).
CD45 expression and labeling index of PCs
Cell type . | Cells, % . | . | MFIR . | . | PCLI, %, . | . | |||
|---|---|---|---|---|---|---|---|---|---|
| . | Median . | Range . | Median . | Range . | Median . | Range . | |||
| Multiple myeloma | |||||||||
| CD45brightSSChigh | 12 | 2-68 | 34 | 10-92 | 6.8 | 0.5-40 | |||
| CD45lowSSClow | 88 | 32-98 | 1.2 | 1-3.8 | 1 | 0.2-16.6 | |||
| Normal bone marrow | |||||||||
| CD45brightSSChigh | 65 | 45-87 | 29.8 | 15-46.3 | 20.5 | 2.6-38 | |||
| CD45lowSSClow | 35 | 13-55 | 1.7 | 1-4.2 | 3.6 | 0-12 | |||
| Tonsil | |||||||||
| CD45brightSSChigh | 100 | 43-100 | 75 | 43-97 | 11.4 | 7-14 | |||
| CD45lowSSClow | 0 | 0-57 | — | — | — | — | |||
| Peripheral blood | |||||||||
| CD45brightSSChigh | 100 | 100 | 24 | 14-50 | 15.9 | 12.5-17 | |||
| CD45lowSSClow | 0 | 0 | — | — | — | — | |||
| Reactive plasmacytosis | |||||||||
| CD45brightSSChigh | 100 | 100 | 67 | 39-95 | 33 | 23-52 | |||
| CD45lowSSClow | 0 | 0 | — | — | — | — | |||
MFIR indicates mean of fluorescence intensity ratio; PCLI, plasma cell labeling index; and —, no data (no cells).
As observed for myeloma cells, 2 compartments of PCs delineated by CD45 and SSC were found in normal bone marrows (n = 11, illustrated in Figure 1). The CD45brightSSChigh compartment, which represented 65% of the PCs, was highly proliferative (LI = 18.4% for BM1). The second CD45lowSSClow compartment included 35% of the PCs with a much lower LI: 2.6% (BM1 and Table 1). A subset of PCs which lacked CD45 expression was observed in 2 cases.
Tonsillar and peripheral PCs were homogeneous and were capable of proliferation
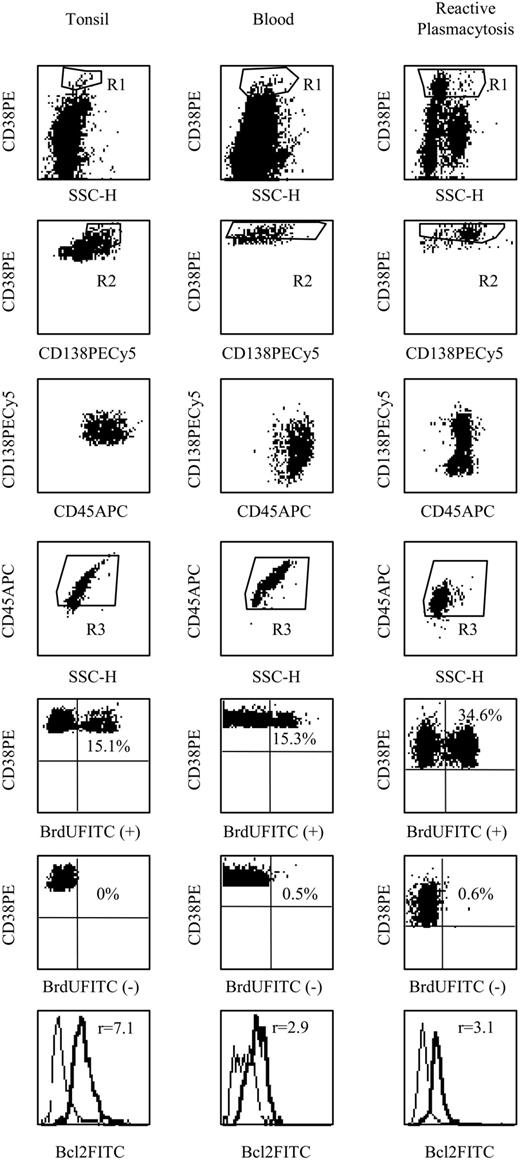
In Figure 2, we show that PCs from both tonsils and blood, the prototypes of immature PCs, were homogeneously CD45bright and capable of proliferation (LI > 10%). Reactive PCs turned out to be similar to blood PCs with higher LI.
BrdU+ myeloma cells expressed lower Bcl-2 levels
Since we have previously observed that Bcl-2 inversely correlates with the LI in both reactive PCs and myeloma cells,16 we looked for a correlation within myeloma and PC subsets (Figures 1, 2). We found that CD45bright myeloma cells always expressed a lower level of Bcl-2 compared with that of CD45low/neg myeloma cells (P < .01). In normal bone marrow (BM), a significant increase in Bcl-2 MFIR (mean of fluorescence intensity ratio) was observed in the CD45low bone marrow PCs in comparison with that of the CD45bright PCs: 7.4 (4.9-13) versus 4.2 (3.1-9), P < .01. Concerning tonsillar and circulating PCs, we found a highly significant negative correlation between Bcl-2 MFIR and the LI (r = -0.854, P < .001). This inverse correlation in PCs is in agreement with data showing that (1) Bcl-2 negatively controls the proliferation of different human cells types,17 and (2) Bcl-2 transgenic mice have increased B-cell memory and PC-producing immunoglobulins.18 Up-regulation of Bcl-2 thus appears to be a critical event during this process of maturation with proliferation decrease and arrest.
Phenotypic characterization of the CD45bright SSChigh proliferating compartment in MM: only CD11a expression was restricted to the CD45bright SSChigh subset
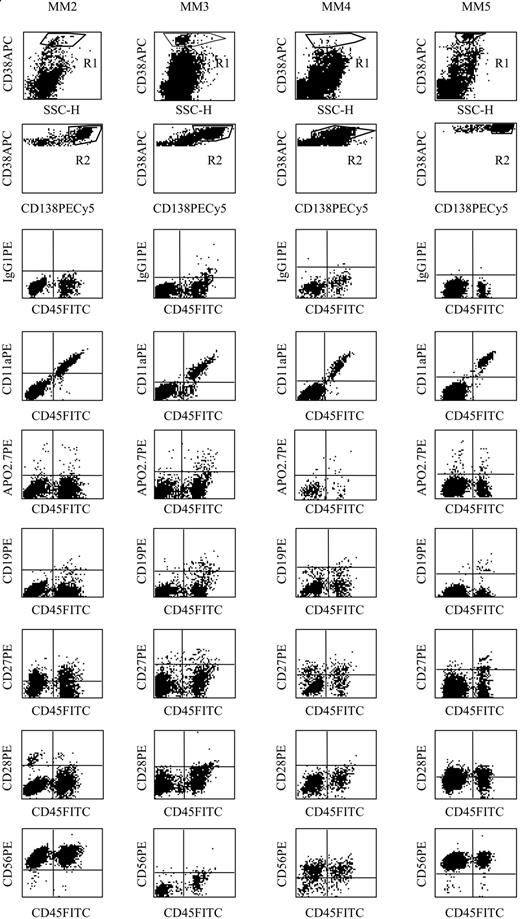
We further characterized the phenotype of the CD45bright myeloma cells using relevant MM markers (CD19, CD20, CD27, CD28, CD56). As illustrated in Figure 3, CD19, CD27, CD28, and CD56 were expressed or not by myeloma cells, and their expression was unrelated to CD45 subsets. However, we found that CD11a overlapped completely with the CD45bright compartment in all the patients studied (Figure 3), while CD45low/neg myeloma cells were negative for CD11a. Ahsmann et al19 have published that lymphocyte function-associated antigen 1 (LFA-1) (CD11a-CD18) expression correlated with tumor growth in MM. LFA-1 is involved in either homotypic or heterotypic interactions in MM. Indeed, human myeloma cells, like stromal cells, express the 3 ligands of LFA-1: intercellular adhesion molecule-1 (ICAM-1) (CD54), ICAM-2 (CD102), and ICAM-3 (CD50).3,20 These interactions, restricted to the most proliferative compartment, could have some important consequences for tumor behavior. For example, we have previously observed that ICAM-2/LFA-1 interactions were involved in the (negative) control of myeloma cell growth through CD40.20
CD45 phenotype and LI of tonsillar, peripheral normal, and reactive PCs. Analysis of phenotype, LI, and Bcl-2 expression in PCs isolated from tonsil and blood. PCs were identified by CD38++ expression (SSC/CD38) since CD138 expression was low in tonsil PCs and heterogeneous in peripheral PCs.
CD45 phenotype and LI of tonsillar, peripheral normal, and reactive PCs. Analysis of phenotype, LI, and Bcl-2 expression in PCs isolated from tonsil and blood. PCs were identified by CD38++ expression (SSC/CD38) since CD138 expression was low in tonsil PCs and heterogeneous in peripheral PCs.
Phenotype of CD45bright myeloma cells. The phenotype of myeloma cells from 4 patients was determined in a 4-color assay. Myeloma cells were identified by coexpression of CD38 and CD138, and their phenotype (CD11a, CD19, CD27, CD28, CD56, Apo2.7) was analyzed in both CD45weak/neg and CD45bright subsets. Ig indicates immunoglobulin.
Phenotype of CD45bright myeloma cells. The phenotype of myeloma cells from 4 patients was determined in a 4-color assay. Myeloma cells were identified by coexpression of CD38 and CD138, and their phenotype (CD11a, CD19, CD27, CD28, CD56, Apo2.7) was analyzed in both CD45weak/neg and CD45bright subsets. Ig indicates immunoglobulin.
Interleukin 6 (IL-6) has been shown to be a survival and growth factor for human myeloma cells.21,22 More recently, it has been demonstrated that IL-6 preferentially stimulates CD45bright myeloma cells to proliferate23,24 through activation of CD45-associated src kinase.24 Of note, CD45bright myeloma cells express more IL-6 receptors.25 IL-6 is also a survival and proliferative factor for nonmalignant PCs.12,13,26 Taken altogether, these data show that CD45bright myeloma cells, like their normal counterparts (CD45bright normal PCs), could be the main target of IL-6 to sustain survival and proliferation.
In conclusion, we have found that all patients with MM have a small proliferative compartment of myeloma cells characterized by a bright expression of CD45 and a specific expression of CD11a as well as a low Bcl-2 expression (sensitive to apoptosis). This CD45brightCD11apos population of myeloma cells could constitute the growth fraction as defined in vivo by Drewinko et al1 more than 20 years ago. Thus, this “to be killed” population could be targeted through CD45- or CD11a-targeted therapies.
Prepublished online as Blood First Edition Paper, March 1, 2005; DOI 10.1182/blood-2004-12-4700.
Supported by the Ligue Nationale Contre le Cancer (Equipe labellisée 2004).
The publication costs of this article were defrayed in part by page charge payment. Therefore, and solely to indicate this fact, this article is hereby marked “advertisement” in accordance with 18 U.S.C. section 1734.


This feature is available to Subscribers Only
Sign In or Create an Account Close Modal