Abstract
Aim
The objective of this study was to determine the in vivo distribution of dendritic cells (DC) when given to patients (pts) with Multiple Myeloma (MM) via varying routes of injection (intravenous- IV, intranodal- IN, intradermal-ID and subcutaneous-SC) by using ex vivo Indium111 Oxine (In111, T1/2 = 68h) labelled DC. Six (6) eligible pts had stable or slowly progressive MM not requiring systemic therapy with evidence of increased MUC-1 expression. Autologous monocytes were collected from each patient via apheresis and dendritic cells were produced by in vitro culture within the VacCell®processor.
Method
Cells were cultured for 7 days with GM-CSF and IL-13 on days 0 and 4 and after purification by counter-flow elutriation DC were pulsed with MUC1-Mannan fusion protein (24h) prior to use. DC were non-matured (imDC, n=3), or matured (mDC, n=3) with 1μg/ml FMKp and 500 UI/ml gamma IFN (6h) for subsequent In111 labelling. Cells were labelled with In111 (20 Mbq IV or 0.7 Mbq minimum each of IN, ID and SC) for 45–60 minutes in 0.9% NaCl with 5% autologous serum at room temperature, and washed twice before resuspension for administration. Pts received DC initially IV and then two weeks later by each of IN, SC, ID simultaneously. Pts at each DC administration were serially imaged using a planar gamma camera for up to 4 days.
Results
Mean DC labelling efficiency (based upon retained label in cells vs total label used) was 86% (54–95, n =12). Mean IV injection was 1.5 x 10⁸ cells (0.33–2.5 x 10⁸, n = 6), and IN, SC, ID was 2.0 x 10⁷ cells (1.3–3.6 x 10⁷, n = 6).
IV: At 1 and 4h cells were predominantly visible in the lungs. After 24h -72h lungs were clearing with DC migrating to liver, spleen and later to bone marrow.
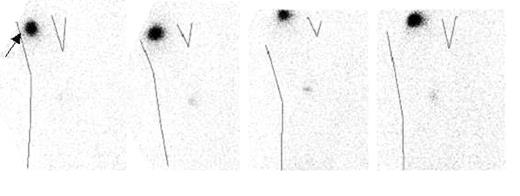
ID and SC: imDC migrated to axillary LN in 1/3 ID and 1/3 SC injections whilst mDC tracked to LN in 2/3 ID injections and 3/3 SC injections. Quantitation of tracking was possible in 5/7 of the serial images.
Quantitative analysis of serial images after mDC and imDC injection indicating cells in the afferent axillary LN as a percentage of all cells injected ID or SC.
| Cell Preparation . | 4 hours . | 24 hours . | 48 hours . | 72 hours . |
|---|---|---|---|---|
| mDC SC | 0.06% | 0.22% | 0.74% | 1.30% |
| mDC SC | 0.10% | 0.40% | 0.67% | 0.73% |
| imDC ID | 0.01% | 0.14% | 0.30% | 0.48% |
| mDC ID | 0.02% | 0.26% | 0.43% | 1.08% |
| mDC ID | 0.36% | 0.80% | 0.83% | 1.29% |
IN: IN injections were retained within the node, but in 1/3 imDC and 2/3 mDC there was early and substantial drainage into an afferent LN (<4 hours, >3% of cells).
Sequential planar gamma images (left to right, 2 hrs, 18 hrs, 51.5 hrs and 75 hrs after injection) in one pt after ID injection of mDC. The arrow indicates injection site over the right deltoid in the raised arm (shown as outline) with subsequent progressive accumulation of cells into afferent axillary LN. Conclusion ID and SC images suggest mDC track more consistently to LN, whilst IV mDC cleared more slowly from lungs at 24h compared to imDC.
Sequential planar gamma images (left to right, 2 hrs, 18 hrs, 51.5 hrs and 75 hrs after injection) in one pt after ID injection of mDC. The arrow indicates injection site over the right deltoid in the raised arm (shown as outline) with subsequent progressive accumulation of cells into afferent axillary LN. Conclusion ID and SC images suggest mDC track more consistently to LN, whilst IV mDC cleared more slowly from lungs at 24h compared to imDC.
Author notes
Corresponding author


This feature is available to Subscribers Only
Sign In or Create an Account Close Modal