Mice with combined deficiencies of the low-density lipoprotein receptor (LDLR–/–) and the catalytic component of an apolipoprotein B–edisome complex (APOBEC1–/–) that converts apoB-100 to apoB-48 have been characterized, and this model of LDL cholesterol–driven atherosclerosis was applied to an investigation of the role of fibrinogen (Fg) in the genesis and progression of the plaque. LDLR–/–/APOBEC1–/–/FG–/–(L–/–/A–/–/FG–/–) triple-deficient mice presented more advanced plaque in their aortic trees and aortic sinuses at 24, 36, and 48 weeks of age compared to L–/–/A–/– mice, a feature that may result from enhanced platelet activation in these former mice. This is supported by the presence of hypercoagulability, increased CD61 and CD62P on resting platelets, and higher plasma soluble P-selectin in L–/–/A–/–/FG–/– mice as compared to L–/–/A–/–, FG–/–, or wild-type mice. The elevated higher molecular weight forms of von Willebrand factor (VWF) in L–/–/A–/–/FG–/– mice, revealed by increased VWF collagen binding activity, perhaps resulting from down-regulation of its cleaving metalloproteinase, ADAMTS13, further indicates enhanced platelet activation. Thus, the earlier arterial plaque deposition in L–/–/A–/–/FG–/– mice appears to contain a contribution from enhanced levels of thrombin and activated platelets, a synergistic consequence of an Fg deficiency combined with a high LDL cholesterol concentration.
Introduction
Mouse models of atherosclerosis have vastly improved with the advent of in vivo gene manipulation technologies. On normal low-fat diets, the plasma cholesterol of mice is primarily packaged in the high-density lipoprotein (HDL) fraction. In contrast, humans have higher resting plasma total cholesterol (total-C) levels, and about 70% of the cholesterol is contained in the low-density lipoprotein (LDL) fraction. Several factors may contribute to these differences. Mice secrete both apolipoprotein (apo)B-100 and apoB-48 containing very low density lipoproteins (VLDL), which are synthesized in the liver.1 In contrast, humans secrete only apoB-100 containing VLDL,2 because humans do not express the apoB editing catalytic polypeptide-1 (apobec1) in liver.3 ApoB-48 is produced from apoB-100 by an apobec1-catalyzed editing process that generates an in-frame stop codon in apoB-100. The C-terminus of apoB-100, absent in apoB-48, is essential for binding to the LDL receptor (Ldlr). Additionally, apoB-48–positive LDL also contains apoE, and this LDL particle is rapidly cleared by the apoE receptor instead of the Ldlr.
A major mouse model for the study of atherosclerosis is the apoE-deficient (APOE–/–) line. These mice present with severe hypercholesterolemia on a normal chow diet and develop spontaneous atherosclerosis.4,5 However, in APOE–/– mice, the plasma cholesterol is mainly associated with the VLDL and intermediate-density lipoprotein (IDL) fractions. Thus, these mice are models of human type III hyperlipidemia. Contrarily, in human atherosclerosis, type IIa hypercholesterolemia is frequently observed, with elevated plasma LDL cholesterol (LDL-C) due to reduced efficiency of the Ldlr. To attempt to represent this latter state, LDLR–/– mice were generated.6 However, these mice demonstrate only a moderate elevation of plasma total-C levels, and they do not develop spontaneous atherosclerosis on a normal chow diet.6 Mouse liver can express apobec1, and about 70% of its VLDL contains apoB-48, with 30% apoB-100.1 Thus, most of the LDL in mice is apoB-48 positive and is not dependent on the Ldlr for its clearance. On the other hand, LDLR–/– mice are hyperlipidemic,7 and this property leads to spontaneous plaque formation in the aorta when these mice are placed on high-fat diets.8 Nonetheless, LDLR–/– mice also present with high VLDL-C.7 Thus, in terms of lipid metabolism, neither of these strains reflects the lipid profiles found in human type IIa familial hypercholesterolemia.
To resolve the limitations of LDLR–/– mice, the APOBEC1–/– mouse was developed. This deficiency does not result in elevations of plasma total-C and triglycerides (TG),9 but mice with a double deficiency of Ldlr and apobec1 (L–/–/A–/–) have high levels of LDL-C when fed a normal chow diet. Spontaneous atherosclerosis formation in the aorta also is found.10
In addition to functioning in clot formation, in some mammalian species fibrinogen (Fg) and fibrin play roles in other pathophysiologic processes, such as infection,11 wound healing,12,13 and progression of certain types of tumors.14 Additionally, the potential importance of fibrin(ogen) and its degradation products in the development of atherosclerotic plaques has been postulated,15-18 although it is unclear as to the extent to which the inflammatory response to enhanced Fg and/or the response of Fg to pre-existing inflammation, contributes to the development or progression of atherosclerosis.19 Thus, to investigate the function of Fg in atherosclerosis in defined systems in vivo, compound gene-deficient mice have been employed. In APOE–/–/FG–/– mice, plaque initiation and progression were similar to APOE–/– mice.20 Another murine model, apolipoprotein (a)–overexpressing transgenic mice (APO(a)tg),inan FG–/– background, (APO(a)tg/FG–/–) were generated.21 APO(a)tg mice presented with strain-dependent enhanced aortic Oil Red-O–positive simple fatty streaks when fed high-fat diets. However, these are not cholesterol-mediated events, since APO(a)tg expression had little effect on plasma total-C and TG levels in mice fed low- or high-fat diets. The function of apo(a) in this regard depends upon fibrin(ogen)-related consequences derived from its deposition in vessel walls.21 In support of this, attenuated plaque formation occurred in APO(a)tg/FG–/– mice.22 Because of their different mechanisms of plaque deposition, APO(a)tg mice are not models of LDL-C–mediated atherosclerosis.23 In yet another approach, a hyperlipidemic transgenic mouse line overexpressing ApoE*3 Leiden, combined with a transgenic hyperfibrinogenic background, did not reveal any differences in the plaque lesions that developed in single-transgenic ApoE*3 Leiden mice.24 However, in this model, platelets were not activated, and the cholesterol was mainly present as VLDL-C, with some apparent elevation of LDL-C.
In the present study, we provide evidence that the L–/–/A–/– mouse line is a useful and clinically relevant genetic model to attempt to understand the pathophysiology of human type IIa familial hypercholesterolemia and the roles of hemostasis and inflammation factors in plaque development therein. Accordingly, we have initiated such investigations by examining the role of Fg in plaque formation and progression in LDL-C–dominant atherosclerosis by employing L–/–/A–/–/FG–/– triple-deficient mice. The results of this work are summarized herein.
Materials and methods
Mice
L–/– mice were purchased from the Jackson Laboratory (Bar Harbor, ME). A–/–9,10 and Fg-deficient (FG–/–)25,26 mice were as described earlier. All mice were backcrossed into the C57Bl/6J strain for at least 7 generations before crossbreeding. L–/–/A–/– and L–/–/A–/–/FG–/– mice were obtained by multiple interbreedings of L–/–/A–/– and FG–/– mice and continuing with their offspring. Each genotype was determined using polymerase chain reaction (PCR) analysis with genomic DNA from ear punch biopsies. The primers and probes used for genotyping are summarized in Table 1. The mice were maintained on a standard low-fat chow diet for 12, 24, 36, 48, and 72 weeks and fasted for 6 hours prior to being killed (isoflurane inhalation). Complete exsanguination from the inferior vena cava was performed on each mouse, and the blood placed in sodium citrate, heparin, or standard acid-citrate-dextrose (ACD) as anticoagulants. Hearts and whole aortic trees were removed for morphometric analyses after perfusion of the mice with isotonic saline. The protocols for all animal experiments described were approved by the local Institutional Animal Care and Use Committee.
Primers and probes for genotyping of interbred mice with combined deficiencies of Ldlr, Apobec1, and Fg
Gene primer identification* . | Sequence of oligonucleotide . |
|---|---|
| LDLR | |
| WT-LDLR-F | 5′-CAAGACGTGCTCCCAGGATGACTTC |
| WT/N-LDLR-R (common)* | 5′-CTTGTCCTTGCAGTCTGCCTCGCC |
| WT-LDLR-FITC† | 5′-CAATCTCGGTCTCCATCACACAC-FITC |
| WT-LDLR-R640‡ | 5′-R640-ACTGCGGGGAGATGCACTTGCCATC-P |
| Null-LDLR-NEO | 5′-GATTGGGAAGACAATAGCAGGCATGC |
| Null-LDR-FITC† | 5′-GCTGGTTCTTTCCGCCTCAGAA-FITC |
| Null-LDLR-R705‡ | 5′-R705-CATAGAGCCCACCGCATCCCCA-P |
| APOBEC1 | |
| WT-APOBEC1-F | 5′-GCCACTATGCCCAGGTCA |
| WT/N-APOBEC1-R (common)* | 5′-CTCCAATACATACAGTTTCACCCAC |
| WT-APOBEC1-FITC† | 5′-TTAGAGTATTGTTACTGCTGGAGGAA-FITC |
| WT-APOBEC1-R640‡ | 5′-R640-TCGTCAACTACCCCCCTCTTCAAACG-P |
| Null-APOBEC1-NEO | 5′-ACAAGCAAAACCAAATTAAGGGCCA |
| Null-APOBEC1-FITC† | 5′-TGCTGATCTCGTTCTTCAGGCTAT-FITC |
| Null-APOBEC1-R705‡ | 5′-R705-AACTGACACATTTGGAAACCACAG TACTTAGAACCAC-P |
| FG | |
| WT/N-FG-F (common)* | 5′-CACAGCGGCTTGTCATTAG |
| WT-FG-R | 5′-CTGAAAGACCTGTCTTTGC |
| WT-FG-FITC† | 5′-TGAGCCACCCTTAGAAATACAGACC-FITC |
| WT-FG-R640‡ | 5′-R640-AGACATGAAAGGAGGAAAAGTTCCC-P |
| Null-FG-NEO | 5′-ACAAGCAAAACCAAATTAAGGGCCA |
| Null-FG-FITC† | 5′-TGCTGATCTCGTTCTTCAGGCTAT-FITC |
| Null-FG-R705‡ | 5′-R705-AACTGACACATTTGGAAACCACAGT ACTTAGAACCAC-P |
Primer used for both WT and null (N) alleles. F indicates forward; R, reverse.
Donor FRET probe.
Phosphorylated (P) acceptor FRET probes.
Lipid analysis of whole plasma
Plasma was separated from whole citrated blood and used for measurement of total-C and TG employing the Cholesterol CII (Wako Chemicals, Richmond, VA) and GPO-TRINDER kits (Sigma Diagnostics, St Louis, MO), respectively.
FPLC analysis of whole plasma
A volume of 100 μL plasma was analyzed by fast performance liquid chromatography (FPLC) using gel filtration on Superose 6 HR resin (Amersham Pharmacia Biotech, Piscataway, NJ). The samples were eluted at a flow rate of 0.5 mL/minute with column equilibration buffer, viz, 10 mM Tris (tris(hydroxymethyl)aminomethane)-HCl/0.15 M NaCl/0.01% (w/v) EDTA (ethylenediaminetetraacetic acid), pH 7.4.4 Column volumes (500 μL) were collected (36 fractions), and a 50-μL aliquot from each tube was added to 100 μL cholesterol CII reagent for determination of the cholesterol concentration in each fraction.
Analysis of atherosclerotic lesions of whole aortic trees
After perfusion of the mice, the aortas were cut longitudinally, in situ, exposing the lumen. Whole aortic trees were removed and placed on 150 μM gapped glass slides with the lumen side up. A glass slide was then placed over the aortic lumens to hold them in place during fixation. The aortas were fixed in 10% normal buffered formalin for 16 hours at room temperature, rinsed with H2O, and stained with Sudan IV (Sigma) solution (Sudan IV supersaturated in 38% 2-propanol) for 16 hours at 4°C. A digital camera (Model DP-10; Olympus, Melville, NY) with a surgical microscope (Model M651; Leica Microsystems, Bannockburn, IL) was used to capture whole images of entire aortic trees. The total numbers of pixels for the whole aorta and the plaque lesions were measured using Adobe Photoshop 7.0 (Adobe Systems, San Jose, CA). The percent of the total surface area covered by plaque in the aorta was then calculated.
Sectioning of hearts
Hearts were cut at the inferior aspect of the atrium. The region containing the aortic valve was fixed with periodate-lysine-paraformaldehyde (PLP) for 16 hours at 4°C. After fixation, some samples were directly embedded in Tissue-Tec OCT compound (Sakura Fine Tec, Torrance, CA), and others were processed and embedded in paraffin, cut side down. A total of 30 serial sections (from 1 to 30) were obtained at a 4-μM thickness from the aortic valve toward the ascending aorta.
Histochemistry for analysis of plaque progression in aortic sinuses
Serial sections 1, 11, and 21 were stained with hematoxylin II and eosin Y (H&E) (Richard Allen Scientific, Kalamazoo, MI) for morphometric analysis. Serial sections 2, 12, and 22 were stained with Oil Red-O (Sigma) for identification of lipid accumulation in the plaque. Serial sections 3, 13, and 23 were used for Masson's trichrome stain to identify collagen accumulation and smooth muscle cells (SMCs) in the plaque.
For the determination of the size of plaques in aortic sinuses, images were captured and calculated as described in “Analysis of atherosclerotic lesions of whole aortic trees.” The number of pixels was converted to μm2 with a reference hemocytometer grid. The thickness of the fibrous cap was measured on H&E-stained serial sections 1, 11, and 21 using SPOT MacOS version 4.0.9 software (Diagnostic Instruments, Sterling Heights, MI). For this, each section was measured in 2 to 5 regions across the length of the cap, bordered by the endothelial layer adjacent to the lumen, up to the starting edge of the plaque core, and averaged. The data were expressed as averages plus or minus SEM.
Immunohistochemistry
All slides were deparaffinized and then blocked with an avidin, biotin, and Peroxoblock (Zymed Laboratories, San Francisco, CA) before incubating with the specific antibodies. For fibrin(ogen) staining, the slides were blocked only with Peroxoblock. All immunohistochemistry slides were counterstained with hematoxylin QS (Vector Labs, Burlingame, CA).
Antifibrin(ogen) immunostaining. Serial sections 4, 14, and 24 were additionally blocked with normal rabbit serum. The sections were then incubated with goat anti–mouse fibrin(ogen) antibody (Nordic Immunology, Tillburg, The Netherlands), followed by rabbit anti–goat IgG in 10% normal mouse serum. A complex of horseradish peroxidase (HRP), goat anti-HRP (Dako, Carpentaria, CA), was added. The slides were developed with 3-amino-9-ethylcarbazole (AEC).
Anti-CD31 immunostaining for platelet endothelial-cell adhesion molecule-1 (PECAM-1). Serial sections 5, 15, and 25 were additionally blocked with 10% normal rabbit serum and incubated with monoclonal rat anti–mouse CD31 (Pharmingen, San Diego, CA), followed by biotinylated rabbit anti–rat IgG (Dako) in 5% preimmune mouse serum. After adding streptavidin-HRP, the sections were developed with 3,3′-diaminobenzidine (DAB).
Anti-MAC3, anti-F4/80, and anti-CD68 immunostaining for macrophage detection. Serial sections (6, 16, and 26) were further blocked with 10% normal goat serum and then incubated with a cocktail of monoclonal rat anti–mouse MAC3 (Pharmingen), monoclonal rat anti–mouse F4/80 (Serotec, Raleigh, NC), and monoclonal rat anti–mouse CD68. This was followed by HRP goat anti–rat IgG (Serotec). DAB chromogen (Vector Labs) was applied for positive staining.
Anti-SMCs. Serial sections 7, 17, and 27, and 8, 18, and 28 were incubated in 1% sodium dodecyl sulfate/0.1 M phosphate-buffered saline (PBS), pH 7.3, for antigen retrieval, followed by blocking steps. A nonserum protein (Dako) was used to block against nonspecific immunoglobulins. Sections 7, 17, and 27 were incubated with mouse anti–human α smooth muscle actin (SMA) (Sigma) and mouse anti–human nonmuscle heavy chain myosin (SMemb) (Research Diagnostics, Flanders, NJ) (sections 8, 18, and 28), followed by HRP rabbit anti–mouse IgG (Serotec) and AEC.
Image capture using microscopy
A Nikon Eclipse E600 light microscope (Nikon, Melville, NY) equipped with a Nikon E Plan 4 ×/0.10 objective lens was used to visualize aortic sinuses at an original magnification of × 40. A Nikon Plan Fluor 20 ×/0.50 objective lens was used to visualize individual plaques at an original magnification of × 200. Micrograph images were captured with a SOPOT RT-SE Slider-6 9.4 camera, and were acquired with SPOT 4.0.9 software (Diagnostic Instruments, Sterling Heights, MI). Images were then transferred to Adobe Photoshop 7.0 (Adobe Systems, San Jose, CA) for final reproduction.
Determination of coagulation factor activity in plasma
Prothrombin times (PT) and activated partial thromboplastin times (aPTT) were determined using STA-NEOPLASTIN and STA-PTT AUTOMATE kits, respectively (Diagnostica Stago, Asnieres, France). Plasma fibrinogen levels were measured using the Fibri-Prest Automate Kit (Diagnostica Stago). All assays were carried out with the Start-8 Coagulation Analyzer (Diagnostica Stago). Plasma levels of the thrombin-antithrombin complex (TAT) were determined using a TAT enzyme-linked immunosorbent assay (ELISA) kit (ERL, South Bend, IN).
Soluble P-selectin (sP-Sel) and von Willebrand factor (VWF) antigen (VWF-Ag) levels, VWF collagen binding activity (VWF-CBA), and a disintegrin-like and metalloproteinase with thrombospondin type-1 motif 13 (ADAMTS13) in plasma
Plasma concentrations of sP-Sel and ADAMTS13 were measured using colorimetric sandwich ELISA kits (R&D Systems, Minneapolis, MN, and American Diagnostica, Stamford, CT, respectively). VWF-Ag assays were performed by a sandwich ELISA with polyclonal rabbit–antihuman VWF (Dako) as the coating antibody, followed by the sample, and HRP anti-VWF (Dako). The substrate, 3,3′,5,5′-tetramethylbenzadine, was used for detection. The VWF-CBA assay was performed by the collagen-based ELISA as described27 with minor operational modifications. For VWF-Ag, VWF-CBA, and ADAMTS13, 1 unit was defined as the amount of these proteins found in 1 mL pooled WT mouse plasma.
Blood counts
Platelet numbers were counted in EDTA-treated blood using the VetScan HMT Hematology Analyzer (ABAXIS, Union City, CA).
Flow cytometric analysis of CD61 (integrin β3) and CD62P (P-Sel) on platelets
Whole blood from 12-week-old mice was withdrawn from the inferior vena cava with ACD as an anticoagulant. Resting platelets or activated platelets induced with 2 × 10⁻⁵ M ADP (Bio/Data Corporation, Horsham, PA) in ACD-treated whole blood were fixed with PBS containing 1% paraformaldehyde and 0.1% NaN3. After fixation, the cells were individually labeled with hamster anti–human CD61 or rabbit anti–human CD62P (BD Bioscience, San Jose, CA) polyclonal antibodies, followed by an Alexa Fluora 488–conjugated goat anti–hamster IgG or goat anti–rabbit IgG (Molecular Probes, Eugene, OR). Proper isotypic antibodies (BD Bioscience) were used as negative controls (viz, a hamster IgG1κ monoclonal antibody and a rat IgG1λ monoclonal antibody). The fluorescence signal was detected with a flow cytometer (Epics XL, Beckman Coulter, Fullerton, CA).
Statistical analysis
Data were analyzed using the Student t test and are represented as a mean plus or minus SEM. Two-way measures analysis of variance (ANOVA) also was used for determining significance. All analyses were performed using the computer-assisted Statview program (Abacus Concepts, Palo Alto, CA). P values less than or equal to .05 were considered significant.
Results
Lipid profiles
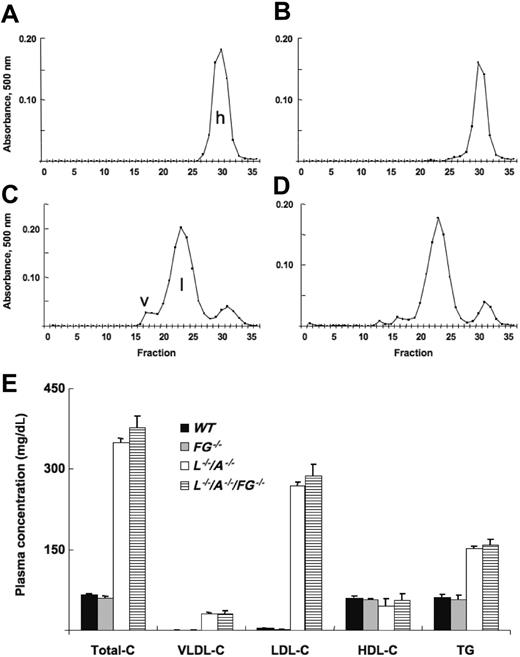
Total-C, VLDL-C, LDL-C, and TG levels were stable from 12 to 96 weeks in L–/–/A–/– mice, although a slight decrease of HDL-C was observed after 48 weeks (data not shown). Using 24-week mice as an example, total-C levels in WT and FG–/– mice were identical, and almost all of the cholesterol accumulated in HDL (Figure 1A,B). In contrast, total-C levels were extremely elevated in both L–/–/A–/– and L–/–/A–/–/FG–/– mice, and most of it was present in the LDL fraction (Figure 1C,D). There were no significant differences between L–/–/A–/– and L–/–/A–/–/FG–/– mice in plasma total-C, VLDL-C, LDL-C, or HDL-C levels, or in TG levels (Figure 1E).
Cholesterol content of various lipoprotein fractions. FPLC analysis of lipid profiles of plasma from (A) WT (n = 17), (B) FG–/– (n = 6), (C) L–/–/A–/– (n = 91), and (D) L–/–/A–/–/FG–/– (n = 15) mice. h indicates HDL; l, LDL; and v, VLDL. (E) Plasma concentrations of total-C, VLDL-C, LDL-C, and HDL-C, along with triglyceride (TG) levels in WT ([▪), FG–/– (▦), L–/–/A–/– (□), and L–/–/A–/–/FG–/– (▤) mice.
Cholesterol content of various lipoprotein fractions. FPLC analysis of lipid profiles of plasma from (A) WT (n = 17), (B) FG–/– (n = 6), (C) L–/–/A–/– (n = 91), and (D) L–/–/A–/–/FG–/– (n = 15) mice. h indicates HDL; l, LDL; and v, VLDL. (E) Plasma concentrations of total-C, VLDL-C, LDL-C, and HDL-C, along with triglyceride (TG) levels in WT ([▪), FG–/– (▦), L–/–/A–/– (□), and L–/–/A–/–/FG–/– (▤) mice.
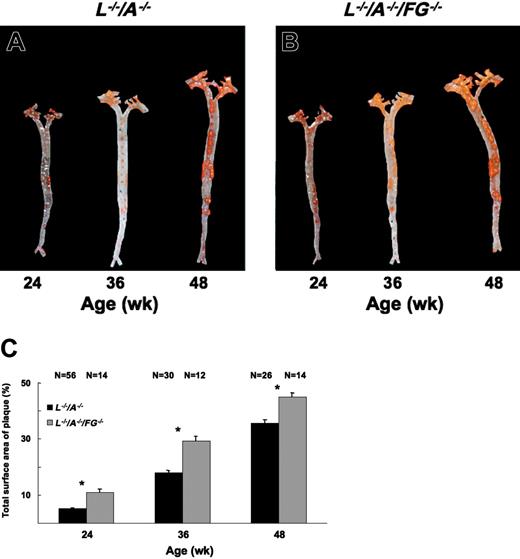
Plaque formation in entire aortic trees. Sudan IV staining of aortic trees of male (A) L–/–/A–/– and (B) L–/–/A–/–/FG–/– mice at 24, 36, and 48 weeks of age, showing the extent of lipid-containing plaque (red/orange stains) in these strains. (C) The percent of total surface occupied by plaque in the aorta between L–/–/A–/– (▪) and L–/–/A–/–/FG–/– (▦) mice. N = number of mice. *P < .001 between pairs.
Plaque formation in entire aortic trees. Sudan IV staining of aortic trees of male (A) L–/–/A–/– and (B) L–/–/A–/–/FG–/– mice at 24, 36, and 48 weeks of age, showing the extent of lipid-containing plaque (red/orange stains) in these strains. (C) The percent of total surface occupied by plaque in the aorta between L–/–/A–/– (▪) and L–/–/A–/–/FG–/– (▦) mice. N = number of mice. *P < .001 between pairs.
Plaque progression in aortic tree and aortic sinus
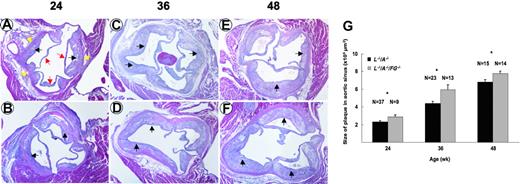
The surface area of plaque in aortic trees increased from 24 to 48 weeks in L–/–/A–/– mice (Figure 2A,C). In addition, the increase continued through 72 weeks in L–/–/A–/– mice (data not shown). This same surface plaque area in aortic trees was statistically higher in L–/–/A–/–/FG–/– mice at 24, 36, and 48 weeks (Figure 2B,C). However, the rate of accumulation of surface area plaque in the aortic tree was not statistically different between both genotypes (Figure 2C). The plaque size in the aortic sinus also increased from 24 to 48 weeks in L–/–/A–/– mice (Figure 3A,C,E), and this increase continued through 72 weeks in L–/–/A–/– mice (data not shown). Similarly, the size of the plaque in the aortic sinus was statistically greater in L–/–/A–/–/FG–/– mice at 24, 36, and 48 weeks (Figure 3B,D,F) than in L–/–/A–/– mice, as calculated in Figure 3G. However, the rate of plaque growth in the aortic sinuses in both genotypes was not statistically different (Figure 3G). Consistent with enhanced plaque surface area at each time point in L–/–/A–/–/FG–/– mice, relative to the equivalent time point in L–/–/A–/– mice, cap thinning was accelerated in L–/–/A–/–/FG–/– as compared to L–/–/A–/– mice; for instance, 40.92 ± 2.11 μM (n = 11) versus 94.96 ± 11.15 μM (n = 15), P = .0004, respectively, in 48-week mice.
Plaque formation in aortic sinuses of mice. H&E stains of aortic sinuses from L–/–/A–/– (A,C,E) and L–/–/A–/–/FG–/– (B,D,F) mice at 24, 36, and 48 weeks of age. Red arrows indicate the leaflets of aortic valves; yellow arrows, the vascular wall of aorta; and black arrows, the plaques. Original magnification, × 40. (G) Plaque sizes in aortic sinuses of L–/–/A–/– (▪) and L–/–/A–/–/FG–/– (▦) mice, as revealed by morphometric analysis of H&E-stained slides. *P < .05.
Plaque formation in aortic sinuses of mice. H&E stains of aortic sinuses from L–/–/A–/– (A,C,E) and L–/–/A–/–/FG–/– (B,D,F) mice at 24, 36, and 48 weeks of age. Red arrows indicate the leaflets of aortic valves; yellow arrows, the vascular wall of aorta; and black arrows, the plaques. Original magnification, × 40. (G) Plaque sizes in aortic sinuses of L–/–/A–/– (▪) and L–/–/A–/–/FG–/– (▦) mice, as revealed by morphometric analysis of H&E-stained slides. *P < .05.
Histologic characterization of plaques
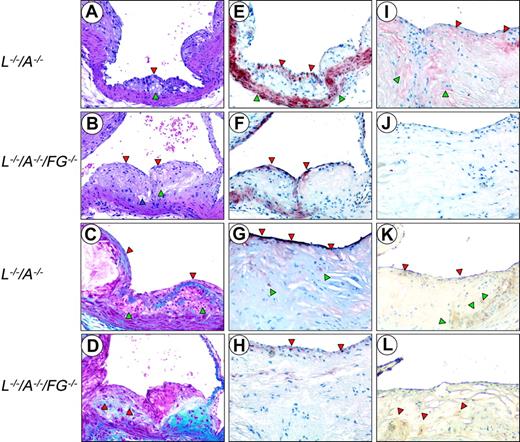
H&E stains from 24-week-old mice demonstrated that both L–/–/A–/– and L–/–/A–/–/FG–/– mice develop a well-formed fibrous cap encapsulating a foam cell-laden core (Figure 4A,B). The thinned cap in L–/–/A–/–/FG–/– mice at this time point was evident.
Trichrome stains also revealed a well-formed collagen-rich cap, encapsulating a foam cell-laden collagen-negative core at 24 weeks in L–/–/A–/– mice (Figure 4C). In contrast, there were no collagen-rich caps, but only subcapsular collagen deposits, at 24 weeks in the L–/–/A–/–/FG–/– mice (Figure 4D). At 48 weeks, collagen deposition was diminished and more diffusely distributed with focal, scantly stained patches of collagen in the L–/–/A–/–/FG–/– mice (data not shown). However, these same patterns were typically observed in L–/–/A–/– mice at the later time points of 60 and 72 weeks (data not shown).
Anti-CD31 immunostains demonstrated that both L–/–/A–/– and L–/–/A–/–/FG–/– mice displayed an intact endothelial-cell (EC) layer at 24, 36, and 48 weeks (not shown). Anti-SMA immunostains revealed a multilayered SMC-positive region associated with collagen deposits within the cap, as well as a normally SMC-positive medial compartment in 24-week L–/–/A–/– mice (Figure 4E). The collagen was positive in the core of the plaque and associated with SMCs at 36 weeks. These SMCs within the core were negative for αSMA stains but dominantly positive with SMemb (not shown), which is mainly expressed in embryonic and synthetic SMCs, but not in differentiated SMCs. This phenotypic conversion of SMCs also has been observed and well characterized in human subjects.28 The number of positive SMCs in the cap diminished at later time points in L–/–/A–/– mice (Figure 4G). By 48 weeks, collagen deposits expanded to the entire core, with SMCs and cholesterol clefts observed at 48 weeks and at later time points. In contrast, in 24-week L–/–/A–/–/FG–/– mice, a patchy monolayer of positive cells was detected at the endothelium (Figure 4F). Collagen deposits were already positive in the core of the plaque and associated with SMCs at 24 weeks in L–/–/A–/–/FG–/– mice, and these deposits expanded to the entire core with SMC and cholesterol clefts at 36 weeks. The collagen deposits were replaced by abundant cholesterol clefts at 48 weeks in L–/–/A–/–/FG–/– mice, and at 48 weeks there was scant positive SMC staining at the endothelium (Figure 4H). In addition, calcifications and hyalinization, the latter of which is mainly generated by the degradation of collagen in the advanced plaques, were observed at 48 weeks in L–/–/A–/–/FG–/– mice, but were more typical at later time points in L–/–/A–/– mice. This was observed in 60- and 72-week L–/–/A–/– mice (data not shown).
Histology of the aortic sinuses from mice at various ages. Sections were cut from 24-week (A,C,E) and 48-week (G,I,K) L–/–/A–/–, and from 24-week (B,D,F) and 48-week (H,J,L) L–/–/A–/–/FG–/– mice. H&E (A,B) and Masson's trichrome stains (C,D), and anti-SMC (E,F,G,H), antifibrin(ogen) (I,J), and antimacrophage immunostains (K,L). Original magnification, × 200. (A) A well-formed fibrous cap (red arrowhead) encapsulating a foam cell-laden core (green arrowhead). (B) An intermediate size lesion with a thinning cap (red arrowheads). Focal acellular patches (green arrowhead), cellular debris, extracellular lipids, foam-like cells, and cholesterol clefts (blue arrowhead) within the core. (C) The collagen-rich fibrous cap (red arrowheads) encapsulates a collagen-negative foam cell core (green arrowheads). (D) Collagen is associated within the subcapsular region (red arrowheads). (E) A cellular multilayered region of SMCs associated with the fibrous cap (red arrowheads), as well as the normally positive medial compartment (green arrowheads). (F) Numerous single-layered positive SMCs (red arrowheads) at the endothelium. (G) Positive (dark red) SMC cells in the subluminal region, which are intensely positive (red arrowheads) and diffusely scattered among negative bordering cells. A few positive SMCs within the core (green arrowheads). (H) A thin, faint SMC layer (red arrowheads) in the subluminal region diffusely scattered among negative bordering foci. (I) Fibrin deposits (red staining) in the underlying subcapsular region. Patchy areas of fibrin are associated with the endothelium (red arrowheads). Diffuse areas of fibrin deposition in the lipid core (green arrowheads). (J) Negative anti-Fg immunostaining. (K) Macrophages (brown stain) in the thinned cap, in the subendothelium (red arrowheads), and within the lipid core (green arrowheads). (L) Several macrophages (brown stain) diffusely scattered within the core and at the base (red arrowheads).
Histology of the aortic sinuses from mice at various ages. Sections were cut from 24-week (A,C,E) and 48-week (G,I,K) L–/–/A–/–, and from 24-week (B,D,F) and 48-week (H,J,L) L–/–/A–/–/FG–/– mice. H&E (A,B) and Masson's trichrome stains (C,D), and anti-SMC (E,F,G,H), antifibrin(ogen) (I,J), and antimacrophage immunostains (K,L). Original magnification, × 200. (A) A well-formed fibrous cap (red arrowhead) encapsulating a foam cell-laden core (green arrowhead). (B) An intermediate size lesion with a thinning cap (red arrowheads). Focal acellular patches (green arrowhead), cellular debris, extracellular lipids, foam-like cells, and cholesterol clefts (blue arrowhead) within the core. (C) The collagen-rich fibrous cap (red arrowheads) encapsulates a collagen-negative foam cell core (green arrowheads). (D) Collagen is associated within the subcapsular region (red arrowheads). (E) A cellular multilayered region of SMCs associated with the fibrous cap (red arrowheads), as well as the normally positive medial compartment (green arrowheads). (F) Numerous single-layered positive SMCs (red arrowheads) at the endothelium. (G) Positive (dark red) SMC cells in the subluminal region, which are intensely positive (red arrowheads) and diffusely scattered among negative bordering cells. A few positive SMCs within the core (green arrowheads). (H) A thin, faint SMC layer (red arrowheads) in the subluminal region diffusely scattered among negative bordering foci. (I) Fibrin deposits (red staining) in the underlying subcapsular region. Patchy areas of fibrin are associated with the endothelium (red arrowheads). Diffuse areas of fibrin deposition in the lipid core (green arrowheads). (J) Negative anti-Fg immunostaining. (K) Macrophages (brown stain) in the thinned cap, in the subendothelium (red arrowheads), and within the lipid core (green arrowheads). (L) Several macrophages (brown stain) diffusely scattered within the core and at the base (red arrowheads).
Antifibrin(ogen) immunostains indicated that fibrin(ogen) deposition was abundantly present in the plaques of L–/–/A–/– mice (Figure 4I) but, as expected, totally absent in L–/–/A–/–/FG–/– mice (Figure 4J). Antimacrophage immunostains exhibited foam cells in the core of both L–/–/A–/– and L–/–/A–/–/FG–/– mice (Figure 4K,L).
Coagulation parameters
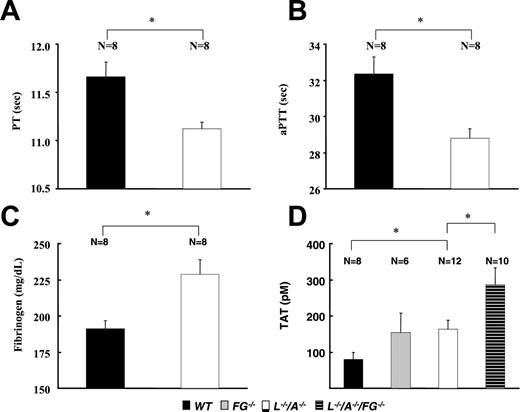
The PT and aPTT were significantly shorter in L–/–/A–/– mice than in WT mice (Figure 5A,B). This change might be due to the comparative up-regulation of plasma fibrinogen levels in L–/–/A–/– mice (Figure 5C). TAT levels were significantly higher in L–/–/A–/– mice than in WT mice (Figure 5D), neither of which were significantly different from those of FG–/– mice. Furthermore, TAT levels were significantly higher in L–/–/A–/–/FG–/– mice than in L–/–/A–/– mice.
Flow cytometric analysis of CD61 (integrin β3) and CD62P (P-Sel) exposure on platelets
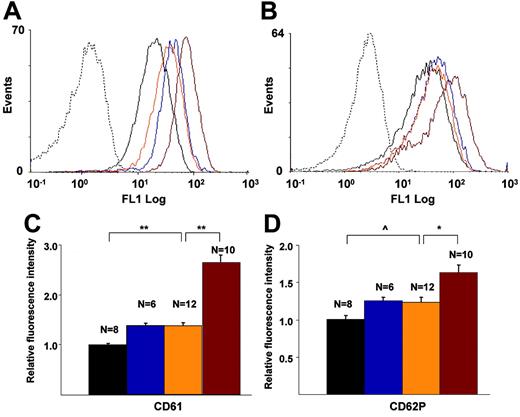
There were no significant differences in the number of circulating platelets among the genotypes (data not shown), with ranges between 218 K/μL and 354 K/μL in WT, FG–/–, L–/–/A–/–, and L–/–/A–/–/FG–/– mice at 24, 36, and 48 weeks, and no trends within the genotypes. The fluorescence intensities of CD61 (Figure 6A,C) and CD62P (Figure 6B,D) on platelets in L–/–/A–/– mice were significantly higher than those in WT mice, and these same intensities of CD61 and CD62P in L–/–/A–/–/FG–/– mice were significantly higher than those in L–/–/A–/– mice (Figure 6A-D).
Coagulation parameters in WT, FG–/–, L–/–, and L–/–/A–/–/FG–/– mice. (A) PT, (B) aPTT, (C) plasma levels of fibrinogen, and (D) plasma levels of TAT. N = the number of mice used at each time point. ▪ indicates WT; ▦, FG–/–; □, L–/–/A–/–; and ▤, L–/–/A–/–/FG–/–. *P < .01.
Coagulation parameters in WT, FG–/–, L–/–, and L–/–/A–/–/FG–/– mice. (A) PT, (B) aPTT, (C) plasma levels of fibrinogen, and (D) plasma levels of TAT. N = the number of mice used at each time point. ▪ indicates WT; ▦, FG–/–; □, L–/–/A–/–; and ▤, L–/–/A–/–/FG–/–. *P < .01.
Flow cytometric analyses of murine platelets. CD61 and CD62P on platelets of WT (black), FG–/– (blue), L–/–/A–/– (orange), and L–/–/A–/–/FG– (red) mice. Dotted lines indicate isotype-specific negative controls. (A) Histogram for CD61, (B) histogram for CD62, (C) fluorescence intensity of CD61, and (D) fluorescent intensity of CD62. N = the number of mice used at each time point. *P < .05; **P < .001; ^P < .01.
Flow cytometric analyses of murine platelets. CD61 and CD62P on platelets of WT (black), FG–/– (blue), L–/–/A–/– (orange), and L–/–/A–/–/FG– (red) mice. Dotted lines indicate isotype-specific negative controls. (A) Histogram for CD61, (B) histogram for CD62, (C) fluorescence intensity of CD61, and (D) fluorescent intensity of CD62. N = the number of mice used at each time point. *P < .05; **P < .001; ^P < .01.
ELISA of sP-Sel, VWF-Ag VWF-CBA, and ADAMTS13 in plasma
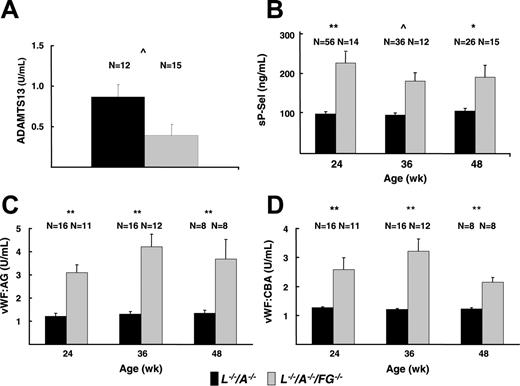
The plasma levels of sP-Sel in L–/–/A–/–/FG–/– mice were significantly higher than those in L–/–/A–/– mice at all time points (Figure 7B). Plasma levels of VWF-Ag were significantly more elevated in L–/–/A–/–/FG–/– mice than those in L–/–/A–/– mice at 24, 36, and 48 weeks (Figure 7C). In addition, the plasma levels of VWF-Ag in FG–/– mice were 1.59 U/mL and were significantly higher than those in WT mice (0.97 U/mL) at 24 weeks. Furthermore, plasma levels of VWF-CBA were significantly elevated in L–/–/A–/–/FG–/– mice relative to L–/–/A–/– mice (Figure 7D). Similar to the VWF-Ag results, the plasma levels of VWF-CBA in FG–/– mice (2.49 U/mL) also were significantly higher than those in WT mice (1.00 U/mL) at 24 weeks. These changes were supported by the results of ADAMTS13 assays, the values of which were significantly lower in L–/–/A–/–/FG–/– mice as compared to L–/–/A–/– mice (Figure 7A).
Plasma assays of platelet activation markers. (A) ADAMTS13 in L–/–/A–/– and L–/–/A–/–/FG–/– mice. (B) sP-Sel in L–/–/A–/– and L–/–/A–/–/FG–/– mice. (C) VWF-Ag in L–/–/A–/– and L–/–/A–/–/FG–/– mice. (D) VWF-CBA in L–/–/A–/– and L–/–/A–/–/FG–/– mice. N = the number of mice used at each time point. *P < .05; **P < .001; ^P < .01.
Plasma assays of platelet activation markers. (A) ADAMTS13 in L–/–/A–/– and L–/–/A–/–/FG–/– mice. (B) sP-Sel in L–/–/A–/– and L–/–/A–/–/FG–/– mice. (C) VWF-Ag in L–/–/A–/– and L–/–/A–/–/FG–/– mice. (D) VWF-CBA in L–/–/A–/– and L–/–/A–/–/FG–/– mice. N = the number of mice used at each time point. *P < .05; **P < .001; ^P < .01.
Discussion
Numerous studies indicate a relationship between hyperfibrinogenemia and cardiovascular disease.29-33 Additionally, the presence of fibrin(ogen) and/or its degradation products in atherosclerotic plaques implies their important roles in the progression of the disease.16,17 In the present study, we examined the effects of an additional Fg deficiency in mice genetically prone to LDL-C–dependent atherosclerosis.
L–/–/A–/–/FG–/– mice had more advanced plaque than L–/–/A–/– mice. The surface area of plaque in the aorta and the size of the plaque in the aortic sinus were more extensive in L–/–/A–/–/FG–/– mice than that in L–/–/A–/– mice. There was good correlation between the surface area of plaque in the aorta and the size of the plaque in the aortic sinus in L–/–/A–/– mice (R2 = 0.8286), as well as in L–/–/A–/–/FG–/– mice (R2 = 0.8135). L–/–/A–/–/FG–/– mice displayed more extended and enlarged plaques at all time points in this study, but there was no significant difference in the plaque growth rate between L–/–/A–/– and L–/–/A–/–/FG–/– mice. Although there was an abundance of Fg, fibrin, and its degradation products in the plaques of L–/–/A–/– mice, their roles as chemoattractants and provision of an extracellular matrix for the development of plaque might not be critical in this model.
The decreased PT and aPTT of L–/–/A–/– mice relative to WT mice demonstrates a positive correlation of a hypercoagulable state and the incidence of atherosclerosis. Additionally, thrombin activity, a late product of activation of the coagulation cascade, was increased in FG–/– and L–/–/A–/– mice and was even more enhanced in L–/–/A–/–/FG–/– mice. The inverse relationship between fibrinogen and thrombin levels in mice was noted previously34 and correlates with studies showing that plasma from afibrinogenemic humans and reptilase-defibrinated normal plasma possessed enhanced thrombin activity levels.35 The mechanisms involved in the up-regulated thrombin activity in mice and humans under conditions of low plasma Fg have some important differences. In humans, Fg-γ′ chain sequences, which are absent in mice, are associated with a fibrin-dependent antithrombin (antithrombin-1) activity,36,37 an inhibitor that is thus absent during normal thrombin homeostasis in mice. Regardless of these species-related mechanistic differences, thrombin levels in mice and humans are elevated in afibrinogenemia, and thrombin, via protease-activated receptor signaling,38,39 is one of the strongest platelet activators in both humans and mice. Thus, mechanisms that lead to enhanced thrombin activity can induce platelet activation, which is specifically amplified in L–/–/A–/–/FG–/– mice, due to other modifiers, and leads to enhanced atherosclerosis. These findings have important epidemiologic consequences for humans in that not only fibrinogen levels, but also genetic variations in the Fg-γ′ chain, and consequent effects on anti–thrombin-1 activity, cannot only increase the risk of deep vein thrombosis,40 but also may influence atherogenesis, as demonstrated herein.
Other studies have shown that LDL also can activate circulating platelets.41-43 The activation process could potentially be mediated by VWF, since LDL has been shown to release VWF from EC.44,45 Indeed, FG–/– and L–/–/A–/–/FG–/– mice had higher levels of CD61 (a receptor component for Fg and VWF) expression on their platelets, plus increased VWF-Ag and VWF-CBA in their plasmas, relative to WT and L–/–/A–/– mice. While the ratios of VWF-Ag and VWF-CBA were equivalent between L–/–/A–/– and L–/–/A–/–/FG–/– mice, the overall plasma concentration of VWF-CBA was greater in L–/–/A–/–/FG–/– mice, and this has been shown to be associated with functional larger forms of VWF.46 Additionally, studies in LDLR–/–/VWF–/– mice demonstrated a reduction in atherosclerotic lesion development in regions of the aorta exposed to turbulent flow. This implies a role for VWF in early plaque development.47 It was further reported that afibrinogenemic patients had higher amounts of plasma VWF-Ag,48,49 and patients with high levels of LDL had elevated plasma levels of VWF-Ag.50 Therefore, increased coagulant activity, specifically, thrombin activity due to lack of Fg, along with elevated LDL, likely act in synergy during the early stages of lesion development through activation of platelets and other proinflammatory functions regulated by thrombin. However, the current study does not directly identify the extent of their individual contributions to this process.
Lipopolysaccharide (LPS) induces systemic inflammatory effects and EC injury. The plasma levels of VWF-Ag and its multimeric forms have been reported to be elevated during LPS challenge.51 Correspondingly, the metalloprotease ADAMTS13, responsible for cleaving multimeric VWF to low molecular weight forms, was diminished.51 Intuitively, then, a deficiency of ADAMTS13 could cause accumulation of higher molecular weight forms of VWF and thereby lead to increased platelet activation and aggregation. This direct linkage between ADAMTS levels and the presence of large multimeric forms of VWF is somewhat unclear in mice, since it has been shown that the extent of the presence of multimers of VWF in ADAMTS13–/– mice and expression of resultant phenotypes, such as thrombotic tendencies and disposition to thrombocytopenic purpura (TPP), are highly dependent on the mouse strain in which the ADAMTS13 deficiency exists.52,53 These strain differences perhaps relate to the variances observed in the ADAMTS13 gene and in the expressed protein in various mouse strains.54 Therefore, phenotypes, such as VWF multimer distribution in plasma, survival, and incidence of TTP in ADAMTS13–/– mice, will vary with the genetic strain of mice, and this deficiency is well managed in some murine genetic backgrounds. This suggests that gene modifiers of ADAMTS13 may exist.53 In our case, the high levels of circulating LDL, along with a total Fg deficiency and the C57/BL6J background of our mice, may play some role in the observed increase in elevated VWF-Ag, down-regulation of ADAMTS13 activity, the presence of functional VWF-CBA activity, and consequent platelet activation.
Circulating activated platelets have been shown to exacerbate atherosclerosis in APOE–/– mice by interacting with monocytes and EC via CD62P. This interaction was not observed in resting or P-Sel–deficient platelets.55 Indeed, CD62P exposure on the platelets in L–/–/A–/–/FG–/– mice was higher than that in L–/–/A–/– mice. Additionally, elevated CD62P in patients with chronic cerebral infarction has been reported to be a marker of platelet aggregation of small aggregates.56 Clinically, high plasma sP-Sel levels were observed in type IIa hypercholesterolemic patients.50,57,58 Furthermore, anti–P-Sel and anti–P-Sel glycoprotein ligand-1 (PSGL-1) antibodies reduced neointima formation and neointimal macrophage infiltrations in APOE–/– mice,59 and an additional P-Sel deficiency in APOE–/– mice reduced the development of atherosclerotic lesions.60 Thus, activated platelets in L–/–/A–/–/FG–/– mice may enhance the initiation of plaque formation.
Other more direct effects of Fg on inflammation/atherosclerosis are possible. As a pertinent example, it has recently been reported that the fibrin-derived peptide, Bβ15-42, displayed anti-inflammatory effects via binding to vascular endothelial cadherin and preventing the transmigration of leukocytes across endothelial monolayers.61 This implies that Fg might attenuate the initiation of plaque by preventing leukocyte transmigration. In concert with that report, we suggest that L–/–/A–/–/FG–/– mice are not able to protect against leukocyte transmigration and present exacerbated plaque initiation independent of platelet activation. This adds to the complexity of mechanisms that are involved in the accelerated plaque development resulting from an Fg deficiency in LDL-C–driven atherosclerosis.
In conclusion, we offer herein an extended evaluation of a relevant genetic model of LDL-C–driven atherosclerosis in mice and show that complex gene product interactions function in plaque development. It appears as though high LDL-C and low Fg levels lead to thrombin generation and platelet activation, along with possible enhanced leukocyte migration through the endothelium, which then stimulates aortic plaque formation. Thus, hemostasis-related genes are included among those that play important roles in development of atherosclerosis, and these genes also should be considered as part of the complex set of parameters that result in arterial remodeling in this disease.
Prepublished online as Blood First Edition Paper, January 24, 2006; DOI 10.1182/blood-2005-09-3780.
Supported by grants HL013423 and HL073750 from the National Institutes of Health; the Kleiderer-Pezold endowed professorship (F.J.C.); and the Leda Sears Trust.
The publication costs of this article were defrayed in part by page charge payment. Therefore, and solely to indicate this fact, this article is hereby marked “advertisement” in accordance with 18 U.S.C. section 1734.
We thank Ms Deborah Donahue for maintenance of the mouse colonies, Dr Carmen J. Narvaez for assisting with the FCM analysis, Ms Diana T. Cruz for performing the TAT assays, and Dr Lyn Powell-Braxton for providing initial lines of mice containing the APOBEC1 gene deletion.

This feature is available to Subscribers Only
Sign In or Create an Account Close Modal