Abstract
The NKG2D receptor is a stimulatory receptor expressed on NK cells and activated CD8 T cells. We previously demonstrated that engaging the NKG2D receptor markedly improved the efficacy of a survivin-based DNA vaccine. The combination vaccine, encoding both the NKG2D ligand H60 and survivin, activates innate and adaptive antitumor immunity and results in better protection against tumors of different origin and NKG2D expression levels. Here we demonstrate that the enhanced vaccine efficacy is in part attributable to increased cross talk between lymphocytes. Depletion of CD8 T cells during priming reduces the vaccine-induced activation of dendritic cells (DCs) and NK cell activity. Depletion of NK cells during priming leads to reduced DC activation and CTL activity. However, depletion of CD4 T cells results in the activation of DCs, NK cells, and CD8 T cells and enhances NK cell activity. The pH60/Survivin vaccine also increases DCs and NK cells but decreases CD4 T cell homing to Peyer patches, presumably as a result of changes in the homing receptor profile. Thus, by preferentially activating and attracting positive regulators and reducing negative regulators in Peyer patches, this dual-function DNA vaccine induces a microenvironment more suitable for NK cell activation and T cell priming.
Introduction
T cells that target tumor-associated antigens (TAAs) are readily detectable in patients with cancer, including those who received cancer vaccines. However, in most cases, such T cells fail to eradicate tumors in these patients. Thus, it is apparent that established tumors can induce immune tolerance through yet poorly defined mechanisms.1 We hypothesized that immunization strategies that use different arms of the immune system may overcome this immune tolerance. The NKG2D receptor-ligand interaction is a good candidate to test this hypothesis because it occurs at the crossroad between innate and adaptive immunity.2 NKG2D, a stimulatory lectinlike receptor, is expressed on natural killer (NK) cells, activated CD8+ T cells, γδ T cells, and activated macrophages.3 It mediates costimulatory signals for CD8+ T cells and stimulatory signals for NK cells and macrophages.4,5 NKG2D ligands are related to major histocompatibility complex (MHC) class I molecules. In mice, such ligands include products of the retinoic acid early inducible-1 (Rae1) gene, H60,3,6 and the UL16 binding protein-like transcript 1 (MULT1).7 Importantly, in syngeneic mice, ectopic expression of NKG2D ligands causes NK cell-mediated rejection of transfected tumor cells.8,9 It also primes cytotoxic T cells (CTLs), which are responsible for rejecting subsequent challenges with tumor cells lacking NKG2D ligand expression.8 In our earlier study,10 we demonstrated that engagement of the murine NKG2D receptor (by using a DNA vaccine encoding one of its ligands, H60) enhanced innate and adaptive immune responses induced by a survivin-based DNA vaccine. This, in turn, augmented the vaccine's antitumor efficacy in prophylactic and therapeutic settings against tumors of different origin and NKG2D expression levels.10
Survivin, a 16.5-kDa inhibitor of apoptosis protein, represents an almost ideal target for cancer vaccines because it is overexpressed by essentially all solid tumor cells and by proliferating endothelial cells in the tumor microenvironment. In contrast, survivin is poorly, or only transiently, expressed by normal adult tissues.11 Furthermore, overexpression of survivin in tumors is linked to decreased patient survival, increased tumor recurrence, and resistance to therapy.11 In addition, spontaneous immune responses against survivin were recently demonstrated in a variety of patients with cancer.12 Survivin-based DNA vaccines were also shown to induce T cell-mediated antitumor responses without severe toxicities in preclinical13 and clinical trials.14
Here, we demonstrate that the enhanced vaccine efficacy of NKG2D ligand H60 plus survivin is in part caused by increased lymphocyte cross talk, thus proving that activation of the innate and adaptive arms of the immune system provides an attractive strategy to overcome tumor-induced peripheral immune tolerance.
Materials and methods
Animals and cell lines
Female BALB/c mice, 6 to 8 weeks of age, were purchased from the Jackson Laboratory (Bar Harbor, ME). All animal experiments were performed in accordance with the National Institutes of Health Guide for the Care and Use of Laboratory Animals.
The murine colon carcinoma cell line CT-26 was kindly provided by Dr I. J. Fidler (MD Anderson Cancer Center, Houston, TX). Yac-1 cells were purchased from the American Type Culture Collection (ATCC, Rockville, MD). A plasmid containing the full-length murine NKG2D ligand-H60 was a generous gift from Drs A. Diefenbach and D. H. Raulet (University of California, Berkeley, CA).
Oral immunization
The double-attenuated Salmonella typhimurium (AroA-; dam-) strain RE88 was kindly provided by Remedyne Corporation (Santa Barbara, CA). Expression vectors were constructed based on a pBudCE4.1 backbone (Invitrogen, Carlsbad, CA) and transformed into Salmonella typhimurium as previously described.10 Mice were immunized twice at a 2-week interval by gavage with 100 μL 5% sodium bicarbonate containing approximately 5 × 10⁸ doubly mutated S typhimurium harboring the expression vectors.
In vivo depletions
CD8 or CD4 depletions were performed by intraperitoneal injection of anti-CD8 antibody 2.43 or anti-CD4 antibody GK1.5 (both obtained from the National Cell Culture Center, Brooklyn Center, MN) at 0.5 mg/mouse, starting 1 day before the first vaccination (priming phase) or 3 days after the last vaccination (effector phase) and repeated weekly. NK cell depletions were achieved by intraperitoneal injection of anti-asialo GM1 antibody (Wako Chemicals USA, Richmond, VA) at 20 μL per mouse, starting 1 day before or 3 days after vaccination and repeated every 5 days.
Cytotoxicity and flow cytometry
Cytotoxicity was measured by a standard chromium 51 (51Cr)-release assay as previously described.15 Flow cytometry was performed on lymphocytes isolated from Peyer patches or other lymphoid tissues 1 day after vaccination with a BD LSRII cell sorter (Becton Dickinson, San Jose, CA) equipped with DIVA software. Data were analyzed with FlowJo software (Tree Star, Stanford, CA). All antibodies were obtained from BD PharMingen (San Diego, CA), except for antibodies against NKG2D and GITR, which were purchased from eBioscience (San Diego, CA).
Inhibition of CD3-induced splenocyte proliferation by CD4+CD25+ cells
CD3+CD4+CD25+ cells were purified by flow cytometric cell sorting from splenocytes isolated from control or pH60/Surv-vaccinated mice 2 weeks after the last vaccination. Splenocytes from healthy mice were labeled with 5 μM CFSE and incubated for 3 days with 10 μg/mL anti-CD3 antibody in the absence or presence of purified CD3+CD4+CD25+ cells at a 100:1 ratio. These cells were then harvested and analyzed for CFSE intensity by flow cytometry.
Statistical analysis
The statistical significance of differential findings between experimental groups and controls was determined by Student t test. Findings were regarded as significant if the 2-tailed P value was less than .05.
Results
H60-Survivin vaccine (pH60/Surv) induces activation of DCs, NK cells, and T cells in Peyer patches
We demonstrated previously that a DNA vaccine encoding murine NKG2D ligand-H60 and a TAA survivin protected mice from lethal tumor cell challenges in prophylactic and therapeutic settings. These antitumor effects were the results of enhanced NK and CTL activities.10
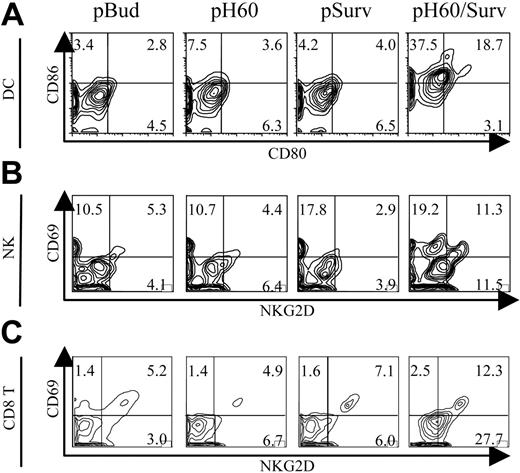
To further elucidate the mechanisms involved in this tumor protection, we focused on Peyer patches because these secondary lymphoid organs were shown to be the site of antigen expression10 and priming for DNA vaccines carried by attenuated S typhimurium.16,17 Vaccine-induced cell activations were analyzed by 6-color flow cytometry. The most striking observation was the activation state of DCs, NK cells, and CD8 T cells in Peyer patches after pH60/Surv vaccination. Activation was demonstrated by the up-regulation of CD80 and CD86 on DCs (Figure 1A) and by CD69 and NKG2D receptor on NK cells (Figure 1B) and CD8 T cells (Figure 1C). CD4 T cells also revealed a slight up-regulation of CD69 (data not shown). Cell activation induced by DNA vaccines encoding only H60 or survivin was either not detectable or minimal compared with the pBud control group (Figure 1A-C). These data suggest that the dual-function vaccine induces synergistic responses inside Peyer patches.
Cell activation was also investigated by analysis of lymphocytes isolated from spleens and peripheral blood and from inguinal, axillary, and brachial lymph nodes. These cells, isolated from pH60/Surv-vaccinated mice, revealed a profile similar to that of the control group or showed a slight up-regulation of activation markers (data not shown). These findings and our previous data demonstrating vaccine-induced antigen and H60 expression inside Peyer patches10 suggest that the microenvironment inside Peyer patches is indeed the location for the specific immune stimulation initiated by the pH60/Surv vaccine.
Activation of DCs, NK cells, and T cells in Peyer patches after vaccination. Mice were killed 1 day after vaccination. Lymphocytes isolated from Peyer patches were analyzed by flow cytometry. (A) Contour plots of CD80 and CD86 expression on DCs (CD11c+I-A/I-E+). (B) Contour plots of CD69 and NKG2D expression by NK cells (CD3-DX5+). (C) Contour plots of CD69 and NKG2D expression by CD8+ T cells (CD3+CD8+). Vectors used for vaccination are shown at the top of panel A. Experiments were repeated 3 times with similar results.
Activation of DCs, NK cells, and T cells in Peyer patches after vaccination. Mice were killed 1 day after vaccination. Lymphocytes isolated from Peyer patches were analyzed by flow cytometry. (A) Contour plots of CD80 and CD86 expression on DCs (CD11c+I-A/I-E+). (B) Contour plots of CD69 and NKG2D expression by NK cells (CD3-DX5+). (C) Contour plots of CD69 and NKG2D expression by CD8+ T cells (CD3+CD8+). Vectors used for vaccination are shown at the top of panel A. Experiments were repeated 3 times with similar results.
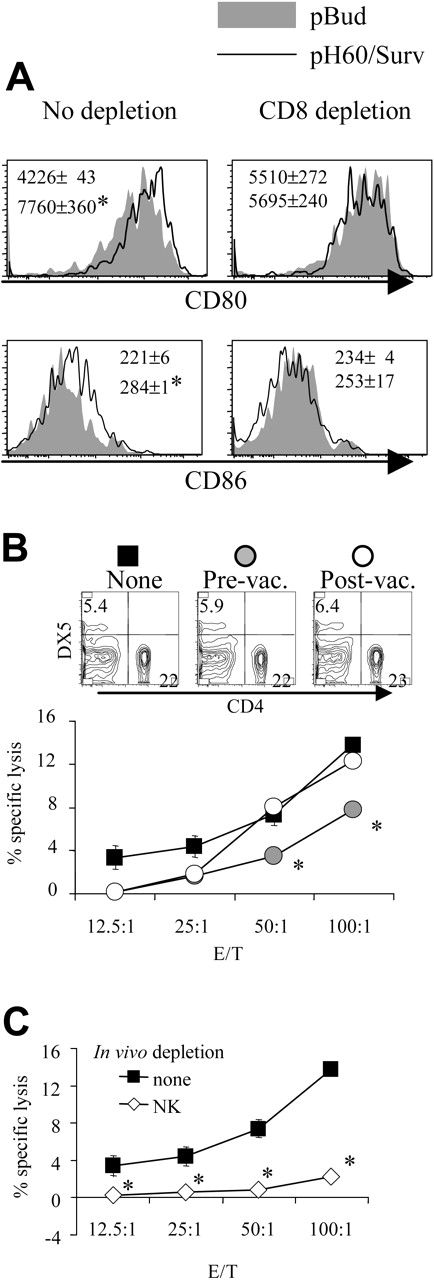
Depletion of CD8 T cells during priming results in reduced DC activation and NK cell activity. (A) Lymphocytes were isolated from Peyer patches as described in Figure 1 and were analyzed on the CD11c+I-A/I-E+ population. Shaded areas indicate pBud control mice. Their average mean fluorescence intensity (MFI) and SD are shown as the gray numbers, and pH60/Surv-vaccinated mice are represented by the black line and black number. (Left) No CD8 depletion. (Right) CD8 depletion. Numbers indicate average of MFI and SD of 2 samples within the group in the same experiment. All overlay histograms are presented as percentage of maximum on the y-axis. *P < .01 compared with the pBud control group. (B) Mice vaccinated with pH60/Surv were either undepleted (none, ▪) or depleted of CD8 T cells starting 1 day before the first vaccination (prevaccination,  ) or 3 days after the second vaccination (postvaccination, ○). Mice were killed 2 weeks after the second vaccination. Freshly isolated splenocytes were used in a standard 51Cr-release assay against Yac-1 NK target cells. *P < .01 compared with nondepletion or postvaccination depletion groups. (Top panels) DX5 and CD4 distribution among splenocytes from undepleted or CD8-depleted mice. (C) Splenocytes freshly isolated from vaccinated mice were either undepleted (▪) or depleted of NK cells (⋄) and used in a standard 51Cr-release assay against Yac-1 cells. *P < .01 compared with the nondepletion group. All experiments were repeated at least once and yielded similar results.
Depletion of CD8 T cells during priming results in reduced DC activation and NK cell activity. (A) Lymphocytes were isolated from Peyer patches as described in Figure 1 and were analyzed on the CD11c+I-A/I-E+ population. Shaded areas indicate pBud control mice. Their average mean fluorescence intensity (MFI) and SD are shown as the gray numbers, and pH60/Surv-vaccinated mice are represented by the black line and black number. (Left) No CD8 depletion. (Right) CD8 depletion. Numbers indicate average of MFI and SD of 2 samples within the group in the same experiment. All overlay histograms are presented as percentage of maximum on the y-axis. *P < .01 compared with the pBud control group. (B) Mice vaccinated with pH60/Surv were either undepleted (none, ▪) or depleted of CD8 T cells starting 1 day before the first vaccination (prevaccination,  ) or 3 days after the second vaccination (postvaccination, ○). Mice were killed 2 weeks after the second vaccination. Freshly isolated splenocytes were used in a standard 51Cr-release assay against Yac-1 NK target cells. *P < .01 compared with nondepletion or postvaccination depletion groups. (Top panels) DX5 and CD4 distribution among splenocytes from undepleted or CD8-depleted mice. (C) Splenocytes freshly isolated from vaccinated mice were either undepleted (▪) or depleted of NK cells (⋄) and used in a standard 51Cr-release assay against Yac-1 cells. *P < .01 compared with the nondepletion group. All experiments were repeated at least once and yielded similar results.
CD8 T and NK cells are positive contributors whereas CD4 T cells mainly mediate negative regulation in pH60/Surv-induced immune responses
In vivo cell depletion experiments were performed to test the role played by each cell population in synergistic responses. Depletion of CD8 cells reduced the pH60/Surv-induced activation of DCs (Figure 2A). More important, the depletion of CD8 T cells before vaccination (priming phase) but not after vaccination (effector phase) resulted in reduced killing of Yac-1 NK target cells at effector-target ratios of 50:1 and 100:1 (Figure 2B). The cytotoxicity against Yac-1 cells is largely dependent on NK cells because their depletion in vivo resulted in greater than 80% reduction of this activity (Figure 2C). The CD8 depletion-induced reduction in NK activity was not the result of a decrease in NK cell percentages because CD8 depletion did not significantly affect the percentage of NK cells in the spleen (Figure 2B, upper panel). Taken together, these data suggest that CD8 T cells are positive contributors to lymphocyte cross talk and enhance vaccine-induced DC activation and NK activity.
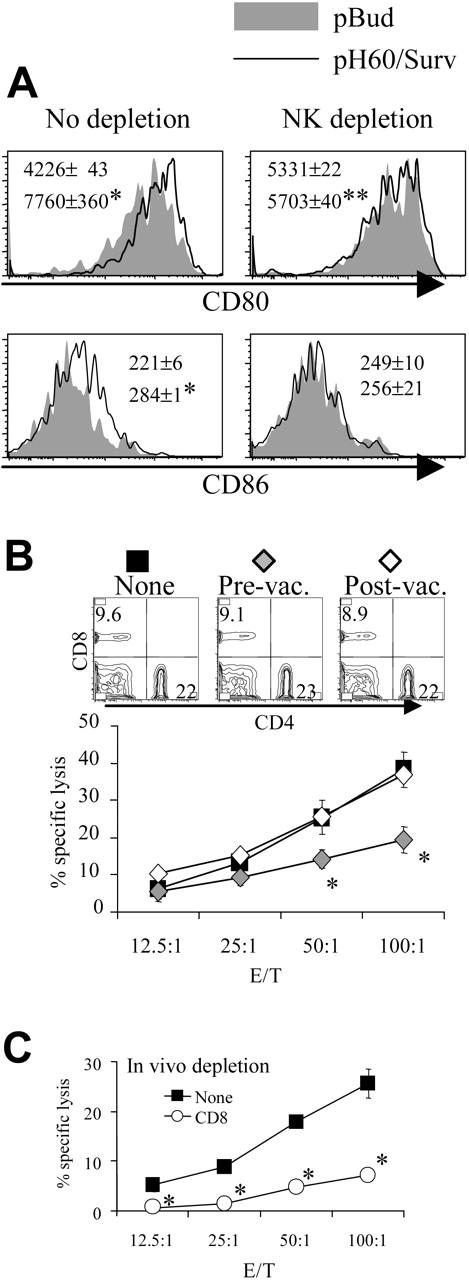
Similarly, the depletion of NK cells reduced pH60/Surv-induced DC activation (Figure 3A). NK cell depletion during the priming phase, but not the effector phase, resulted in decreased cytotoxicity against CT-26 colon carcinoma cells (Figure 3B). This killing was previously shown to be mediated by CD8 T cells,10 and in vivo depletion of these cells resulted in greater than 70% reduction of such activity (Figure 3C). Because NK depletion in the priming or the effector phase induced similar changes in CD8 distribution in the spleen (Figure 3B, upper panel), these data indicate the positive role of NK cells in the cross talk between lymphocytes induced by the pH60/Surv vaccine.
Depletion of NK cells during priming results in reduced DC activation and CTL activity. Mice were treated as described in Figure 2, except that NK cell depletion was performed as described in “Materials and methods.” (A) Histograms of CD80 and CD86 distribution of CD11c+ I-A/I-E + cells isolated from Peyer patches with (right panels) or without (left panels) NK cell depletion. *P < .01 compared with the pBud control group; **P < .05 compared with the pBud control group depleted of NK cells. (B) Mice vaccinated with pH60/Surv were not depleted (▪) or were depleted of NK cells before vaccination (♦) or after vaccination (⋄). Splenocytes were stimulated in vitro with irradiated CT-26 colon carcinoma cells for 5 days and were used in a standard 51Cr-release assay against these tumor cells. *P < .05 compared with nondepletion or postvaccination depletion groups. (Top panels) Distribution of CD4 and CD8 T cells obtained from undepleted or NK-cell depleted mice. (C) In vitro-stimulated splenocytes isolated from vaccinated mice either not depleted (▪)or depleted (○) of CD8 cells and used in a 51Cr release assay against CT-26 target cells. *P < .01 compared with the nondepletion group. All experiments were repeated at least once and yielded similar results.
Depletion of NK cells during priming results in reduced DC activation and CTL activity. Mice were treated as described in Figure 2, except that NK cell depletion was performed as described in “Materials and methods.” (A) Histograms of CD80 and CD86 distribution of CD11c+ I-A/I-E + cells isolated from Peyer patches with (right panels) or without (left panels) NK cell depletion. *P < .01 compared with the pBud control group; **P < .05 compared with the pBud control group depleted of NK cells. (B) Mice vaccinated with pH60/Surv were not depleted (▪) or were depleted of NK cells before vaccination (♦) or after vaccination (⋄). Splenocytes were stimulated in vitro with irradiated CT-26 colon carcinoma cells for 5 days and were used in a standard 51Cr-release assay against these tumor cells. *P < .05 compared with nondepletion or postvaccination depletion groups. (Top panels) Distribution of CD4 and CD8 T cells obtained from undepleted or NK-cell depleted mice. (C) In vitro-stimulated splenocytes isolated from vaccinated mice either not depleted (▪)or depleted (○) of CD8 cells and used in a 51Cr release assay against CT-26 target cells. *P < .01 compared with the nondepletion group. All experiments were repeated at least once and yielded similar results.
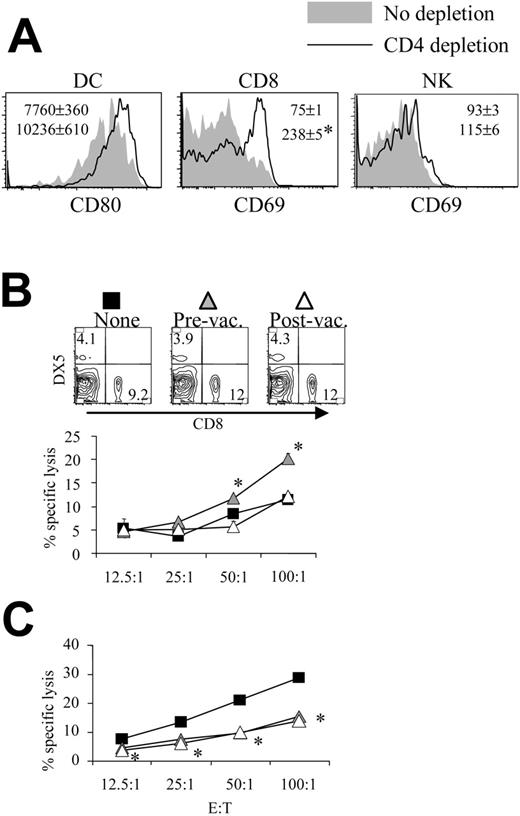
Mice depleted of CD4 cells before pH60/Surv vaccination displayed activation of DCs, CD8 T cells, and NK cells inside Peyer patches (Figure 4A). Similar changes were also observed for cells isolated from CD4-depleted pBud control mice (data not shown). These findings are in agreement with our earlier notion that CD4 T cells function as negative regulators during immune surveillance and immune responses induced by pH60/Surv.10 The depletion of CD4 T cells during the priming phase led to enhanced killing of NK target cells, whereas the depletion of CD4 T cells during the effector phase did not contribute significantly (Figure 4B). Given that the depletion of CD4 T cells leads to similar changes in lymphocyte distribution in the spleen (Figure 4B, upper panel), these data suggest a negative regulatory role for CD4 T cells in vaccine-induced immune responses. Surprisingly, the in vivo depletion of CD4 T cells during priming and effector phases resulted in a similar reduction in CT-26 tumor cell killing (Figure 4C).
pH60/Surv vaccine induces differences in lymphocyte homing to Peyer patches
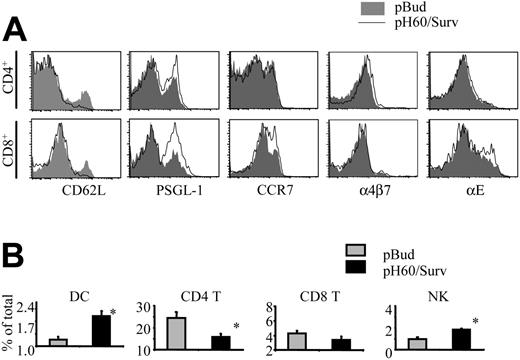
Activation of lymphocytes also leads to changes in their homing receptors.18-21 The extensive lymphocyte activation induced by the pH60/Surv vaccine prompted us to look at the expression of their homing receptors. As anticipated, CD4 and CD8 T cells down-regulated L-selectin (CD62L; Figure 5A). However, these cells revealed different changes in the expression of other adhesion molecules (Figure 5A). CD4 T cells showed a slight up-regulation in the functional P-selectin glycoprotein ligand-1 (PSGL-1) and in α4β7 integrin, whereas CD8 T cells up-regulated functional PSGL-1, CCR7, and αE integrin (CD103) more significantly. NK cells revealed changes similar to those of CD8 T cells (data not shown). These differences in homing receptor expression may translate to changes in the distribution of lymphocyte populations in Peyer patches. In fact, compared with the control group, the pH60/Surv-vaccinated group of mice displayed an increase in the percentages of DCs and NK cells and a decrease in CD4 T cells, with no significant change in the percentage of CD8 T cells (Figure 5B). Taken together, these data suggest that the pH60/Surv vaccine preferentially attracts and activates positive regulators in Peyer patches and initiates an increase in positive cross talk during the priming phase.
Depletion of CD4 T cells enhances lymphocyte activation and NK cell activity. Mice were treated as described in Figure 2, except that CD4 depletion was performed as described in “Materials and methods.” (A) Histograms of the activation markers of lymphocytes isolated from Peyer patches of pH60/Surv-vaccinated mice either with (dark lines) or without (shaded areas) CD4 depletion are shown. (Left) Gated on CD11c+I-A/I-E+ cells. (Middle) Gated on CD3+CD8+ cells. (Right) Gated on CD3-DX5+ cells. *P < .01 compared with the nondepletion group. All increases were confirmed in a separate experiment using another 2 mice in each group. (B-C) Mice vaccinated with pH60/Surv were not depleted (▪) or were depleted of CD4 T cells before vaccination (▴) or after vaccination (▵). (B) Freshly isolated splenocytes were used in a standard 51Cr-release assay against Yac-1 NK target cells. *P < .05 compared with the nondepletion or postvaccination depletion groups. (Top panels) CD8 and DX5 distribution of splenocytes obtained from undepleted or CD4-depleted mice. (C) Splenocytes were stimulated in vitro for 5 days with irradiated CT-26 cells and were used in a standard 51Cr-release assay against these tumor cells. *P < .05 for the prevaccination and postvaccination depletion groups compared with the nondepletion group. All experiments were repeated at least once and yielded similar results.
Depletion of CD4 T cells enhances lymphocyte activation and NK cell activity. Mice were treated as described in Figure 2, except that CD4 depletion was performed as described in “Materials and methods.” (A) Histograms of the activation markers of lymphocytes isolated from Peyer patches of pH60/Surv-vaccinated mice either with (dark lines) or without (shaded areas) CD4 depletion are shown. (Left) Gated on CD11c+I-A/I-E+ cells. (Middle) Gated on CD3+CD8+ cells. (Right) Gated on CD3-DX5+ cells. *P < .01 compared with the nondepletion group. All increases were confirmed in a separate experiment using another 2 mice in each group. (B-C) Mice vaccinated with pH60/Surv were not depleted (▪) or were depleted of CD4 T cells before vaccination (▴) or after vaccination (▵). (B) Freshly isolated splenocytes were used in a standard 51Cr-release assay against Yac-1 NK target cells. *P < .05 compared with the nondepletion or postvaccination depletion groups. (Top panels) CD8 and DX5 distribution of splenocytes obtained from undepleted or CD4-depleted mice. (C) Splenocytes were stimulated in vitro for 5 days with irradiated CT-26 cells and were used in a standard 51Cr-release assay against these tumor cells. *P < .05 for the prevaccination and postvaccination depletion groups compared with the nondepletion group. All experiments were repeated at least once and yielded similar results.
pH60/Surv vaccine induces changes in expression of lymphocyte homing receptors and lymphocyte distribution in Peyer patches. Lymphocytes were isolated from Peyer patches and analyzed by flow cytometry. (A) Histograms depict homing receptor expression of lymphocytes isolated from Peyer patches of pBud control (shaded area) or pH60/Surv-vaccinated (black line) mice. (Top panels) Gated on CD3+CD4+ cells. (Bottom panels) Gated on CD3+CD8+ cells. Experiment was repeated once with similar results. (B) Percentage of different lymphocyte populations in Peyer patches.  indicates pBud control mice; ▪, pH60/Surv-vaccinated mice. *P < .05 compared with the pBud control group of mice. Experiment was repeated 3 times with similar results.
pH60/Surv vaccine induces changes in expression of lymphocyte homing receptors and lymphocyte distribution in Peyer patches. Lymphocytes were isolated from Peyer patches and analyzed by flow cytometry. (A) Histograms depict homing receptor expression of lymphocytes isolated from Peyer patches of pBud control (shaded area) or pH60/Surv-vaccinated (black line) mice. (Top panels) Gated on CD3+CD4+ cells. (Bottom panels) Gated on CD3+CD8+ cells. Experiment was repeated once with similar results. (B) Percentage of different lymphocyte populations in Peyer patches.  indicates pBud control mice; ▪, pH60/Surv-vaccinated mice. *P < .05 compared with the pBud control group of mice. Experiment was repeated 3 times with similar results.
pH60/Surv vaccine decreases negative regulation mediated by CD4+CD25+ regulatory T cells in Peyer patches
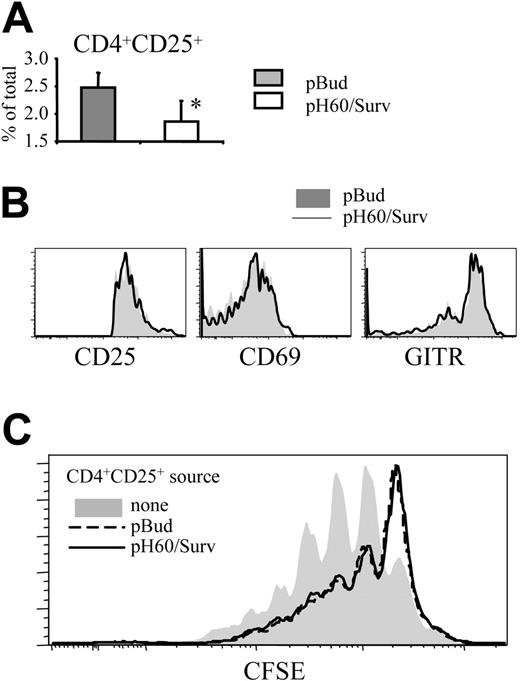
The negative regulatory effect of CD4 T cells prompted us to focus on CD4+CD25+ T cells because it was demonstrated that regulatory T (Treg) cells with this phenotype limit immune response to ensure immune tolerance.22 The pH60/Surv vaccine induced a decrease in the percentage of these CD4+CD25+ T cells in Peyer patches compared with the control group (Figure 6A). These CD4+CD25+ T cells showed no enhanced activation, as indicated by their CD25, CD69, and glucocorticoid-induced TNFR-related (GITR) gene expression levels (Figure 6B). GITR is expressed constitutively at high levels by Treg cells and is further upregulated on activation.23,24 Functionally, highly purified CD4+CD25+ cells (greater than 99% purity) from pH60/Surv-vaccinated mice showed an inhibitory capacity comparable to that of CD4+CD25+ cells of the pBud control group (Figure 6C). These data demonstrate that the pH60/Surv vaccine decreased the number of Treg cells in Peyer patches while maintaining similar activity levels, resulting in an overall decrease in negative regulation.
pH60/Surv vaccine induced long-term T-cell memory
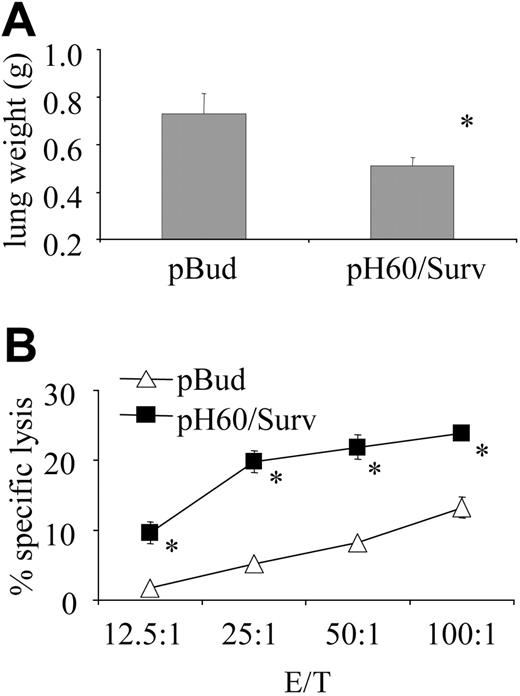
We then tested the hypothesis that increased lymphocyte cross talk leads to better T-cell priming. One way to test effective T-cell priming is to focus on the establishment of immune memory. In this regard, mice were challenged intravenously with 1 × 10⁵ CT-26 colon carcinoma cells as late as 5 months after the last vaccination. The pH60/Surv group of mice revealed reduced tumor burden (Figure 7A) and sustained high CTL activity compared with the control group (Figure 7B). These findings demonstrate the establishment of long-lived memory T cells in pH60/Surv-vaccinated mice.
pH60/Surv vaccine reduces the percentage of CD4+CD25+ T cells in Peyer patches without their activation. (A) Percentage of CD4+CD25+ cells in Peyer patches. *P < .05 compared with the pBud control group. (B) Expression of CD25 (left panel), CD69 (middle panel), and GITR (right panel) on CD3+CD4+CD25+ cells. Shaded histograms represent the pBud control group; open histograms, the pH60/Surv group. Experiment was repeated once and yielded similar results. (C) Inhibition of CD3-induced splenocyte proliferation by CD4+CD25+ cells. CFSE-labeled splenocytes were cultured with anti-CD3 antibody in the absence (shaded area) or presence of unlabeled CD3+CD4+CD25+ cells (purity greater than 99%, as determined by flow cytometry) at a 100:1 ratio. CD3+CD4+CD25+ cells were isolated from pBud control mice (black dotted line) or pH60/Surv-vaccinated mice (gray line).
pH60/Surv vaccine reduces the percentage of CD4+CD25+ T cells in Peyer patches without their activation. (A) Percentage of CD4+CD25+ cells in Peyer patches. *P < .05 compared with the pBud control group. (B) Expression of CD25 (left panel), CD69 (middle panel), and GITR (right panel) on CD3+CD4+CD25+ cells. Shaded histograms represent the pBud control group; open histograms, the pH60/Surv group. Experiment was repeated once and yielded similar results. (C) Inhibition of CD3-induced splenocyte proliferation by CD4+CD25+ cells. CFSE-labeled splenocytes were cultured with anti-CD3 antibody in the absence (shaded area) or presence of unlabeled CD3+CD4+CD25+ cells (purity greater than 99%, as determined by flow cytometry) at a 100:1 ratio. CD3+CD4+CD25+ cells were isolated from pBud control mice (black dotted line) or pH60/Surv-vaccinated mice (gray line).
Discussion
DCs, NK cells, and T cells are not independent in their function but are subject to intense cross talk. We demonstrated in our experiments this cross talk by in vivo depletion assays. The depletion of NK or CD8 T cells led to a decrease in DC activation, thereby demonstrating the positive contribution of NK cells and CD8 T cells to the activation of DCs in vivo. Several other studies have also confirmed this “helper” function of NK cells and CD8 T cells. For instance, by secreting cytokines such as IFN-γ and TNF-α, activated NK cells were shown to induce the maturation of DCs, which became resistant to tumor-related suppressor factors and showed a strongly enhanced ability to induce TH1 and CTL responses.25 Similarly, CD8+ T cells were also reported to induce the maturation of DCs in the absence of CD4+ T cells and CD40 ligation.26 Furthermore, by secreting IFN-γ, activated CD8+ T cells could induce the differentiation of monocytes to DCs, and they restored the stimulatory capacity of IL-10-treated APCs.27 The importance of this latter finding is that the secretion of IL-10 by tumor cells has been shown to be one of the mechanisms by which tumor cells escape immune surveillance.28
In addition to their ability to regulate DC activation, NK cells and CD8 T cells also regulate the activity of each other. We found that the depletion of CD8 T cells or NK cells during the priming, but not the effector, phase led to reduced NK or CTL activity, respectively. These data suggest indirect cross talk between these cells mediated through DCs or through direct NK cell/CD8 T cell interactions. Activated NK cells were reported to boost ongoing adaptive immune responses by producing IFN-γ, which, in turn, promoted TH1 polarization,29 and CD8 T cells are the major effector cells in TH1 responses. Furthermore, antigen-specific T cells can directly activate NK cells by secreting IL-2,30 which also provides signals required by NK cells in “helping” DCs.31
In contrast to the ability of NK cells and CD8 T cells to positively regulate DCs and each other, CD4 T cells appear to negatively regulate these cells. In our experiments, CD4 depletion during the priming phase led to the activation of DCs, NK cells, and CD8 T cells and to enhanced NK activity. These data suggest the existence of CD4+CD25+ Treg cells, which, in the past several years, have been the focus of tumor immunology. Depletion of CD4+CD25+ T cells in mice was reported to improve tumor clearance32 and to enhance the response to immunotherapy.33 Furthermore, tumor-infiltrating Treg cells were found to be clinically associated with reduced survival in patients with cancer.34 In our previous experiments, we showed that the depletion of CD4 T cells during the effector phase led to better protection of mice against tumor challenge,10 thereby suggesting not only the presence of Treg cells but also their negative regulation of vaccine efficacy. CD4+CD25+ Treg cells, like all CD4+ T cells, do not express the NKG2D receptor even after their activation.4 This could explain the lack of enhancement of Treg cell activation and activity observed in our experiments, despite the profound activation of DCs, NK cells, and CD8 T cells. Thus, by engaging the NKG2D receptor, our vaccine achieved preferential activation of NK cells and CD8+ T cells and thus might have tilted the balance toward immune surveillance and breakage of Treg-mediated peripheral tolerance to tumor antigens. However, it is also possible that some CD4+ T cell subpopulations are required for optimal immune responses and the generation of effective immune response and memory, as previously reported.35,36 Specifically, the lack of these subpopulations may explain the reduction in CT-26 tumor cell killing after CD4 depletion during the priming phase. The finding that CD4 T cell depletion during the effector phase also reduced CTL activity suggests that CD4 T-cell help is required for the maintenance of antigen-specific CD8 T cells in vivo, as previously suggested.37 Alternatively, the reduction in CTL activity observed in our experiments may be the result of a lack in CD4 T-cell help in tissue culture before 51Cr release assays.
Peyer patches are thought to be the location for T-cell priming induced by DNA vaccines delivered by attenuated S typhimurium.16,17 The homing of lymphocytes, mediated by selectins, chemokine receptors, and integrins, is achieved by a complex, multistep process, including capture and rolling, firm adhesion, and subsequent emigration.38 One could assume that compared with the pBud control vaccine, the pH60/Surv vaccine would stimulate CD8 T cells through TCRs in the presence of costimulatory signals provided by the NKG2D receptor. This might have been the primary reason for the robust activation of CD8 T cells observed in our experiments. In contrast, CD4 T-cell activation is predicted to be largely nonspecific and attributed to bystander effects from LPS or cytokines and would explain our finding that this activation was only moderate. These differences in initial signals and extent of activation might have contributed to the different expression profiles observed in our experiments, in which CD4 T cells showed moderate up-regulation of PSGL-1 and α4β7 integrin, shown to be induced by cytokines and LPS.39,40 In contrast, CD8 T cells displayed stronger up-regulation of PSGL-1, CCR7, and αE integrin, which were reported to be up-regulated by signaling through the TCR.20,40-42
pH60/Surv vaccine induces long-term protection against tumor cell challenge. Mice were challenged by intravenous injection of 1 × 10⁵ CT-26 colon carcinoma cells 5 months after the second vaccination and were killed 20 days later. (A) Average lung weight of challenged mice. Average lung weight of healthy mice was approximately 0.2 g. *P < .02 compared with pBud control group. (B) Splenocytes were stimulated in vitro for 5 days with irradiated CT-26 cells and then used in a standard 51Cr-release assay against CT-26 target cells. *P < .01 compared with pBud control group.
pH60/Surv vaccine induces long-term protection against tumor cell challenge. Mice were challenged by intravenous injection of 1 × 10⁵ CT-26 colon carcinoma cells 5 months after the second vaccination and were killed 20 days later. (A) Average lung weight of challenged mice. Average lung weight of healthy mice was approximately 0.2 g. *P < .02 compared with pBud control group. (B) Splenocytes were stimulated in vitro for 5 days with irradiated CT-26 cells and then used in a standard 51Cr-release assay against CT-26 target cells. *P < .01 compared with pBud control group.
L-selectin,43 CCR7,44 and α4β7 integrin45 were reported to be important homing receptors involved in lymphocyte recruitment to Peyer patches under normal circumstances. The down-regulation of L-selectin on lymphocytes observed in our experiments might have been the result of their activation because activation leads to rapid down-regulation of surface L-selectin expression on lymphocytes.18 The up-regulation of CCR7, especially on CD8 T cells, might reflect their robust activation given that CCR7 was reported to be transiently up-regulated on T cells after mitogen or anti-CD3 antibody treatment.41 Alternatively, it could also be the result of a greater percentage of naive CD8 T cells homing to Peyer patches because CCR7 is highly expressed on naive T cells and mediates these cells' homing to secondary lymphoid tissues such as Peyer patches.44 If this is the case, these findings may reflect that the pH60/Surv vaccine, delivered by attenuated S typhimurium, also induced changes in Peyer patch stromal cells, especially because these cells were the source of ligands of CCR7 (chemokines CCL19 and CCL21).44 We also observed that CD4 T cells displayed a slight up-regulation of α4β7. However, the reduced number of CD4 T cells in Peyer patches, despite their increased expression of α4β7 integrin, suggests that other homing receptors may also contribute significantly to the lymphocyte homing induced by the pH60/Surv DNA vaccine.
P-selectin is normally absent from Peyer patches but, under certain conditions, can be expressed on the high endothelial venules (HEVs) of Peyer patches.46 In our experiments, the “inflammatory” conditions created in Peyer patches could have induced the expression of P-selectin, particularly because endotoxin was shown to induce P-selectin expression.47 Thus, the up-regulation of functional PSGL-1, especially in the presence of IL-12 secreted by activated DCs, might have contributed to the homing of different lymphocytes to Peyer patches and TH1 polarization, as previously suggested.39 Furthermore, on binding their ligands, some homing receptors, such as CCR7,48 αEβ7,49 and PSGL-150 were reported to mediate costimulatory signals and to induce TH1 polarization. In our experiments, the changes of homing receptor expression profiles, and presumably changes on stromal cells, including CCL19, CCL21, and P-selectin expression, could actually favor the retention of partially activated cells and the attraction of more TH1-type cells. Therefore, such changes could lead to an increase in positive contributors and a decrease in negative regulators homing to Peyer patches and add another dimension to the cross talk induced by the pH60/Surv DNA vaccine.
Lymphocytes activated in Peyer patches, because of their homing receptor expression, are likely to home to the periphery, where they can combat tumor cells or become quiescent in the absence of antigen. It is difficult to determine their exact fate at this time because of the lack of specific and stable markers for these lymphocytes.
In summary, we demonstrated that by preferentially activating and attracting positive regulators and reducing negative regulators in Peyer patches, the pH60/Surv DNA vaccine induced increased lymphocyte cross talk and thereby established a microenvironment more suitable for NK cell activation and T-cell priming. The success of this vaccine in combating tumors of different origins and NKG2D expression levels in prophylactic and therapeutic models,10 and in inducing long-lived immune memory, shows that activation of the innate and the adaptive arms of the immune system represents an attractive strategy to overcome tumor-induced peripheral tolerance.
Prepublished online as Blood First Edition Paper, December 20, 2005; DOI 10.1182/blood-2005-10-4231.
Supported by National Institutes of Health grant CA83856 and by Department of Defense grant BC031079 (R.A.R.); Department of Defense grants DAMD17-02-10562 and DAMD17-02-1-0137 (R.X.); E. Merck, Darmstadt-Lexigen Research Center (Billerica, MA) grant SFP1330 (R.A.R.); and Susan G. Komen Breast Cancer Foundation postdoctoral training grant PDF 0201618 (H.Z.).
R.A.R. is a consultant for E. Merck, Darmstadt-Lexigen Research Center (Billerica, MA) and received partial funding for this research from this company, as indicated.
An Inside Blood analysis of this article appears at the front of this issue.
The publication costs of this article were defrayed in part by page charge payment. Therefore, and solely to indicate this fact, this article is hereby marked “advertisement” in accordance with 18 U.S.C. section 1734.
We thank C. Dolman, and D. Markowitz for excellent technical assistance and Kathy Cairns for editorial assistance. The Scripps Research Institute manuscript number is 17838-IMM.

This feature is available to Subscribers Only
Sign In or Create an Account Close Modal