Abstract
Estimation of serum free light chains (SFLC; SFKLC - kappa, SFLLC - lambda, SFKLR - kappa:lambda ratio; normal 0.26–1.65.) is useful in selected patients with non-secretory myeloma, and in light chain disease with anuric renal failure. Its utility in other clinical situations is unclear. 489 SFLC levels in 135 myeloma patients were analyzed to see if there was a significant correlation between them and other, more conventional immunologic parameters such as serum total light chain (STLC; STKLC - kappa, STLLC - lambda) levels and immunoglobulin (Ig) levels. The underlying premise was that lack of significant correlation would suggest potential value of SFLC independent of standard tests, whereas significant correlation would suggest questionable independent value of SFLC. The table below shows SFLC and STLC levels and ratios.
| Parameter . | Median (range) . | Correlation with SFKLC . | Correlation with SFLLC . | Correlation with free k:l ratio . |
|---|---|---|---|---|
| SFKLC | 14.4 (0.59–11525) | |||
| SFLLC | 18.2 (0.72–10100) | |||
| Free k:l ratio | 0.83 (0–1211.76) | |||
| STKLC | 745 (11–8810) | r=0.08; P=0.07 | ||
| STLLC | 256 (11.6–11000) | r=0.11; P=0.01 | ||
| Total k:l ratio | 2.51 (0–245) | r=0.12; P=0.008 |
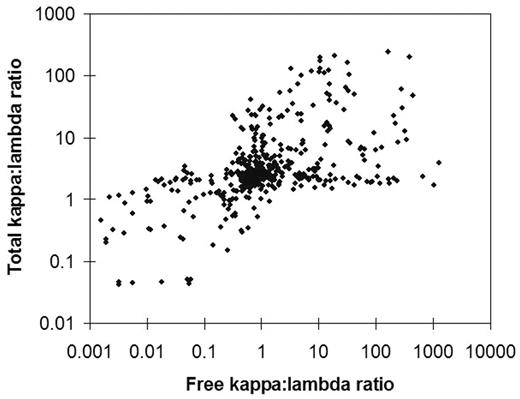
Poor correlation between free and total results within each light chain subtype (Figure 1 - log scale) and between free and total ratios (Figure 2- log scale) suggests that SFLC values provide information that is independent of STLC values because STLC values cannot be used to predict SFLC values.
Figure
Figure
The table below shows correlation between Ig and SFLC/STLC levels. For these analyses, the total Ig of the specific heavy chain subtype and SFLC/STLC of the specific light chain subtype were studied (IgG and SFKLC with IgG kappa monoclonal protein, IgA and STLLC with IgA lambda monoclonal protein, etc). Very strong correlation between STLC and Ig levels suggests that STLC values do not provide information that is independent of Ig levels. On the other hand, poor correlation between SFLC and Ig levels suggests that SFLC values do provide information that is independent of Ig values.
| Monoclonal protein . | SFLC correlation . | STLC correlation . |
|---|---|---|
| IgG kappa | r=0.04; P=0.66 | r=0.89; P<0.0001 |
| IgG lambda | r=0.13; P=0.51 | r=0.99; P<0.0001 |
| IgA kappa | r=0.49; P=0.004 | r=0.77; P<0.0001 |
| IgA lambda | r=-0.04; P=0.89 | r=0.94; P<0.0001 |
| Monoclonal protein . | SFLC correlation . | STLC correlation . |
|---|---|---|
| IgG kappa | r=0.04; P=0.66 | r=0.89; P<0.0001 |
| IgG lambda | r=0.13; P=0.51 | r=0.99; P<0.0001 |
| IgA kappa | r=0.49; P=0.004 | r=0.77; P<0.0001 |
| IgA lambda | r=-0.04; P=0.89 | r=0.94; P<0.0001 |
These data show that SFLC estimation provides information that is independent of standard quantitative serologic tests used in plasma cell dyscrasias. However, rigorous prospective evaluation of the test is needed to see if this additional information is of any clinical relevance in settings other than non-secretory disease and light chain disease with anuria.
Disclosure: No relevant conflicts of interest to declare.
Author notes
Corresponding author


This feature is available to Subscribers Only
Sign In or Create an Account Close Modal