Abstract
BACKGROUND: Wilms’ Tumor gene 1 (WT1) is highly expressed in 80% of AML patients and has been proposed as a valuable tool for minimal residual disease (MRD) detection. Though pilot studies have shown the value of MRD monitoring using WT1 as marker, particularly during therapy, no single center study has addressed the value of close monitoring both during therapy and post-therapy follow-up or developed models to reliably use this information in clinical decision-making.
AIMS:
To determine whether high residual WT1 expression at the time where complete remission is first diagnosed (CR1) is an adverse prognostic factor,
to evaluate the value of WT1 expression levels in peripheral blood (PB) and bone marrow (BM) for prediction of disease relapse, and
to develop mathematical models that will enable quantification of the central parameters related to prediction of clinical relapse.
METHODS: WT1 levels were quantified using real-time quantitative RT-PCR by normalization to the control genes B2M and ABL, and in follow-up samples expressed as a fraction of the BM diagnostic level. In a cohort of 165 adults and 18 children, treated at the Departments of Hematology and Pediatrics, Aarhus University Hospital, BM and PB samples from 90 patients (76 adults and 14 children) were analyzed at diagnosis and during therapy and follow-up (952 samples, median 8 samples/patient, range 2-38). Prognostic difference between groups was determined using the Cox Proportional Hazards statistical model including age, sex, cytogenetics, de novo/secondary leukemia, FLT3-ITD, and white blood cell counts.
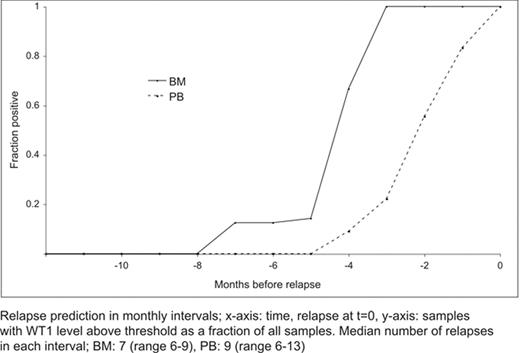
RESULTS: WT1 levels in BM and PB at CR1 above that of the average plus two standard deviations of 39 BM or 30 PB of healthy donors were found to be an independent adverse prognostic factor regarding both disease-free survival (BM: Hazard ratio (HR) 4.91, P=0.001, PB: HR 4.97, P=0.008) and overall survival (BM: HR 2.65, P=0.047, PB: HR 3.55, P=0.025). We were able to describe relapse kinetics in 29/37 relapses observed in the 90 patient cohort. By grouping 34 BM and 99 PB samples in monthly intervals prior to clinical relapse, disease development was delineated (Figure). Based on mathematical considerations involving proportions of the integrals of the graphs shown in the figure we were able to predict how sampling intervals influence relapse detection rates (RDRs) as well as the median time from WT1 positivity to clinical relapse (t(m)). For example, a BM sampling interval of 4 months will lead to a RDR of 93% and a t(m) of 74 days. A PB sampling interval of 2 months will lead to a RDR of 81% and a t(m) of 44 days.
CONCLUSIONS: CR1 WT1 expression levels in both BM and PB are independent prognostic factors in AML. Though relapse was seen earlier in BM than in PB our models demonstrates that frequent PB sampling provides an acceptable window of opportunity for initiation of preemptive cytoreduction as a consequence of molecular relapse.
Relapse prediction in monthly intervals; x-axis: time, relapse at t=0, y-axis: samples with WT1 level above threshold as a fraction of all samples. Median number of relapses in each interval; BM: 7(range 6–9), PB: 9(range 6–13)
Relapse prediction in monthly intervals; x-axis: time, relapse at t=0, y-axis: samples with WT1 level above threshold as a fraction of all samples. Median number of relapses in each interval; BM: 7(range 6–9), PB: 9(range 6–13)
Author notes
Disclosure: No relevant conflicts of interest to declare.


This feature is available to Subscribers Only
Sign In or Create an Account Close Modal