Band 3, the major protein of the human erythrocyte membrane, associates with multiple metabolic, ion transport, and structural proteins. Functional studies demonstrate that the oxygenation state of the erythrocyte regulates cellular properties performed by these and/or related proteins. Because deoxyhemoglobin, but not oxyhemoglobin, binds band 3 reversibly with high affinity, these observations raise the hypothesis that hemoglobin might regulate erythrocyte properties through its reversible, oxygenation-dependent association with band 3. To explore this hypothesis, we have characterized the binding site of deoxyHb on human erythrocyte band 3. We report that (1) deoxyHb binds to residues 12-23 of band 3; (2) mutation of residues on either side of this sequence greatly enhances affinity of deoxyHb for band 3, suggesting that evolution of a higher affinity interaction would have been possible had it been beneficial for survival; (3) Hb does not bind to 2 other sequences in band 3 despite their high sequence homology to residues 12-23, and (4) the Hb binding site on band 3 lies proximal to binding sites for glycolytic enzymes, band 4.1 and ankyrin, suggesting possible mechanisms through which multifarious erythrocyte properties might be regulated by the oxygenation state of the cell.
Introduction
Several lines of evidence suggest that the oxygenation state of the erythrocyte (RBC) regulates multiple erythrocyte properties. First, the activities of many membrane solute transporters change with the oxygen content of the cell, including volume regulatory transporters (eg, Na+/H+ exchanger), cation coupled Cl− cotransporters, amino acid transporters, and ion channels.1,,,,,,,,–10 The K/Cl cotransporter, for example, is reported to be 20-fold more active in oxygenated than in deoxygenated RBCs.9,10 Second, erythrocyte metabolism is modulated by the O2 tension of the medium. Thus, glucose flux through the pentose phosphate pathway proceeds twice as rapidly in oxygenated as in deoxygenated cells, and glucose consumption in glycolysis is inhibited by oxygenation.11 Third, erythrocyte deoxygenation may affect membrane structural properties. For example, deoxygenated hemoglobin (Hb) (but not oxygenated Hb [oxyHb]) competes with ankyrin for binding to band 3, and band 3 retention in detergent-extracted membrane skeletons is greatly reduced in skeletal pellets from deoxygenated cells (M. Stefanovic and P.S.L., unpublished data, December 2005). Furthermore, ankyrin epitopes are more accessible to anti-ankyrin antibodies in deoxygenated than in oxygenated RBCs. Taken together, these latter findings imply a looser association of ankyrin with the membrane in deoxygenated than in oxygenated erythrocytes.
In searching for a mechanism to account for oxygenation effects on red cell properties, identification of both the O2 sensor and downstream effector was considered important. A major candidate for the O2 sensor was presumed to be Hb, because the O2 dependence of the above properties generally follows the O2 dissociation curve of Hb.4,12,13 The downstream effector has been more uncertain, but band 3 has represented the prime candidate, because it constitutes the only established binding site of Hb on the membrane. Moreover, multiple observations document that the interaction between Hb and band 3 is O2-dependent, where association has been found to occur primarily, if not exclusively, with deoxygenated Hb.14,15 Thus, the cytoplasmic domain of band 3 (cdb3) is known to shift the O2 dissociation curve of Hb to higher O2 pressures,15 suggesting preferential association with deoxyHb. Further, an N-terminal peptide of band 3 has been shown by X-ray crystallography to bind within the central cavity of the deoxyHb tetramer.15 Because this cavity is occluded in oxyHb, the same interaction would not be possible in the presence of O2.15 More convincingly, deoxyHb (but not oxyHb) displaces glycolytic enzymes from their association with band 3 in intact cells,16 suggesting that an O2-dependent association of Hb with band 3 also occurs in vivo. Because binding of deoxyHb to band 3 induces structural changes throughout the entire band 3 molecule,17,18 a mechanism allowing proteins that associate with band 3 to detect when erythrocytes become deoxygenated naturally exists. And because band 3 may associate with multiple cytoskeletal components (eg, ankyrin, protein 4.1, adducin19,20 ), glycolytic enzymes (glyceraldehyde-3-phosphate dehydrogenase, aldolase, phosphofructokinase21,–23 ), and solute transporters (Rh polypeptides, Na/K-ATPase24,25 ), pathways can be readily envisioned whereby O2 might regulate erythrocyte properties.
To more precisely characterize the roles of band 3 and Hb in erythrocyte regulation, we have expressed a series of site-directed mutants of band 3 and have examined their O2 dependent associations with Hb. Based on their affinities for deoxyHb, we have defined sequences of band 3 that are both critical and inhibitory to the band 3-Hb interaction.
Methods
Construction, expression, and purification of recombinant band 3 mutants
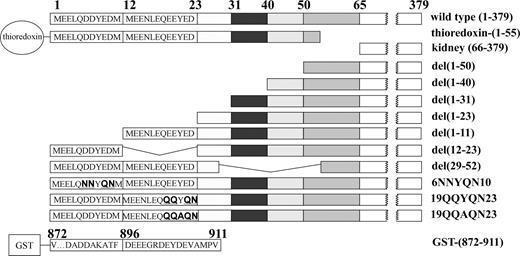
Wild-type and mutant isoforms of both N- and C-terminal domains of band 3 were prepared as described previously.21 A schematic representation of human cdb3 and the mutants used in this study is shown in Figure 1.
Schematic representation of wild-type human cdb3 and the mutants used in this study. Deleted sequences are represented pictorially as empty boxes. The abbreviation for each construct is listed on the right. For mutants with deleted residues, the parentheses designate the deleted sequence. For mutants with substituted residues, a bold, underlined font indicates the substitutions. Thioredoxin-(1-55) denotes a fusion protein in which thioredoxin is linked to NH2-terminal residues 1-55 of band 3; kidney (66-379) denotes a construct containing residues 66-379 of band 3; del(1-50) denotes a construct containing residues 51-379 of band 3; del(1-40) denotes a construct containing residues 51-379 of band 3; del(1-31) denotes a construct containing residues 32-379 of band 3; del(1-23) denotes a construct containing residues 24-379 of band 3; del(1-11) denotes a construct containing residues 51-379 of band 3; del(12-23) denotes a construct where NH2-terminal residues 1-11 are fused to residues 24-379 of band 3; del(29-52) denotes a construct where NH2-terminal residues 1-28 are fused to residues 53-379 of band 3; 6NNYQN10 denotes a construct containing residues 1-379 of band 3 where residues 6-10 (DDYED) are replaced with NNYQN; 19QQYQN23 and 19QQAQN23 denote NH2-terminal residues 1-379 where residues 19-23 (EEYED) are replaced with QQYQN or QQAQN; GST-(871-911) denotes a fusion protein where glutathione transferase is linked to the NH2 terminus of residues 872-911 of band 3 (ie, the polypeptide's extreme COOH terminus).
Schematic representation of wild-type human cdb3 and the mutants used in this study. Deleted sequences are represented pictorially as empty boxes. The abbreviation for each construct is listed on the right. For mutants with deleted residues, the parentheses designate the deleted sequence. For mutants with substituted residues, a bold, underlined font indicates the substitutions. Thioredoxin-(1-55) denotes a fusion protein in which thioredoxin is linked to NH2-terminal residues 1-55 of band 3; kidney (66-379) denotes a construct containing residues 66-379 of band 3; del(1-50) denotes a construct containing residues 51-379 of band 3; del(1-40) denotes a construct containing residues 51-379 of band 3; del(1-31) denotes a construct containing residues 32-379 of band 3; del(1-23) denotes a construct containing residues 24-379 of band 3; del(1-11) denotes a construct containing residues 51-379 of band 3; del(12-23) denotes a construct where NH2-terminal residues 1-11 are fused to residues 24-379 of band 3; del(29-52) denotes a construct where NH2-terminal residues 1-28 are fused to residues 53-379 of band 3; 6NNYQN10 denotes a construct containing residues 1-379 of band 3 where residues 6-10 (DDYED) are replaced with NNYQN; 19QQYQN23 and 19QQAQN23 denote NH2-terminal residues 1-379 where residues 19-23 (EEYED) are replaced with QQYQN or QQAQN; GST-(871-911) denotes a fusion protein where glutathione transferase is linked to the NH2 terminus of residues 872-911 of band 3 (ie, the polypeptide's extreme COOH terminus).
Hb preparation
Human blood was drawn from healthy, nonsmoking adults after informed consent. Plasma was removed by washing the cells three times in PBS, and the buffy coat was carefully aspirated after each centrifugation to assure depletion of white cells. Washed erythrocytes were lysed in 5 mM sodium phosphate, pH 8, and membranes were removed by centrifugation. The hemoglobin-rich supernatant was bubbled with O2 for 5 minutes to partially dissociate 2,3-bisphosphoglycerate (2,3-BPG), and the Hb was purified by gel filtration and ion-exchange chromatography to deplete 2,3-BPG and remove any possible denatured Hb. The aforementioned gel filtration chromatography was carried out on a 1.6 × 60-cm Sephacryl S-100 High Performance FPLC column (GE Healthcare, Chalfont St Giles, United Kingdom) using PBS, pH 7.4, as eluting agent. The eluted Hb was dialyzed against 10 mM bis-Tris acetate, pH 6.5, before passage down a Q Sepharose Fast Flow column (GE Healthcare). The purified Hb was eluted by 10 mM bis-Tris acetate, pH 6.5, and its concentration was determined by absorbance at 540 nm. Lower pH (pH 6.5) and ionic strength were used in these studies, because these solution conditions are known to compensate for the loss of excluded volume effects that normally drive protein-protein interactions in the concentrated Hb environment of the intact erythrocyte.26,27
Determination of 2,3-bisphosphoglycerate concentration
The concentration of 2,3-BPG on our Hb preparations was determined using a commercial kit (Roche Applied Science) with several modifications to improve the sensitivity of the determination. The sample was mixed with 0.5 volumes of 6 M HClO4 (instead of admixing 5 volumes of 0.6 M HClO4), and the spectrophotometric procedure was carried out by addition of 1000 μL of neutralized sample and 400 μL of 0.5 M triethanolamine buffer, instead of 100 μL of neutralized sample and 2 mL of 0.1 M triethanolamine buffer, as described in the manufacturer's instructions. With these modifications, the sensitivity and linearity of the determination was lowered to 10 μM.
Measurement of deoxyHb binding to cdb3 by analysis of O2 dissociation curves
Hb and cdb3 or its mutants were dialyzed against 10 mM bis-Tris acetate buffer, pH 6.5. Twenty nanomoles of 2,3-BPG-depleted Hb were incubated in a cuvette with 10 nmol cdb3 in a total volume of 200 μl for 3 minutes at 37°C. Then, 2.3 mL of 10 mM bis-Tris acetate buffer, pH 6.5, 20 μL 20% (w/v) bovine serum albumin, and 8 μl antifoam solution (TCS, Southampton, PA) were added to the cuvette. Oxygen-Hb dissociation curves were generated on a HEMOX analyzer (TCS) according to manufacturer's instructions.
Direct measurement of deoxyHb binding to band 3
Purified wild-type cdb3 (residues 1-379) or one of its mutants was immobilized onto Affi-Gel 15 beads (Bio-Rad Laboratories, Hercules, CA) according to a previous protocol.28 In brief, 100 μl packed beads were reacted with 4 nmol cdb3 or one of its mutants in a total volume of 2 mL. After mixing gently overnight at 4°C, unreacted Affi-Gel sites were blocked by incubating for 1 hour in 1 M ethanolamine, pH 8.0. The resulting beads were washed with ice-cold double-distilled H2O and equilibrated in 10 mM bis-Tris acetate buffer, pH 6.5. The amount of cdb3 bound to the beads was determined by hydrolyzing the immobilized cdb3 in 1 N NaOH at 110°C for 2 hours and measuring the protein concentration according to a Micro BCA Protein assay (Pierce Biotech, Rockford, IL) using bovine serum albumin as a standard and ethanolamine-derivatized gel as a control. Derivatized beads were incubated for 1 hour at room temperature under a stream of argon with Hb isolated as described Hb preparation except 2,3-BPG was not removed. The incubated beads were washed twice in 10 mM bis-Tris acetate buffer containing 35% polyethylene glycol 1500 (predeoxygenated) to remove unbound Hb, and bound Hb was removed by stripping with 100 mM trisodium phosphate containing 500 mM NaCl, pH 7.4. The Hb eluted was quantified by determining its absorbance at 540 nm. The molar ratio of Hb bound to cdb3 was calculated as the ratio of bound Hb tetramers (molecular weight [MW]: 66 000) to cdb3 monomers, using the MW of a wild-type cdb3 monomer as 42 535, the MW of del(12-23) cdb3 monomer as 40 996, and MW of del(29-52) cdb3 monomer as 39 926.
Results
Evaluation of the deoxyHb binding site on erythrocyte membrane band 3
Because band 3 binds preferentially, if not exclusively, to deoxyHb, the affinity of Hb for oxygen in the presence of band 3 must be inversely related to the affinity of deoxyhemoglobin for band 3.15 Therefore, we chose to use the shift in Hb-O2 affinity in the presence of various mutants of band 3 to measure the effect of each mutation on the mutant's affinity for deoxyHb. For this purpose, Hb was purified from freshly drawn erythrocytes, and its affinity for O2 was examined in the presence of various constructs of band 3 using an automated HEMOX analyzer (see “Methods”). To maximize any effect of band 3 on Hb-O2 association, we used 2,3-BPG-depleted Hb during measurement of the Hb-O2 dissociation curves. 2,3-BPG depletion was achieved by purifying Hb on consecutive gel filtration and ion exchange columns (see “Measurement of deoxyHb binding to cdb3 by analysis of O2 dissociation curves”), yielding a Hb preparation with a 2,3-BPG-to-Hb molar ratio of 0.08:1.
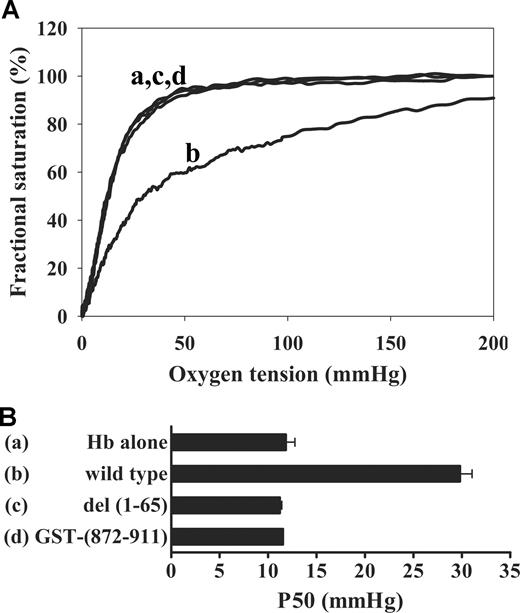
Although published results14,15,28 suggest that the membrane binding site of deoxyHb resides at the N terminus of band 3, the specific residues involved in the band 3 interaction were never established. To identify these residues, wild-type cdb3 (residues 1-379), the exposed region at the C terminus of band 3 (residues 872-911), and kidney cdb3 (residues 66-379) were compared for their abilities to shift the Hb-O2 dissociation curve. As shown in Figure 2, wild-type cdb3 displaces the curve significantly to the right, shifting the apparent P50 (oxygen partial pressure at which hemoglobin saturation is 50%) from 12 to 30 mmHg, as expected.15 In contrast, kidney cdb3, which lacks the first 65 amino acids of wild-type cdb3, has no effect on Hb-O2 affinity. Furthermore, the C terminus of band 3, whose sequence (902DEYDE906) is homologous to tandem sequences at the extreme N terminus of band 3 (6DDYED10 and 19EEYED23), does not perturb O2 dissociation. Taken together, these results suggest that the deoxyHb binding site on band 3 resides within the polypeptide's first 65 residues.
Effect of band 3 isoforms on Hb-O2 equilibrium. (A) Hb-oxygen dissociation curves were measured for Hb alone (a) or Hb in the presence of wild-type cdb3 (b), kidney cdb3 (c), or GST-(872-911) (d). Hb (20 nmol) was mixed in a cuvette with 10 nmol of cdb3 in a total volume of 200 μl in 10 mM bis-Tris acetate buffer, pH 6.5. After 3 minutes' incubation at 37°C, 2.3 mL of 10 mM bis-Tris acetate buffer, pH 6.5, 20 μl of 20% (w/v) bovine serum albumin, and 8 μl of antifoam solution were added to the solution. Hb-O2 dissociation curves were then generated in a HEMOX analyzer. (B) Graphic comparison of P50 values in the presence and absence of the above band 3 isoforms (error bars represent 1 SD).
Effect of band 3 isoforms on Hb-O2 equilibrium. (A) Hb-oxygen dissociation curves were measured for Hb alone (a) or Hb in the presence of wild-type cdb3 (b), kidney cdb3 (c), or GST-(872-911) (d). Hb (20 nmol) was mixed in a cuvette with 10 nmol of cdb3 in a total volume of 200 μl in 10 mM bis-Tris acetate buffer, pH 6.5. After 3 minutes' incubation at 37°C, 2.3 mL of 10 mM bis-Tris acetate buffer, pH 6.5, 20 μl of 20% (w/v) bovine serum albumin, and 8 μl of antifoam solution were added to the solution. Hb-O2 dissociation curves were then generated in a HEMOX analyzer. (B) Graphic comparison of P50 values in the presence and absence of the above band 3 isoforms (error bars represent 1 SD).
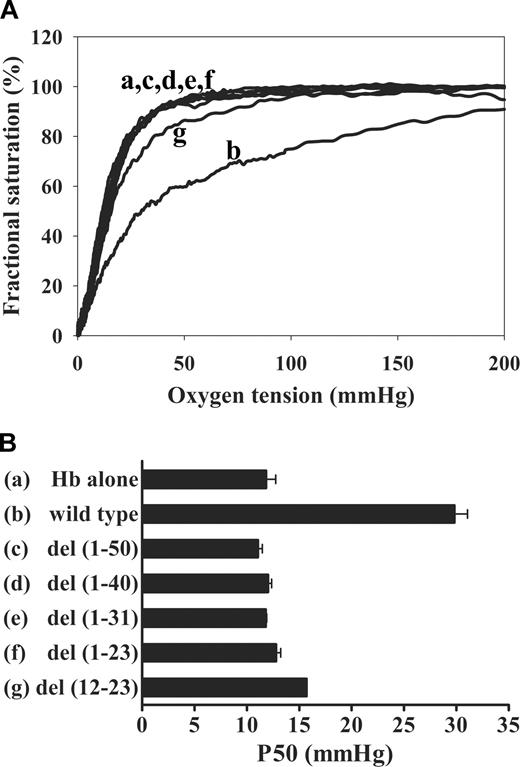
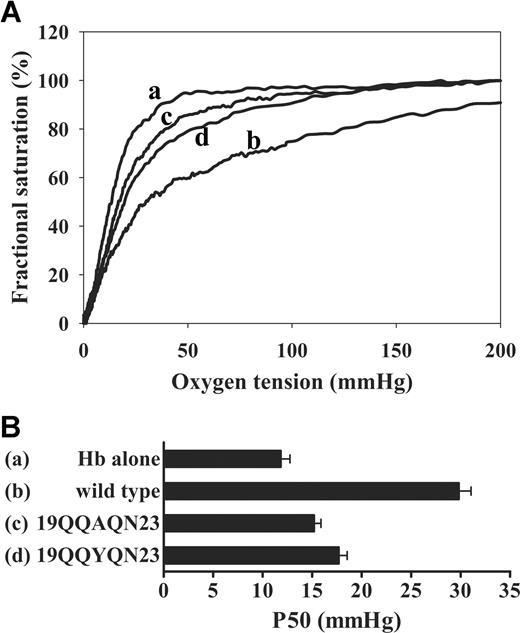
To more precisely define the amino acids involved in deoxyHb binding, various deletion mutants of cdb3 were expressed and examined. As shown in Figure 3, O2 dissociation curves for Hb were not significantly perturbed by constructs lacking residues 12-23 (ie, del(1-50), del(1-40) del(1-31), del(1-23) and del(12-23)), suggesting that residues 12-23 are essential for deoxyHb binding. Because previous studies showed that tyrosine phosphorylation of band 3 (primarily on Tyr 8 and 21) induces dissociation of Hb,28 we decided to explore in greater detail whether 19EEYED23 might directly participate in deoxyHb binding. For this purpose, we mutated the above acidic residues to their uncharged counterparts (Glu→Gln, Asp→Asn) and examined the effect of these mutations on Hb-O2 affinity. As anticipated, substitution of the 4 acidic amino acids yielded a mutant protein (19QQYQN23) with significantly reduced affinity for deoxyHb (P50 ∼ 18 mm Hg). Additional substitution of Tyr21 with Ala (19QQAQN23) yielded a second mutant with even less affinity for Hb (P50 ∼ 15 mm Hg; Figure 4). Because all mutations involving residues 12-23 either eliminated or significantly decreased cdb3-deoxyHb affinity, we conclude that the major site of deoxyHb binding to band 3 resides within this sequence.
Effect of NH2-terminal truncation mutants of cdb3 on Hb-O2 equilibrium. (A) Hb-oxygen dissociation curves were measured for Hb alone (a), or Hb in the presence of wild-type cdb3 (b), del(1-50) (c), del(1-40) (d), del(1-31) (e), del(1-23) (f), or del(12-23) (g). (B) Graphic comparison of P50 values in the presence and absence of the above truncation mutants (error bars represent 1 SD).
Effect of NH2-terminal truncation mutants of cdb3 on Hb-O2 equilibrium. (A) Hb-oxygen dissociation curves were measured for Hb alone (a), or Hb in the presence of wild-type cdb3 (b), del(1-50) (c), del(1-40) (d), del(1-31) (e), del(1-23) (f), or del(12-23) (g). (B) Graphic comparison of P50 values in the presence and absence of the above truncation mutants (error bars represent 1 SD).
Effect of mutations in residues 12-23 of cdb3 on Hb-O2 equilibrium. (A) Hb-oxygen dissociation curves were measured for Hb alone (a), Hb in the presence of wild-type cdb3 (b), substitution mutants 19QQAQN23 (c), or 19QQYQN23 (d). (B) Graphic comparison of P50 values in the presence and absence of the above mutants spanning residues 12-23 (error bars represent 1 SD).
Effect of mutations in residues 12-23 of cdb3 on Hb-O2 equilibrium. (A) Hb-oxygen dissociation curves were measured for Hb alone (a), Hb in the presence of wild-type cdb3 (b), substitution mutants 19QQAQN23 (c), or 19QQYQN23 (d). (B) Graphic comparison of P50 values in the presence and absence of the above mutants spanning residues 12-23 (error bars represent 1 SD).
Evaluation of mutations in sequences flanking residues 12-23 on Hb binding
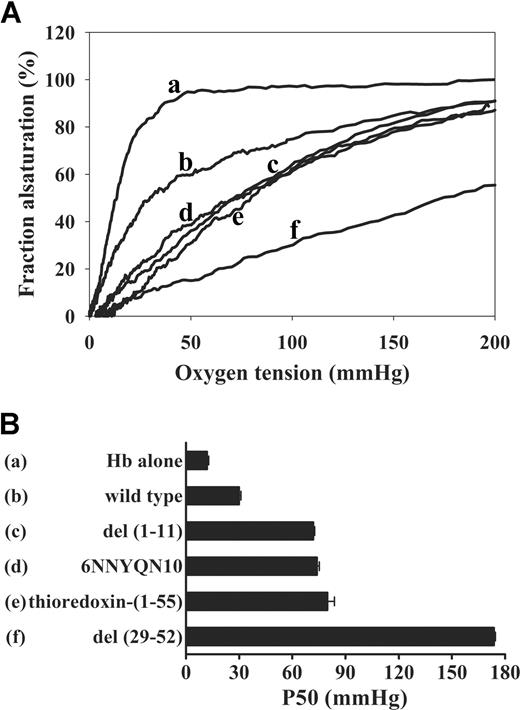
Directly adjacent to residues 12-23 of band 3 lies a homologous sequence (1-MEELQDDYEDM-11) that we hypothesized might also contain a binding site for deoxyHb. To test this hypothesis, we constructed a cdb3 mutant that lacked residues 1-11 and examined its effect on the Hb-O2 dissociation curve. As shown in Figure 5, deletion of residues 1-11 [del(1-11)] not only failed to reduce deoxyHb binding affinity but also surprisingly shifted the Hb-O2 dissociation curve further to the right (P50 ∼ 72 mm Hg) than wild-type cdb3 (P50 ∼ 30 mm Hg). Therefore, despite the high homology to residues 12-23, the presence of residues 1-11 not only fails to enhance but also inhibits cdb3 interactions with deoxyHb.
Effect of mutations in sequences adjacent to the deoxyHb binding site on cdb3 on Hb-O2 equilibrium. (A) Hb-oxygen dissociation curves were measured for Hb alone (a), Hb in the presence of wild type cdb3 (b), 6NNYQN10 (c), del(1-11) (d), thioredoxin-(1-55) (e), or del (29-52) (f). (B) Comparison of P50 values in the presence and absence of the above truncation mutants (error bars represent 1 SD).
Effect of mutations in sequences adjacent to the deoxyHb binding site on cdb3 on Hb-O2 equilibrium. (A) Hb-oxygen dissociation curves were measured for Hb alone (a), Hb in the presence of wild type cdb3 (b), 6NNYQN10 (c), del(1-11) (d), thioredoxin-(1-55) (e), or del (29-52) (f). (B) Comparison of P50 values in the presence and absence of the above truncation mutants (error bars represent 1 SD).
To further establish the inhibitory nature of the NH2-terminal 11 residues on deoxyHb affinity, we mutated the central residues in this sequence to closely related counterparts (6DDYED10 → 6NNYQN10) and examined the resulting effect on Hb-O2 dissociation. Consistent with the previous data, these mutations also yielded a protein with exaggerated affinity for deoxyHb (P50 ∼ 74 mm Hg; Figure 5). In fact, the mutated cdb3 forced ∼ 40% of Hb to remain deoxygenated at O2 pressures normally found in the lungs (ie, 100 mmHg, where Hb is usually 98% oxygenated). Furthermore, a cdb3 construct containing thioredoxin fused to the NH2 terminus of cdb3 [thioredoxin-1-55], which had been previously shown to sterically prevent proteins from interacting with residues 1-11,21 also exhibited a much higher affinity for deoxyHb (P50 ∼ 80 mm Hg) than did wild-type cdb3 (P50 ∼ 30 mm Hg; Figure 5). Taken together, we conclude residues 1-11 act to suppress cdb3 affinity for deoxyHb and that mutations within this sequence shift the Hb-O2 dissociation curve to higher O2 pressures.
We next explored the influence of residues downstream from the deoxyHb binding site on the Hb-O2 binding equilibrium. As seen in Figure 5, deletion of residues 29-52 yielded a cdb3 mutant with the highest Hb-O2 equilibrium shift yet measured (P50 ∼ 174 mm Hg). Thus, in the presence of del(29-52) cdb3, oxygen saturation was not even approached at the maximum O2 pressure achievable in the HEMOX analyzer (ie, 200 mm Hg). Therefore, we conclude that sequences on both sides of the deoxyHb binding site on band 3 (ie, residues 12-23) act to suppress rather than enhance Hb-band 3 affinity.
Direct measurement of deoxyHb binding to band 3
To verify that the observed shifts in the Hb-O2 saturation curve accurately reflect differences in cdb3 affinity for deoxyHb, we measured deoxyHb binding to cdb3 directly using cdb3 immobilized on Affi-gel beads, as described in “Direct measurement of deoxyHb binding to band 3.” Furthermore, to simulate conditions that might exist inside the red cell, 2,3-BPG was not removed from the Hb preparation before band 3 binding analysis, yielding an Hb sample with a 2,3-BPG-to-Hb ratio of 0.82:1 (ie, a value within the reported physiologic range).29 As seen in Figure 6, the cdb3 construct found to exert virtually no effect on Hb-O2 affinity (ie, del(12-23) cdb3) also displayed little affinity for deoxyHb, whereas the construct with the largest effect on Hb-O2 affinity (ie, del(29-52) cdb3) also displayed the highest affinity for deoxyHb. It is noteworthy that wild-type cdb3, which had an intermediate effect on Hb-O2 affinity, also showed an intermediate affinity in the direct binding studies. These results confirm the deoxyHb mapping data described above and corroborate the observation that the net affinity of cdb3 for deoxyHb is a consequence of adjacent sequences that both contribute to and inhibit the association.
Comparison of the direct binding affinity of deoxyHb for wild-type and 2 mutants of cdb3. Purified wild-type cdb3 (residues 1-379), a low-affinity mutant [del(12-23)] and a high-affinity mutant [del(29-52)] were immobilized onto Affi-Gel 15 beads. Derivatized beads were equilibrated in 10 mM bis-Tris acetate buffer, pH 6.5, and excess predialyzed Hb was added before incubation for 1 hour at room temperature with gentle agitation under argon. Beads were washed 2 times with deoxygenated 35% polyethylene glycol 1500 in 10 mM bis-tris acetate buffer, pH 6.5, to remove unbound Hb. Bound Hb was then determined by stripping the beads with 100 mM trisodium phosphate, 500 mM NaCl, pH 7.4, and measuring the absorbance of the eluate at 540 nm. The molar ratio of bound Hb to cdb3 was calculated as the ratio of bound Hb tetramers to cdb3 monomers.
Comparison of the direct binding affinity of deoxyHb for wild-type and 2 mutants of cdb3. Purified wild-type cdb3 (residues 1-379), a low-affinity mutant [del(12-23)] and a high-affinity mutant [del(29-52)] were immobilized onto Affi-Gel 15 beads. Derivatized beads were equilibrated in 10 mM bis-Tris acetate buffer, pH 6.5, and excess predialyzed Hb was added before incubation for 1 hour at room temperature with gentle agitation under argon. Beads were washed 2 times with deoxygenated 35% polyethylene glycol 1500 in 10 mM bis-tris acetate buffer, pH 6.5, to remove unbound Hb. Bound Hb was then determined by stripping the beads with 100 mM trisodium phosphate, 500 mM NaCl, pH 7.4, and measuring the absorbance of the eluate at 540 nm. The molar ratio of bound Hb to cdb3 was calculated as the ratio of bound Hb tetramers to cdb3 monomers.
Homology analysis
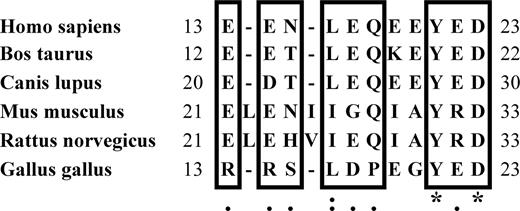
Although O2 regulation of red cell properties has not been extensively studied in other species, similar O2-dependencies have been observed in rodents, birds, and fish.2,–4,30,,,–34 The question therefore arises whether the deoxyHb binding sequence on human band 3 might be conserved in these other species. Although amino acid insertions and deletions frequently occur near the NH2-termini of all band 3 homologs, a region of high homology can nevertheless be identified in mammalian and avian sequences35 but not in the sequences of fish (rainbow trout and zebrafish) band 3 homologs (Figure 7). Perhaps consistent with these observations, O2 regulation of ion transport in mammalian and avian species exhibits an O2 concentration dependence that follows the O2 dissociation curve of Hb.4,13,30 In contrast, the O2 dependence of KCl cotransport in fish displays a P50 value well below the P50 of fish Hb for O2.33,34 These results suggest that a mechanistically distinct pathway for O2 regulation of ion transport may exist in fish red cells.
Homology analysis of the deoxyHb binding sequence on band 3. The species for each sequence is listed on the left. Conserved residues are framed in boxes, under which the degree of homology is indicated: *, complete conservation; :, conserved substitutions are observed; and ., semiconserved substitutions are observed.
Homology analysis of the deoxyHb binding sequence on band 3. The species for each sequence is listed on the left. Conserved residues are framed in boxes, under which the degree of homology is indicated: *, complete conservation; :, conserved substitutions are observed; and ., semiconserved substitutions are observed.
Discussion
We have provided evidence that (1) deoxyHb associates with band 3 at residues 12-23 and (2) sequences flanking this region of band 3 serve to reduce rather than enhance Hb-band 3 affinity. Because the O2 dependence of this Hb-band 3 interaction is optimally positioned to span the physiologic range of O2 pressures, we hypothesize that the reversible association of deoxyHb with band 3 could constitute a mechanism through which red cell oxygenation regulates erythrocyte properties. However, because the free (unbound) concentrations of Mg2+, 2,3-BPG, H+, and O2 also change during red cell deoxygenation, shifts in any of these solutes could also generate a signal that triggers O2-dependent changes in red cell behavior. Although the potential role of the band 3-Hb interaction in regulating red cell properties will be explored further below, additional research will obviously be required before the relative contributions of each of the above variables can be established in vivo.
Given the strong impact of band 3 on Hb-O2 affinity, the question naturally arises whether band 3 might also participate in regulation of O2 delivery. Unfortunately, 2 possible answers to this question exist, depending on the regulatory mechanism under consideration. Because an average red cell contains approximately 270 000 000 copies of Hb (tetramer) and 1 200 000 copies of band 3,36 less than 0.5% of the cell's Hb will ever have the opportunity to associate with band 3. Therefore, the impact of band 3 on global Hb-O2 affinity must be negligible. In contrast, Hb is also believed to catalyze the synthesis and release of nitric oxide (NO),37,–39 a second messenger that enhances blood flow by promoting vascular dilation. It is noteworthy that NO production is thought to be controlled by the oxygenation state of Hb.37,–39 Because NO is rapidly inactivated upon its release, only NO that is produced at the membrane surface is likely to escape the red cell and be available to modify vascular function. Therefore, the population of Hb proximal to band 3 may contribute most to NO-mediated regulation of the vasculature.40,–42 In this scenario, the impact of band 3 on NO delivery could be substantial.
As reported previously,21 residues 1-23 of band 3 contain binding sites for glycolytic enzymes such as aldolase, glyceraldehyde-3-phosphate dehydrogenase (GAPDH), and phosphofructo-kinase (PFK). When these enzymes are bound to band 3, they are partially inhibited, but when they are free, they are fully active.21,–23 Because there are approximately 500 000 copies of GAPDH, approximately 20 000 copies of aldolase, and approximately 6000 copies of PFK per red cell,43,44 sufficient numbers of band 3 exist to bind all of the above enzymes. However, because these glycolytic enzymes compete directly with deoxyHb for the NH2 terminus of band 3, the enzymes are displaced during erythrocyte deoxygenation.16 This O2-dependent competition between glycolytic enzymes and deoxyHb for enzyme inhibitory sites on band 3 would be expected to lead to O2-dependent modulation of glucose metabolism. Indeed, glucose flux through glycolysis has been observed to increase, whereas flux through the pentose phosphate pathway has been seen to decrease during red cell deoxygenation.45 This response is believed to be adaptive, because it allows for elevated NADPH production during periods of prolonged O2 stress and enhanced ATP production during times of extended deoxygenation. It is noteworthy that a recent comparison of glucose metabolism in wild-type and band 3 knockout erythrocytes demonstrates that band 3 is essential for the O2-dependent switch from the pentose phosphate pathway to glycolysis.45 Therefore, these studies collectively suggest that RBC oxygenation can regulate metabolism through a reversible association of deoxyHb with band 3.
As noted in the Introduction, there is also evidence that O2 can modulate erythrocyte membrane mechanical properties. The major linkage between the erythrocyte membrane bilayer and spectrin-based skeleton is provided by the ankyrin-band 3 bridge.46 Although residues 175-185 constitute the major ankyrin-binding site on cdb3, other studies also indicate that the NH2 terminus of cdb3 lies proximal to a secondary cdb3-ankyrin binding site.19 Thus, a monoclonal antibody to residues 1-10 of cdb3 can block ankyrin binding to band 3, and ankyrin association with cdb3 prevents p72syk phosphorylation of cdb3 on Tyr8 and Tyr21.19 The observations that ankyrin association with potassium iodide-stripped inside-out vesicles (KI-IOVs) is prevented by deoxyHb, but not oxyHb (M. Stefanovic and P.S.L., unpublished data, December 2005) and that deoxyHb binds to residues 12-23 of cdb3 provide a possible mechanism whereby red cell oxygenation state can alter membrane mechanical properties.
There is also reason to conjecture that the band 3-deoxyHb interaction can regulate ion transport in erythrocytes. Thus, the anion transport inhibitor 4,4′-diisothiocyanatostilbene-2,2′-disulfonic acid (DIDS) is known to react almost exclusively with band 3 on (Lys539 or Lys542) near the outer surface of the erythrocyte membrane.47,48 It is noteworthy that DIDS binding to this external site significantly alters Hb binding to the NH2 terminus of cdb3,18 suggesting that significant structural communication occurs between the deoxyHb binding site and the membrane-spanning domain of band 3. Could this conformational communication be used to signal the oxygenation state to solute transporters associated with the membrane-spanning domain of band 3? The KCl cotransporter, which changes flux rate 20-fold between oxygenated and deoxygenated cells,9 has been shown to be inhibited in DIDS-labeled cells.49,50 Because there is no evidence that DIDS reacts with the KCl cotransporter, one possible explanation is that DIDS inhibition is mediated through an intimate association of the KCl transporter with band 3. Along similar lines, Fossel et al25,51 have presented evidence for structural communication between band 3 and the Na+/K+-ATPase, where Na+ binding to the ATPase alters glyceraldehyde-3-phosphate dehydrogenase on cdb3. Because this conformational communication is also abrogated by band 3 labeling with DIDS, a related signal transduction pathway can be envisioned to account for oxygenation effects on Na+/K+ transport.4,8,10 Because much remains to be learned about mechanisms of communication between band 3 and associated proteins, it will be important to test the above hypotheses in transgenic mice in which deoxyHb binding to band 3 has been either eliminated or enhanced by introduction of the appropriate mutations.
Finally, as noted above, previous studies have shown that a peptide comprising residues 1-11 of band 3 binds within the 2,3-BPG binding cleft of deoxyHb and shifts the O2 dissociation curve to higher pressures.15 Although no comparison of this NH2-terminal peptide with other band 3 peptides was ever pursued, these previous data nevertheless suggest that the isolated NH2-terminal 11 amino acids of band 3 exhibit affinity for deoxyHb. The data reported here, however, demonstrate that either removal or mutagenesis of this peptide enhances rather than reduces band 3-deoxyHb affinity. Although an unequivocal explanation of this apparent discrepancy cannot be offered, we hypothesize that residues 1-11 somehow inhibit access of deoxyHb to its higher affinity site on residues 12-23 of cdb3, thereby reducing the net affinity of the interaction. Although other explanations are also possible, the total mutagenesis data nevertheless demonstrate that nature could have evolved either a much higher or lower affinity band 3-deoxyHb interaction had it been desirable, suggesting that the intermediate affinity that was finally selected might have evolved for an important purpose.
The publication costs of this article were defrayed in part by page charge payment. Therefore, and solely to indicate this fact, this article is hereby marked “advertisement” in accordance with 18 USC section 1734.
Acknowledgment
This work was supported by National Institutes of Health grant GM24417-29.
National Institutes of Health
Authorship
Contribution: H.C. and P.S.L. designed the research, analyzed the data, and wrote the manuscript. H.C., A.B., and P.C. performed the experiments. R.S.F. contributed HEMOX analyzer, helped evaluate the data, and reviewed the manuscript.
Conflict-of-interest disclosure: The authors declare no competing financial interests.
Correspondence: Philip S. Low, Department of Chemistry, Purdue University, 560 Oval Drive, West Lafayette, IN 47907; e-mail: plow@purdue.edu.

![Figure 6. Comparison of the direct binding affinity of deoxyHb for wild-type and 2 mutants of cdb3. Purified wild-type cdb3 (residues 1-379), a low-affinity mutant [del(12-23)] and a high-affinity mutant [del(29-52)] were immobilized onto Affi-Gel 15 beads. Derivatized beads were equilibrated in 10 mM bis-Tris acetate buffer, pH 6.5, and excess predialyzed Hb was added before incubation for 1 hour at room temperature with gentle agitation under argon. Beads were washed 2 times with deoxygenated 35% polyethylene glycol 1500 in 10 mM bis-tris acetate buffer, pH 6.5, to remove unbound Hb. Bound Hb was then determined by stripping the beads with 100 mM trisodium phosphate, 500 mM NaCl, pH 7.4, and measuring the absorbance of the eluate at 540 nm. The molar ratio of bound Hb to cdb3 was calculated as the ratio of bound Hb tetramers to cdb3 monomers.](https://ash.silverchair-cdn.com/ash/content_public/journal/blood/111/2/10.1182_blood-2007-07-100180/4/m_zh80040812770006.jpeg?Expires=1769953347&Signature=EQ-xmcie~vp-~JeXEGkVyWOP9t4~0YjReG3CCWBR42XVSvVbj893dq06kclOwAqUQZqqdjKbLmATA9Iot4ko2LWmBE-dUrdSCIv8F4toIXpSRjDrXJ8rW8Jbtnw-c3cJb86af4YK0YWhmN7XyUSxlazDs0Acxc4Ze9LDWgqV8driEuYfKtfCtG5LBVNKV-2vzA5yYkw3uOFdCsL6ByM8MwHkPqacnOewjQf7O-a1Mb5DShqJYpDYl6ebIqv3T~j69dD8WcMLpErc46sbBr~bWONcL7qtdaZGQbDsDhPaW~SNx5kEHPIoorAh~wKpIPBbLQMO~wKVJrq~T~S8Ozj-ig__&Key-Pair-Id=APKAIE5G5CRDK6RD3PGA)
