Friend of GATA-1 (FOG-1) is a binding partner of GATA-1, a zinc finger transcription factor with crucial roles in erythroid, megakaryocytic, and mast-cell differentiation. FOG-1 is indispensable for the function of GATA-1 during erythro/megakaryopoiesis, but FOG-1 is not expressed in mast cells. Here, we analyzed the role of FOG-1 in mast-cell differentiation using a combined experimental system with conditional gene expression and in vitro hematopoietic induction of mouse embryonic stem cells. Expression of FOG-1 during the progenitor period inhibited the differentiation of mast cells and enhanced the differentiation of neutrophils. Analysis using a mutant of PU.1, a transcription factor that positively or negatively cooperates with GATA-1, revealed that this lineage skewing was caused by disrupted binding between GATA-1 and PU.1, which is a prerequisite for mast-cell differentiation. However, FOG-1 expression in mature mast cells brought approximately a reversible loss of the mast-cell phenotype. In contrast to the lineage skewing, the loss of the mast-cell phenotype was caused by down-regulation of MITF, a basic helix-loop-helix transcription factor required for mast-cell differentiation and maturation. These results indicate that FOG-1 inhibits mast-cell differentiation in a differentiation stage-dependent manner, and its effects are produced via different molecular mechanisms.
Introduction
In hematopoiesis, more than 10 lineages of mature blood cells are derived from a single hematopoietic stem cell.1 This process is tightly regulated by extrinsic environmental cues and an intrinsic genetic program. Multipotent hematopoietic cells gradually lose their differentiation ability, giving rise to lineage-restricted hematopoietic progenitors. Once matured, each type of blood cell expresses a set of lineage-specific genes that supports its physiologic functions. Several lineage-specific transcription factors have been identified that control lineage-specific gene expression, and recent studies have demonstrated that these transcription factors cooperate with other transcription factors and cofactors. Moreover, these lineage-specific transcription factors display a variety of biologic functions in a cellular context-dependent manner.
The GATA family is the most extensively studied group of hematopoietic transcription factors. All GATA factors recognize a specific DNA sequence known as a GATA box [(A/T)GATA(A/G)]2 using the C-finger domain in one of their 2 zinc fingers (N- and C-fingers). GATA-1, a founding member of the GATA family, is highly expressed in erythroid cells, megakaryocytes, mast cells, and eosinophils.3,4 Gene targeting analyses have shown that GATA-1 is essential for terminal differentiation in erythropoiesis and megakaryopoiesis.5,,–8 Deletion of the upstream regulatory elements in GATA-1 gene leads to reduced GATA-1 expression (GATA-1low),9 indicating that the gene plays a pivotal role in mast-cell differentiation. In GATA-1low mice, morphologically abnormal mast cells were observed in the connective tissue and peritoneal lavage. Another GATA family member, GATA-2, also participates in mast-cell development.10
Yeast 2-hybrid screening revealed that friend of GATA-1 (FOG-1) binds the N-finger of GATA-1.11 FOG-1 is highly expressed in erythroid and megakaryocytic cells but not in mast cells.11 Gene targeting analysis revealed that FOG-1 is required for erythroid and megakaryocyte development and that it is essential for the physiologic function of GATA-1 in those lineages.12,–14 FOG-1 has complex effects on gene expression, because it functions as both a coactivator and a corepressor of GATA-1 and GATA-2. For example, activation of the megakaryocyte-specific αIIb gene by GATA-1 is enhanced by FOG-1; however, the GATA-1/FOG-1 complex represses GATA-2 expression in erythroid cells.15,–17
The lack of FOG-1 expression in mast cells suggests that it may inhibit mast cell-specific gene expression and mast-cell differentiation. To examine the effects of FOG-1 expression during mast-cell differentiation, we used in vitro hematopoietic differentiation of mouse embryonic stem (ES) cells. During coculture of ES cells with OP9 stroma cells (OP9 system), the interleukin-3 (IL-3) preferentially induces mast-cell differentiation. The OP9 system, in combination with a conditional gene expression system based on tetracycline (TET; OP9-TET system), is a powerful tool for analyzing gene function during hematopoiesis.18,,,–22 We previously established ES cell lines conditionally expressing exogenous FOG-1 and analyzed FOG-1 function during erythroid and megakaryocytic differentiation.20 FOG-1 suppressed the proliferation of erythroid and early megakaryocytic cells but it enhanced the proliferation of megakaryocytic cells at later stages of development. In other words, FOG-1 functioned in a cell context–dependent manner during erythroid and megakaryocytic differentiation.
In this study, we found that FOG-1 expression inhibited mast-cell differentiation in a stage-dependent manner via different molecular mechanisms. FOG-1 inhibited the differentiation of mast cells when expressed during the progenitor stage, instead favoring the development of neutrophils. In contrast, FOG-1 expression in mature mast cells resulted in reduced numbers of cytoplasmic granules and a loss of mast cell–specific gene expression. Thus, our findings show that FOG-1 inhibits mast cell differentiation in a cell context–dependent manner.
Methods
Cell culture
E14tg2a ES cells and their derivatives were used in this study. The TET-regulated FOG-1 ES cells (TET-FOG-1 ES cells) used in this study have been described previously.20 OP9 stroma cells, the retrovirus-producing packaging cell line Plat-E (a kind gift from Dr T. Kitamura, Tokyo University, Tokyo, Japan) and 293T cells were maintained as described previously.21,23 ES cells were transferred onto OP9 stroma cells in 6-well plates at a density of 104 cells/well. The induced cells were trypsinized on day 5, and 105 cells were seeded onto fresh OP9 cells. IL-3 produced by the X63 melanoma cell line, which expresses murine IL-3 (a gift from Dr H. Karasuyama, Tokyo Metropolitan University, Tokyo, Japan) was added from day 5 to induce mast-cell differentiation. On day 14, the mature mast cells were transferred to a suspension culture and maintained in IL-3 and stem cell factor (SCF; a kind gift from Amgen, Thousand Oaks, CA).
Flow cytometer
The primary antibodies used were biotin-GR-1, biotin-MAC-1 (BD Biosciences, Franklin Lakes, NJ), PE/Cy7-c-KIT (BD Biosciences), and PE-CD71 (eBioscience, San Diego, CA). The biotinylated antibodies were visualized with phycoerythrin/Cy5-conjugated streptavidin (BD Biosciences) using a procedure described previously.21 Cell sorting and analysis were performed using FACSCalibur and FACSAria flow cytometer (BD Biosciences).
Morphologic analysis
The cells were cytocentrifuged (approximately 5 × 10⁴ cells/slide) at 600 rpm (45g) for 4 minutes with a Cytospin 4 (Thermo Fisher Scientific, Runcorn, Cheshire, United Kingdom) and then stained with May-Grünwald solution followed by Giemsa solution (Nacalai Tesque, Kyoto, Japan). Images were obtained using an Olympus Provis microscope with a UPlan APO 40×/0.85 numeric aperture objective lens, an Olympus DP70 camera, and DC controller software (all from Olympus, Tokyo, Japan) at room temperature in air. The images were processed using Adobe Photoshop (Adobe Systems, Mountain View, CA).
Colony-forming assay
The hematopoietic cells present after 8 days of differentiation in the presence of IL-3 were recovered by thorough pipetting. The floating cells were collected and transferred to methylcellulose culture medium (Methocult M3232; Stem Cell Technology, Vancouver, BC, Canada) containing IL-3. After 7 days, individual colonies were selected, cytocentrifuged and inspected for the presence of each lineage of hematopoietic cells.
Plasmids
Mutant PU.1 (PU.1ΔC) was constructed by amplifying the PU.1 N-terminal region (from the translation initiation site [ + 1] to + 513) from pBS-PU.1. pBS-PU.1, which contains full-length murine PU.1 cDNA, was a kind gift from Dr T. Oikawa (Sasaki Institute, Tokyo, Japan). The primers used were (5′-GTC GAC GGG TTA CAG GCG TGC AAA ATG-3′) and antisense (5′-TTA CTT TTT CTT GCT GCC TGT CTC-3′). The amplified PU.1 fragment was then sub-cloned into pGEM-T (Promega, Madison, WI), and its sequence was confirmed using an ABI PRISM 3100 Genetic Analyzer (Applied Biosystem, Foster City, CA). The PU.1ΔC fragment, excised by SalI-NotI, was subsequently introduced into the SalI-NotI sites of pME2-FLAG, a gift from Dr K. Ohishi (Osaka University, Osaka, Japan). The FLAG-PU.1ΔC fragment excised by EcoRI-NotI was introduced into the EcoRI-NotI sites of the retroviral vector pMY-IRES-EGFP, a gift from Dr T. Kitamura. The XhoI-BsrGI fragment, containing FLAG-PU.1ΔC excised from pMY-FLAG-PU.1ΔC-IRES-EGFP, was introduced into the XhoI-BsrGI sites of the lentiviral vector pLV-CAG-IRES-EGFP, a gift from Dr M. Ikawa (Osaka University, Osaka, Japan). The cDNAs encoding a dominant-negative version of microphthalmia-associated transcription factor (miMITF), which lacks one of 4 consecutive arginines in the basic domain and wild-type MITF were provided by Dr E. Morii (Osaka University, Osaka, Japan). pLV-IRES-EYFP was constructed by replacing EGFP with EYFP (from pEYFP, BD Biosciences). The miMITF and MITF cDNAs were inserted into pLV-IRES-EYFP to create pLV-miMITF-IRES-EYFP and pLV-MITF-IRES-EYFP, respectively.
Retrovirus and lentivirus infection
pMY-IRES-EGFP and pMY-FLAG-PU.1ΔC-IRES-EGFP were transfected into Plat-E cells using Lipofectamine 2000 (Invitrogen, Rockville, MD), as described previously.21 Lentivirus particles were produced by transient cotransfection of the lentiviral plasmids with pCMV-ΔR8.91 and pMD2G-VSV-G into 293T cells using Lipofectamine 2000. The retroviral and lentiviral infections were performed by centrifugal inoculation as described previously.21
RT-PCR analysis
Total RNA was recovered using the RNeasy Mini Kit (QIAGEN, Valencia, CA). cDNA synthesis was performed using the Thermoscript reverse transcription-polymerase chain reaction (RT-PCR) system (Invitrogen, Carlsbad, CA) with a random hexamer, as recommended by the manufacturer. The primers and conditions used to amplify GATA-1, FOG-1, PU.1, c-KIT, Fcε receptor β chain (FcεRβ), mouse mast cell proteases, MMCP-1 (p1), -4 (p4), -5 (p5), -6 (p6), granzyme B (granB), carboxypeptidase A (cpa), tryptophan hydroxylase (tph), MITF, and glyceraldehyde dehydrogenase (gapdh) will be provided upon request.
Immunoprecipitation and Western blotting
Various combinations of the GATA-1, PU.1, and FOG-1 expression vectors were transfected into 293T cells using a calcium phosphate. The expression vectors for GATA-1 (pEF-GATA-1), PU.1 (pEF-PU.1), and FOG-1 (pMT2-FOG-1) were gifts from Dr M. Yamamoto (Tohoku University, Sendai, Japan), and Drs T. Oikawa and S.H. Orkin (Children's Hospital, Boston, MA). The cells were harvested 48 hours after transfection, and nuclear extracts were prepared. In brief, the cells were suspended in buffer A (10 mM HEPES-KOH, pH 7.9, 1.5 mM MgCl2, 10 mM KCl, 0.5 mM dithiothreitol [DTT], 0.1 mM ZnCl2, and Complete protease inhibitor cocktail [Roche, Basel, Switzerland])and centrifuged at 3000g for 10 minutes at 4°C. The pellets were then resuspended in buffer B (20 mM HEPES-KOH, pH 7.9, 25% glycerol, 420 mM NaCl, 1.5 mM MgCl2, 2 mM EDTA, 0.5 mM DTT, 0.1 mM ZnCl2, and Complete protease inhibitor cocktail) and incubated on ice for 20 minutes. After centrifugation at 5000g for 10 minutes at 4°C, the supernatants were collected. The nuclear extracts were precleared using Protein-G Sepharose (GE Healthcare, Chalfont St. Giles, Buckinghamshire, United Kingdom) for 120 minutes at 4°C, followed by incubation with rat anti–GATA-1 antibodies (N6; Santa Cruz, CA) overnight at 4°C. Immunoprecipitations were performed in immunoprecipitation (IP) buffer [150 mM NaCl, 0.1% Nonidet P40, 20 mM Tris-HCl, pH 7.5, 1 mM EDTA, 1 mM DTT, 0.1 mM ZnCl2, Complete] for 4 hours at 4°C using Protein-G Sepharose beads. The immunoprecipitants were then washed with IP buffer, and the bound materials were eluted by boiling in 1× Laemmli buffer. The proteins were resolved by 4% to 20% SDS-PAGE, and transferred onto polyvinylidene difluoride membranes (Immobilon; Millipore, Billerica, MA). The membranes were probed with antibodies to GATA-1 (N6), FOG-1 (M-20), and PU.1 (T-21), (all purchased from Santa Cruz Biotechnology, Santa Cruz, CA), or FLAG (M1; Sigma, St Louis, MO) followed by staining with HRP-conjugated anti-rat or anti-rabbit antibodies (Zymed, South San Francisco, CA). Antibody staining was visualized using the enhanced chemiluminescence (ECL) Detection Kit (GE Healthcare).
Reporter assay
The reporter TK-100-PU × 3-Luc carrying 3 synthetic ETS recognition sites (a gift from Dr T. Oikawa),24 and pRL-TK, carrying the Renilla reniformis luciferase gene, were cotransfected with various combinations of the PU.1, GATA-1, FOG-1, and/or PU.1ΔC expression vectors into CV-1 cells using a calcium phosphate.19 Cell lysates were prepared 48 hours after transfection, and reporter activity was measured using the Dual Luciferase Reporter Kit (Promega, Madison, WI). The transfection efficiencies were normalized by RL-TK activity.
Results
The effects of FOG-1 on mast-cell lineage determination
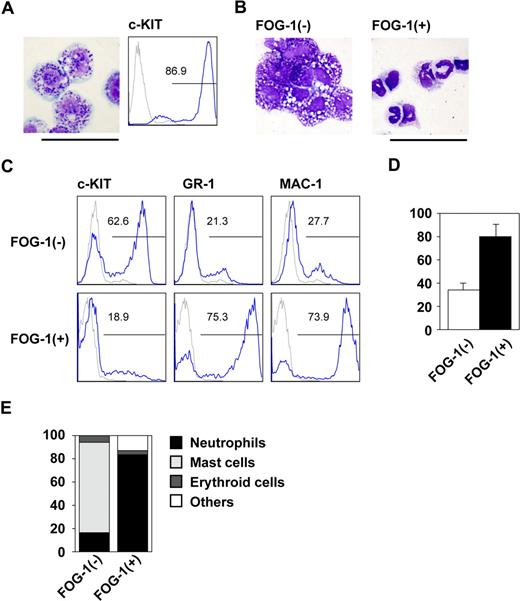
We first examined the biologic effects of FOG-1 on early mast-cell differentiation using an in vitro differentiation system in which mouse ES cells were cultured on OP9 cells in the presence of IL-3. On day 8, the hematopoietic cells had become immature myeloid progenitors; by day 14, more than 80% of the differentiated cells exhibited the basophilic granules characteristic of c-KIThigh mast-cells (Figure 1A). These cells efficiently released histamine upon crosslinking IgE receptors (Figure S1, available on the Blood website; see the Supplemental Materials link at the top of the online article), showing that the cells were functionally differentiated mast cells. In contrast, those cells in which FOG-1 was expressed beginning on day 8 by the withdrawal of tetracycline were quite different from the controls at day 14. More than 75% of the cells had the morphology of neutrophils, which express GR-1 and MAC-1 (Figure 1B,C). In addition, phagocytosis assay showed that the FOG-1 induced GR-1+ cells possessed phagocytotic activity (Figure S2). These data indicate that FOG-1 expression induced the neutrophils characterized by morphology, surface marker expression, and phagocytotic function. Because the total number of cells was increased more than 2 fold by FOG-1 (Figure 1D), the increased percentage was due to a rise in the number of neutrophils and a decrease in the number of mast cells.
Lineage switch after FOG-1 expression in progenitor cells. (A) Giemsa staining and FACS analysis on day 14 of E14tg2a ES cells in the presence of IL-3 since day 5. Antibody staining (blue line) and IgG control staining (gray line) were shown. (B) Giemsa staining of day 14 cells derived from TET-FOG-1 ES cells. Differentiation was induced in TET-FOG-1 ES cells without FOG-1 expression until day 8. IL-3 was added from day 5, and FOG-1 was induced on day 8. (C) FACS analysis of day 14-induced cells stained with anti-c-KIT, GR-1, and MAC-1 antibodies. The culture conditions were the same as in (B). (D) The total number of day 14 cells differentiated from TET-FOG-1 ES cells. Error bars represent SEM. (E) Percentage of each type of colony. The day 8 cells induced from TET-FOG-1 ES cells without FOG-1 expression were transferred to methylcellulose media containing IL-3, and FOG-1 expression was induced. Individual colonies were selected and analyzed after 7 days of culture. Bars represent 50 μm.
Lineage switch after FOG-1 expression in progenitor cells. (A) Giemsa staining and FACS analysis on day 14 of E14tg2a ES cells in the presence of IL-3 since day 5. Antibody staining (blue line) and IgG control staining (gray line) were shown. (B) Giemsa staining of day 14 cells derived from TET-FOG-1 ES cells. Differentiation was induced in TET-FOG-1 ES cells without FOG-1 expression until day 8. IL-3 was added from day 5, and FOG-1 was induced on day 8. (C) FACS analysis of day 14-induced cells stained with anti-c-KIT, GR-1, and MAC-1 antibodies. The culture conditions were the same as in (B). (D) The total number of day 14 cells differentiated from TET-FOG-1 ES cells. Error bars represent SEM. (E) Percentage of each type of colony. The day 8 cells induced from TET-FOG-1 ES cells without FOG-1 expression were transferred to methylcellulose media containing IL-3, and FOG-1 expression was induced. Individual colonies were selected and analyzed after 7 days of culture. Bars represent 50 μm.
The observed increase may be explained by enhanced proliferation of the neutrophil progenitors or by the preferential differentiation of neutrophils. We used methylcellulose colony assays to discriminate between these 2 possibilities. Cells were differentiated on day 8 with tetracycline and transferred to methylcellulose media containing IL-3 in the presence or absence of tetracycline. As shown in Figure 1E, FOG-1 drastically increased the percentage of neutrophil colonies. Because the total colony numbers were similar between the 2 groups (data not shown), the data indicate that FOG-1 induced the development of the mast cells into neutrophils at the progenitor level. Therefore, we conclude that FOG-1-induced differentiation of mast cells into neutrophils occurs when the gene is expressed during the progenitor phase. In particular, we found that expressing FOG-1 on day 10 induced neutrophilic differentiation (data not shown).
Lineage skewing by abrogation of the interaction between GATA and PU.1
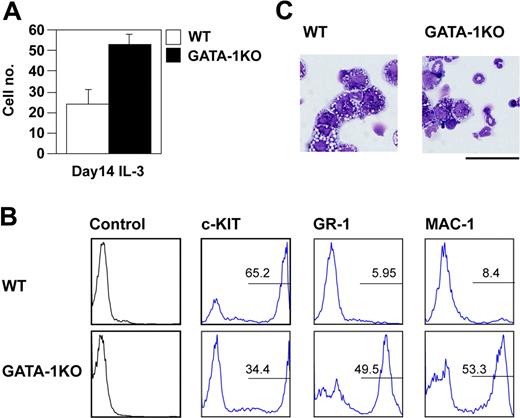
Because FOG-1 is a necessary cofactor of GATA-1 during erythropoiesis, we compared the proportions of mast cells and neutrophils produced from wild-type ES cells and GATA-1-null ES cells. Based on our cell count and fluorescence-activated cell sorting (FACS) data (Figure 2A,B), the GATA-1-deficient ES cells were able to differentiate into mast cells; however, the loss of GATA-1 caused an increase in the number of neutrophils (Figure 2C), similar to the results of FOG-1 overexpression. This suggests that FOG-1 overexpression inhibited function of GATA-1 critical for the differentiation of mast cells or neutrophils.
Preferential differentiation of GATA-1-null ES cells into neutrophils. (A) Total number of day 14-induced cells from E14tg2a and GATA-1-null ES cells exposed to IL-3 since day 8. Error bars represent SEM. (B) FACS analysis of day 14-induced cells. The cells were stained with anti-c-KIT, GR-1, and MAC-1 antibodies. Antibody staining and IgG control staining were shown. (C) Giemsa staining of the day 14-induced cells. Bar represents 50 μm.
Preferential differentiation of GATA-1-null ES cells into neutrophils. (A) Total number of day 14-induced cells from E14tg2a and GATA-1-null ES cells exposed to IL-3 since day 8. Error bars represent SEM. (B) FACS analysis of day 14-induced cells. The cells were stained with anti-c-KIT, GR-1, and MAC-1 antibodies. Antibody staining and IgG control staining were shown. (C) Giemsa staining of the day 14-induced cells. Bar represents 50 μm.
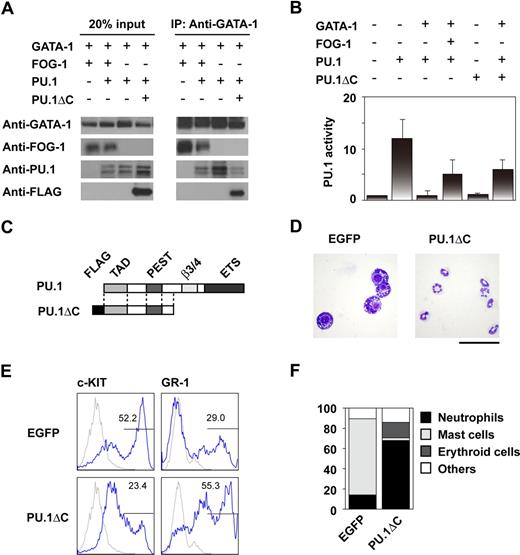
GATA-1 and GATA-2 function cooperatively with PU.1 during mast-cell development.25,26 We hypothesized that FOG-1 alters the physical interaction between the GATA factors and PU.1, thereby affecting differentiation. Thus, GATA-1, PU.1, and FOG-1 were expressed together in 293T cells, and the effect of FOG-1 on GATA-1 and PU.1 complex formation was analyzed. As shown in Figure 3A, complex formation was disrupted by FOG-1. We next analyzed whether FOG-1 relieves the inhibitory effect of GATA-1 on PU.1. As shown in Figure 3B, GATA-1-induced inactivation of PU.1 was reversed by FOG-1.
Inhibition of the interaction between GATA-1 and PU.1 by FOG-1 and PU.1ΔC. (A) Immunoprecipitation assays. 293T cells were cotransfected with various combinations of GATA-1, FOG-1, PU.1, and PU.1ΔC as shown. Immunoprecipitation was carried out using anti-GATA-1 antibodies. (B) Reporter assays using TK-100-PU× 3-Luc, which contains 3 synthetic ETS recognition sites. CV-1 cells were cotransfected with various combinations of GATA-1, FOG-1, PU.1, and PU.1ΔC as shown and with the PU.1-responsible reporter construct and the RL-TK control reporter. The relative activities, normalized by RL-TK activity, are shown. Error bars represent SEM. (C) Structure of PU.1 and PU.1ΔC. (D) May-Giemsa staining of day 14-induced cells infected with MY-IRES-EGFP (EGFP) and MY-PU.1ΔC-IRES-EGFP (PU.1ΔC) on day 8. The EGFP+ cells were sorted. Bar represents 50 μm. (E) FACS analysis of day 14-induced EGFP+ cells stained with anti-c-KIT and GR-1 antibodies. Antibody staining (blue line) and IgG control staining (gray line) were shown. (F) Percentage of each type of colony. Day-8 induced cells were infected with MY-IRES-EGFP and MY-PU.1ΔC-IRES-EGFP, and the EGFP+ cells were sorted on day 10. The sorted cells were transferred to methylcellulose media containing IL-3. Single colonies were selected and analyzed after 7 days of culture.
Inhibition of the interaction between GATA-1 and PU.1 by FOG-1 and PU.1ΔC. (A) Immunoprecipitation assays. 293T cells were cotransfected with various combinations of GATA-1, FOG-1, PU.1, and PU.1ΔC as shown. Immunoprecipitation was carried out using anti-GATA-1 antibodies. (B) Reporter assays using TK-100-PU× 3-Luc, which contains 3 synthetic ETS recognition sites. CV-1 cells were cotransfected with various combinations of GATA-1, FOG-1, PU.1, and PU.1ΔC as shown and with the PU.1-responsible reporter construct and the RL-TK control reporter. The relative activities, normalized by RL-TK activity, are shown. Error bars represent SEM. (C) Structure of PU.1 and PU.1ΔC. (D) May-Giemsa staining of day 14-induced cells infected with MY-IRES-EGFP (EGFP) and MY-PU.1ΔC-IRES-EGFP (PU.1ΔC) on day 8. The EGFP+ cells were sorted. Bar represents 50 μm. (E) FACS analysis of day 14-induced EGFP+ cells stained with anti-c-KIT and GR-1 antibodies. Antibody staining (blue line) and IgG control staining (gray line) were shown. (F) Percentage of each type of colony. Day-8 induced cells were infected with MY-IRES-EGFP and MY-PU.1ΔC-IRES-EGFP, and the EGFP+ cells were sorted on day 10. The sorted cells were transferred to methylcellulose media containing IL-3. Single colonies were selected and analyzed after 7 days of culture.
Based on these data, we tested whether disrupting the association between PU.1 and the GATA factors by another method would result in a phenotype similar to that caused by FOG-1 overexpression. PU.1 contains an N-terminal transcriptional activation domain, through which it interacts with GATA proteins, a PEST domain, a β3/4 domain, and a C-terminal DNA-binding ETS domain.27,28 We thus designed PU.1ΔC, a C-terminal–truncated version of PU.1 (Figure 3C). We expected that PU.1ΔC would be unable to induce transcription since it lacked the ETS DNA binding domain, but that it would be able to bind to GATA factors. As expected, PU.1ΔC inhibited the interaction of GATA-1 with PU.1 (Figure 3A), and it relieved GATA-1-induced PU.1 inactivation similar to FOG-1 (Figure 3B). Meanwhile, PU.1ΔC alone did not induce expression of the reporter.
To analyze the biologic effects of PU.1ΔC, cells induced on day 8 were infected with PU.1ΔC-IRES-EGFP retroviral vector and IRES-EGFP. The EGFP+ cells were sorted, cultured in the presence of IL-3, and analyzed on day 14. Compared with the control cells, greater numbers of neutrophils were observed among those cells expressing PU.1ΔC (Figure 3D). As was the case for FOG-1 overexpression, the GR-1+ population increased and the c-KIThigh population significantly decreased (Figure 3E). Colony formation assays of the EGFP+ cells on day 10 confirmed that PU.1ΔC induced the switch from mast cells to neutrophils at the progenitor level (Figure 3F). These data indicate that PU.1ΔC has effects similar to those of FOG-1 when introduced at the progenitor stage.
The effects of FOG-1 on the phenotype of mature mast cells
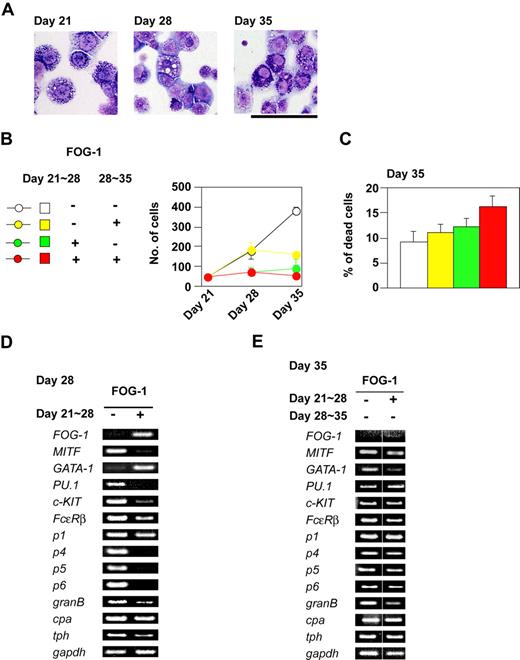
We next examined the effects of FOG-1 on fully differentiated mast cells, derived from TET-FOG-1 ES cells, in the presence of IL-3 and tetracycline. The cells were further expanded in a liquid culture containing IL-3, SCF, and tetracycline until day 21 (Figure 4A left panel). FOG-1 expression, which was induced between days 21 and 28, brought about a loss of basophilic granules (Figure 4A, middle panel). When FOG-1 expression was ceased at day 28 and the cells were further cultured for 7 days, the morphologically normal mast cells reappeared (Figure 4A right panel). It is unlikely that the reappearance of normal mast cells was due to expansion from a minor population of granule-containing mast cells remaining on day 21, because cell growth was not significantly reduced by FOG-1 expression (Figure 4B), and no significant cell death was induced (Figure 4C). It is plausible, therefore, that the loss of basophilic granules in the mast cells was reversible.
Inhibitory effects of FOG-1 expression on mature mast cells. (A) Giemsa staining of mast cells. Day 21 indicates mast cells differentiated without expression of FOG-1. Day 28 and Day 35 indicate mast cells in which FOG-1 was expressed between days 21 and 28, respectively. Bar represents 50 μm. (B) Total numbers of cells. The duration of FOG-1 expression is shown in the left panel. (C) The percentage of dead cells at day 35. The duration of FOG-1 expression is as shown in panel B. Error bars represent SEM. (D,E) RT-PCR analysis of transcription factors and mast cell–specific genes.
Inhibitory effects of FOG-1 expression on mature mast cells. (A) Giemsa staining of mast cells. Day 21 indicates mast cells differentiated without expression of FOG-1. Day 28 and Day 35 indicate mast cells in which FOG-1 was expressed between days 21 and 28, respectively. Bar represents 50 μm. (B) Total numbers of cells. The duration of FOG-1 expression is shown in the left panel. (C) The percentage of dead cells at day 35. The duration of FOG-1 expression is as shown in panel B. Error bars represent SEM. (D,E) RT-PCR analysis of transcription factors and mast cell–specific genes.
We used RT-PCR analysis to quantify the levels of transcription factor and mast cell–specific gene expression. FOG-1 reduced the mRNA expression of MITF, PU.1, c-KIT, Fcε receptor β chain (FcεRβ), mast cell protease 4 (p4), mast cell protease 5 (p5), mast cell protease 6 (p6), granzyme B (granB), and tryptophan hydroxylase (tph) (Figure 4D), whereas that of mast cell protease 1 (p1) and carboxypeptidase A (cpa) was not altered (Figure 4D). Consistent with our morphologic data, the changes in mRNA expression were reversed when FOG-1 was no longer expressed (Figure 4E).
Effects of MITF on the phenotype of mast cells
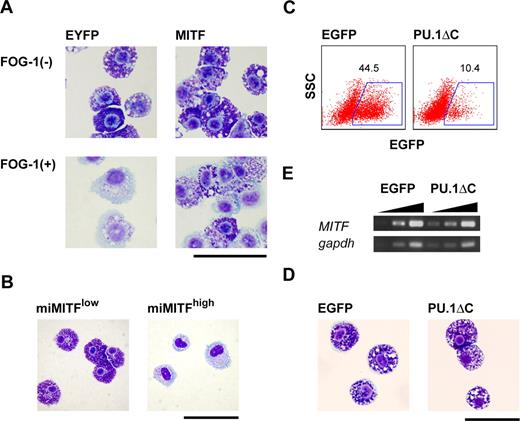
Because MITF is crucial for mast-cell differentiation, down-regulation of MITF could cause the loss of mast-cell characteristics induced by FOG-1. Considering this, we analyzed the effects of MITF and its dominant-negative form (miMITF) on mast-cell granules. As shown in Figure 5A, the loss of mast-cell granules by FOG-1 was rescued when MITF was coexpressed. To the contrary, miMITF induced the loss granules. Seven days after the introduction of miMITF into mature mast cells, the cells were sorted into 2 fractions, EYFPlow and EYFPhigh (ie, high and low levels of MITF, respectively). Cytoplasmic basophilic granules were not detected in the EYFPhigh mast cells (Figure 5B). To examine whether the rescue of FOG-1–mediated loss of granules by MITF was caused by direct functional antagonization and/or a direct interaction between FOG-1 and MITF, we carried out the following experiments. One is a reporter assay using MITF-responsible promoter for the analysis of functional antagonization. FOG-1 did not interfere with the MITF-driven transactivation (data not shown). The others are coimmunoprecipitation assay and yeast 2-hybrid assay for the direct association. However, no direct interaction was detected in the experiments (data not shown). These data suggest that the interference of MITF on FOG-1 function in this context is indirect.
Requirement of MITF for mast cell–specific granule formation and the inhibition of the GATA-1:PU.1 interaction in mast cells. (A) Giemsa staining of EYFP+ cells sorted 7 days after the infection of TET-FOG-1 mast cells with LV-CAG-IRES-EYFP (EYFP) and LV-CAG-MITF-IRES-EYFP (MITF). (B) Giemsa staining of LV-CAG-miMITF-IRES-EYFP-infected cells 7 days after infection. The miMITF-infected cells were sorted into 2 fractions, EYFPlow and EYFPhigh (C-E). FACS analysis, Giemsa staining, and RT-PCR analysis of mast cells infected with LV-CAG-IRES-EGFP and LV-CAG-PU.1ΔC-IRES.EGFP. The cells were infected on day 21 and the analysis was carried out on day 28. RT-PCR was performed using the sorted EGFP+ cells. Bars represent 50 μm.
Requirement of MITF for mast cell–specific granule formation and the inhibition of the GATA-1:PU.1 interaction in mast cells. (A) Giemsa staining of EYFP+ cells sorted 7 days after the infection of TET-FOG-1 mast cells with LV-CAG-IRES-EYFP (EYFP) and LV-CAG-MITF-IRES-EYFP (MITF). (B) Giemsa staining of LV-CAG-miMITF-IRES-EYFP-infected cells 7 days after infection. The miMITF-infected cells were sorted into 2 fractions, EYFPlow and EYFPhigh (C-E). FACS analysis, Giemsa staining, and RT-PCR analysis of mast cells infected with LV-CAG-IRES-EGFP and LV-CAG-PU.1ΔC-IRES.EGFP. The cells were infected on day 21 and the analysis was carried out on day 28. RT-PCR was performed using the sorted EGFP+ cells. Bars represent 50 μm.
Next, to exclude the possibility that the inhibitory effects of FOG-1 on mast cell-specific gene expression were due to the abrogation of the association between PU.1 and the GATA factors, we carried out PU.1ΔC transduction into mast cells. A lentiviral vector was used because the retrovirus infection was not feasible for the infection to mast cells in our hands (data not shown). As shown in Figure 5C,D, PU.1ΔC did not affect mast-cell morphology. It is noteworthy that unlike FOG-1, PU.1ΔC did not down-regulate MITF expression (Figure 5E). Taken together, we conclude that the loss of basophilic granules caused by FOG-1 was due to MITF down-regulation.
Discussion
In this study, we present the concept that the biologic function of FOG-1 depends on its cellular context. From immature progenitors to mast cells, FOG-1 preferentially induced neutrophilic differentiation. However, in mature mast cells, ectopic FOG-1 expression resulted in a reversible loss of mast-cell features. We further showed that the context-dependent functions of FOG-1 occur via distinct molecular mechanisms.
Lineage skewing to neutrophils caused by the disrupted association of GATA factors with PU.1
Overexpression of FOG-1 at the progenitor stage decreased mast-cell differentiation and increased neutrophilic differentiation. These data suggest that neutrophilic expansion is caused by an alteration in cell fate from the mast-cell lineage to the neutrophilic lineage or by enhanced neutrophilic proliferation. If FOG-1 induces extensive proliferation among neutrophilic progenitors and promotes mast cell death, the number of colonies should decrease, but the remaining colonies should contain a large number of neutrophils. However, the number of colonies was roughly comparable in the absence and presence of FOG-1 (data not shown), and we did not observe hyperproliferative neutrophilic colonies. Together, these data suggest that FOG-1 reprogrammed the fate of the cells from mast cells to neutrophils.
The next question involves the molecular mechanisms underlying the FOG-1–mediated lineage switch. In vitro differentiation using GATA-1–deficient ES cells showed that a loss of GATA-1 causes neutrophilic expansion (Figure 2). Thus, we entertained the idea that FOG-1 inhibited the function of GATA-1 by abrogating the interaction between GATA factors and PU.1. PU.1 was originally identified as a candidate oncogene for erythroleukemia,29 and it has been shown that PU.1 physically interacts with GATA-1 and GATA-2.30 Although PU.1 antagonizes GATA-1 in erythroid cells, cooperation between GATA-2 and PU.1 has been demonstrated during mast-cell differentiation.26 Thus, we hypothesized that the molecular and functional interactions between GATA-1 and PU.1 would be influenced by FOG-1 during mast-cell differentiation. Immunoprecipitation assays revealed that GATA-1 and PU.1 complex formation was disrupted by FOG-1.
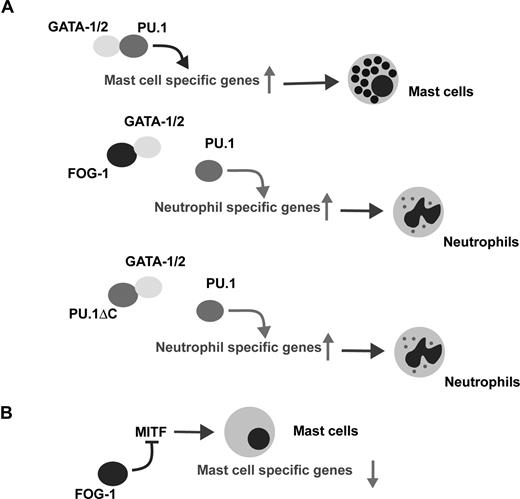
Meanwhile, during erythropoiesis, PU.1 blocks GATA-1–mediated erythroid maturation31 and it has been shown that PU.1 creates a repressive chromatin conformation by binding to GATA-1 on several erythroid-specific gene promoters.32 It is thus conceivable that FOG-1 relieves the PU.1-mediated suppression of GATA-1 during erythropoiesis. Likewise, the reduction in GATA factor/PU.1 binding by FOG-1 would inhibit mast-cell differentiation (Figure 6A). Our data using PU.1ΔC strongly support this idea.
Cell context-dependent function of FOG-1. (A) Schematic model of the lineage switch from mast-cells to neutrophils by FOG-1 and PU.1ΔC. (B) The down-regulation of mast cell specific gene expression by FOG-1 expression in mature mast cells.
Cell context-dependent function of FOG-1. (A) Schematic model of the lineage switch from mast-cells to neutrophils by FOG-1 and PU.1ΔC. (B) The down-regulation of mast cell specific gene expression by FOG-1 expression in mature mast cells.
The erythro/megakaryocytic and mast-cell lineages share several transcription factors, including GATA-1, GATA-2, and SCL. The expression patterns of these factors raise the question of whether mast cells should be categorized within the erythro/megakaryocyte compartment. Our data demonstrate that FOG-1 overexpression at the mast-cell progenitor stage favors the development of neutrophils. This suggests a similarity between mast cells and neutrophils. It is noteworthy that it has been shown that mast-cell progenitors are derived from granulocyte/monocyte progenitors (GMP) via bipotent basophil/mast cell progenitors (BMCP) and also that megakaryocyte/erythrocyte progenitors (MEP) do not differentiate into mast cells under the same conditions.33
However, in FOG-1-null and GATA-1low mice, unusual trilineage colonies containing erythroid, megakaryocytes, and mast-cells have been observed in vivo.9,14 This raises the possibility that mast cells and erythroid/megakaryocytic cells are derived from a common progenitor, but GATA-1-deficient proerythroblastic cells can be trans-differentiated into mast cells by IL-3 stimulation.34 Thus, the trilineage progenitors may stem from trans-differentiation of erythroid/megakaryocytic cells via a loss of complex formation between GATA-1 and FOG-1. Taken together, it is reasonable to consider that mast cells are close to the macrophage/neutrophil lineage under physiologic conditions, and a lack of GATA-1/FOG-1 complex formation produces changes in the erythroid-megakaryocytic compartment that enable mast-cell differentiation.
Loss of the mast cell phenotype by down-regulation of MITF
FOG-1 reduced mast cell–specific gene expression in mature mast cells (Figure 4D). Because this effect was reversible (Figure 4E), FOG-1 must inhibit transcriptional machinery that is continuously necessary for the trans-activation of mast cell–specific genes. GATA-1 and PU.1 synergistically activate several mast cell–specific promoters; however, the loss of mast-cell granules by FOG-1 was not caused by interruption of the complex between the GATA factors and PU.1 because the overexpression of PU.1ΔC did not influence the morphology of the mast cells.
MITF, a critical transcriptional regulator of mast-cell differentiation, was significantly down-regulated by FOG-1. MITF hypomorphic mutant (mi/mi) mice have reduced numbers of differentiated mast cells,35,36 whereas the mast cells present in the skin of mi/mi mice lack p4 and p5, but not cpa mRNA.37,38 Thus, MITF is critical for the development and differentiation of mast cells, as well as for the expression of lineage-specific genes responsible for their physiologic functions. When FOG-1 is expressed in mast cells, mRNA expression of p4 and p5 is reduced, whereas that of cpa is unaffected. The change in mRNA expression by FOG-1 was very similar to that in mi/mi mast cells and to that induced by miMITF expression in differentiated ES cell–derived mast cells in vitro (data not shown). Furthermore, the effects of FOG-1 on mast cells were reversed by the overexpression of wild-type MITF. Overall, the alterations in mast-cell phenotype caused by FOG-1 can be explained by the down-regulation of MITF, which is quite different from the molecular mechanism involved in lineage skewing (ie, reduced complex formation between the GATA factors and PU.1) (Figure 6). One role of FOG-1 in erythroid and megakaryocytic differentiation may be the inactivation of mast cell–specific gene expression through the repression of MITF.
Differential context dependent effects of FOG-1 during mast-cell differentiation
Our previous studies using an OP9 in vitro hematopoietic differentiation induction system revealed that the biologic functions of hematopoietic transcription factors and cofactors depend on the context of differentiation. By combining this system with a tetracycline-based gene-expression system in GATA-1–deficient ES cells, we found that the role of GATA-1 during erythropoiesis is differentiation stage–dependent.22 We also found 2 context-dependent functions of GATA-2 during cell differentiation.21 First the lineage-redirecting ability of GATA-2 is influenced by the timing of the GATA-2 expression, and second, GATA-2 and a fusion protein between GATA-2 and the estrogen receptor ligand binding domain have opposite effects on the proliferation of hematopoietic progenitors. These findings suggest that the context-dependent effects of GATA-2 and GATA-1 result from the particular proteins with which these factors interact.
The biologic function of FOG-1 during erythropoiesis and megakaryopoiesis also depends on the cell context. FOG-1 inhibited cellular proliferation in early immature megakaryocytes, but it enhanced cellular proliferation and disrupted cellular maturation in late megakaryocytic cells.20 Thus, transcription factors and cofactors can produce different biologic effects on lineage commitment, cell proliferation, and maturation in hematopoietic cells depending on the differentiation status of the cells. To clarify the role of hematopoietic transcription factors and cofactors during hematopoiesis, it will be necessary to analyze gain- and loss-of-function mutants in lineage- and stage-defined hematopoietic cells. In vitro hematopoietic differentiation in ES cells using the OP9 system will be a useful tool for understanding the context-dependent biologic functions of transcription factors and cofactors.
The online version of this article contains a data supplement.
The publication costs of this article were defrayed in part by page charge payment. Therefore, and solely to indicate this fact, this article is hereby marked “advertisement” in accordance with 18 USC section 1734.
Acknowledgments
We thank Drs T. Kitamura, K. Ohishi, T. Oikawa, H. Karasuyama, E. Morii, M. Yamamoto, M. Ikawa, S. H. Orkin, and Amgen (Thousand Oaks, CA) for providing materials. We also thank Ms A. Mizokami for her assistance.
This work was supported in part by Grants-in-Aid for Scientific Research from the Ministry of Education, Culture, Sports, Science and Technology (MEXT), and Osaka University 21st Century COE program “CICET,” Japan.
Authorship
Contribution: D.S., M.T., K.K., J.Z., and H.Y. performed research on both molecular and cell biology. T.M. and A.Y. carried out the analysis of histamine release. T.N. designed this research and wrote the manuscript.
Conflict-of-interest disclosure: The authors declare no competing financial interests.
Correspondence: Toru Nakano, Department of Stem Cell Pathology, Medical School, Osaka University, 2-2 Yamada-oka, Suita, Osaka 565-0871, Japan; e-mail: tnakano@patho.med.osaka-u.ac.jp.

This feature is available to Subscribers Only
Sign In or Create an Account Close Modal