Abstract
Many ion channels and transporters are regulated by ubiquitination mediated by the Nedd4 family of HECT-type ubiquitin ligases (E3s). These E3s commonly interact with substrates via their WW domains that bind to specific motifs in target proteins. However, not all potential targets of these E3s contain WW-binding motifs. Therefore, accessory proteins may mediate the interaction between Nedd4 family members and their targets. Here we report that the divalent metal ion transporter DMT1, the primary nonheme iron transporter in mammals, is regulated by ubiquitination mediated by the Nedd4 family member WWP2. DMT1 interacts with 2 WW domain-interacting proteins, Ndfip1 and Ndfip2, previously proposed to have roles in protein trafficking. This promotes DMT1 ubiquitination and degradation by WWP2. Consistent with these observations, Ndfip1−/− mice show increased DMT1 activity and a concomitant increase in hepatic iron deposition, indicating an essential function of Ndfip1 in iron homeostasis. This novel mechanism of regulating iron homeostasis suggests that Ndfips and WWP2 may contribute to diseases involving aberrant iron transport.
Introduction
Iron uptake and metabolism is a complex and highly regulated process that involves a number of enzymes and transport proteins.1,2 Iron homeostasis needs to be tightly controlled because iron deficiency results in anemia, whereas iron overload leads to the generation of reactive oxygen species (ROS), resulting in tissue damage and fibrosis caused by the increase in oxidative stress and protein aggregation.3,4 Iron-mediated injury plays an important role in the pathogenesis of a number of disorders, including genetic (or hereditary) hemochromatosis, nonhemochromatotic genetic iron overload, inflammatory syndrome, noncirrhotic chronic liver diseases, and certain blood disorders.5 The divalent metal ion transporter DMT1 plays a major role in both iron uptake into the body and iron release into the target cell.6 DMT1 is expressed at the apical membrane of duodenal enterocytes and in the endocytic compartment of peripheral tissues where it releases iron, internalized via the transferrin system, from the endosomes to the cytoplasm.7 There are 4 known isoforms resulting from alternative splicing at the C-terminus in combination with 2 alternative upstream promoter regulatory regions; the 5′ promoter exon 1A region and the IRE-containing terminal exon, which participate in tissue-specific iron regulation of DMT1 expression.8,9 A mutation in DMT1 (G185R) is responsible for hypochromic microcytic anemia in both the mk/mk mouse and Belgrade rat.10,11 Several mutations have also been discovered in humans, which give rise to microcytic anemia and liver iron overload.12-16 Iron-mediated transcriptional control of DMT1 is well established,17 and DMT1 is known to be trafficked throughout the cell via the endosomal pathway,18 but the mechanisms of the posttranslational regulation of DMT1 remain unclear.
Protein modification by ubiquitination plays an essential role in diverse cellular processes.19 The conjugation of ubiquitin to a protein substrate is a multistep process involving a ubiquitin-activating enzyme (E1), ubiquitin-conjugating enzymes (E2), and ubiquitin-protein ligases (E3), with E3s playing a major role in defining the substrate specificity of the ubiquitin system.20 The Nedd4 family of WW-HECT-type E3s is known to regulate a number of ion channels and receptors.21-23 A well-characterized example of this is the regulation of the epithelial sodium channel (ENaC) by Nedd4-2.24 In response to various signals, Nedd4-2 ubiquitinates and regulates ENaC endocytosis, thereby controlling the cell surface expression of the channel.24 The Nedd4 E3s bind their cognate substrates directly via their WW domains, which in most cases interact with the proline-rich PPxY (PY) motifs in the target proteins.25 However, they may also ubiquitinate substrates that lack PY motifs through accessory proteins.23 Two such proteins, Ndfip1 (N4WBP5) and Ndfip2 (N4WBP5A), were initially identified as Nedd4 WW domain-binding proteins.26-28 Both Ndfip1 and Ndfip2 are ubiquitously expressed and contain 2 PY motifs, which interact with several Nedd4 family E3s, and 3 transmembrane domains.27,28 In Saccharomyces cerevisiae, the Ndfip-like protein Bsd2p negatively regulates Smf1p, a metal ion transporter similar to DMT1.29,30 Bsd2p recruits Rsp5, the Nedd4 homolog in S cerevisiae, to promote Smf1p ubiquitination and trafficking to the vacuole for degradation.29,30
In this report, we tested the possibility that mammalian Ndfip1 and/or Ndfip2 regulate DMT1 function, and thus iron homeostasis, via ubiquitination. We show that Ndfip1 and Ndfip2 indeed interact with and regulate DMT1. Furthermore, we identify the Nedd4 family member WWP2 as the E3 that mediates ubiquitination and degradation of DMT1. We also demonstrate that the loss of Ndfip1 in gene knockout mice leads to increased DMT1 activity and iron accumulation.
Methods
Expression plasmids
Construction of FLAG-tagged pcDNA3-based expression constructs harboring wild-type and double PY mutant versions of Ndfip1 (N4WBP5) and Ndfip2 (N4WBP5A), Nedd4 and Nedd4-2 have been previously described.27,28,31 Wild-type WWP2 with an N-terminal FLAG tag was generated by polymerase chain reaction and inserted into the EcoRI/NotI sites of pcDNA3. A catalytically inactive cysteine mutant (C838S) was generated by site-directed mutagenesis. pFLAG-CMV2-Itch was provided by Dr A. Angers (University of Montreal, Montreal, QC). pcDNA3-Smurf1-FLAG was provided by Dr T. Imamura (Tokyo University, Tokyo, Japan). pCMV5B-Smurf2-FLAG was provided by Dr J. Wrana (University of Toronto, Toronto, ON). pcDEF3-WWP1-FLAG was provided by Dr A. Komuro (Tokyo University). pMT123-ubiquitin-HA was provided by Dr D. Bohmann (University of Rochester, Rochester, NY). siRNA oligos designed to knock down Ndfip1 and Ndfip2 were custom designed and purchased from Invitrogen (Carlsbad, CA) and Qiagen (Valencia, CA) (Table S1, available on the Blood website; see the Supplemental Materials link at the top of the online article).
Antibodies
Sources of commercial antibodies were as follows: FLAG M2 and Rab7 (Sigma-Aldrich, St Louis, MO), HA and c-myc clone 9E10 (Roche Diagnostics, Indianapolis, IN), AIP2 (Santa Cruz Biotechnology, Santa Cruz, CA), goat anti-myc (Abcam, Cambridge, MA), SLC11A2 (DMT1) clone 4C6 (Abnova), γ-adaptin, GM130, LAMP1, Rab5, and Rab11 (BD Biosciences PharMingen, San Diego, CA), mouse Alexa Fluor (AF) 488, rat-AF488, rabbit-AF568, goat-AF568, and goat-AF647 (Invitrogen), mouse-AP, rabbit-AP, and rat-AP (Chemicon International, Temecula, CA), rabbit-Cy5, and mouse-Cy5 (GE Healthcare, Little Chalfont, United Kingdom). The production of Ndfip1 and Ndfip2 antibodies has been previously described.27,32
Animals
Generation and characterization of Ndfip1−/− mice have been described previously.33 Animals were maintained and handled according to practices approved by the Institute of Medical and Veterinary Science animal ethics committee, and all experiments were carried out following strict guidelines provided by the local and national regulatory bodies. Animals were fed ad libitum on a standard diet containing 164 mg/kg iron (Ridley AgriProducts, Melbourne, Australia). At 6 weeks of age, animals were killed by cervical dislocation or CO2 asphyxiation, and tissues were collected and either snap-frozen for use in immunoblotting or fixed in Histochoice fixative (ProSciTech, Kirwan, Australia) and embedded in optimal cutting temperature compound (OCT) for histologic use. Blood samples were collected via cardiac puncture at time of death.
Hepatocyte isolation
Wild-type and Ndfip1−/− animals (1-7 days old) were killed by cervical dislocation, and livers were extracted and washed several times in ice-cold phosphate-buffered saline (PBS) followed by several washes in perfusion buffer A (120 mM NaCl, 24 mM NaHCO3, 0.36% glucose, 5 mM N-2-hydroxyethylpiperazine-N′-2-ethanesulfonic acid (HEPES), pH 7.5, 50 mM KCl, 12 mM MgSO4, 12 mM KH2PO4, 0.1 mM ethyleneglycoltetraacetic acid). Livers were cut into several pieces to disperse cells and then suspended in perfusion buffer B (120 mM NaCl, 24 mM NaHCO3, 0.36% glucose, 5 mM HEPES, pH 7.5, 50 mM KCl, 12 mM MgSO4, 12 mM KH2PO4, 4 mM CaCl2) and digested with collagenase type IV (333 U/mL; Sigma-Aldrich) for 30 minutes at 37°C. Cells were filtered through a 40-μm cell strainer and washed twice in cold culture medium (Dulbecco modified Eagle medium [DMEM], 10% fetal calf serum, 1% penicillin/streptomycin) by centrifugation at 50g for 5 minutes at 4°C followed by resuspension in 20 mL cold media. Cells were seeded at density 2 × 10⁵/mLonto collagen-coated dishes and grown at 37°C with 5% CO2.
Blood analysis
Hemoglobin was measured in whole blood using Drabkin reagent (Sigma-Aldrich). Hematocrit was measured using a hematocrit tube reader (Hawksley, Lancing, United Kingdom) with 75 mm heparinized micro-hematocrit capillary tubes (ProSciTech). Serum was collected by centrifugation of blood samples twice, at 2000g for 3 minutes, and analyzed for total serum iron and transferrin saturation using the Ferene method (Thermo Electron, Waltham, MA), and serum transferrin was measured using a mouse transferrin enzyme-linked immunosorbent assay kit (Alpha Diagnostics, San Antonio, TX) according to the manufacturer's instructions. Serum ferritin was measured using a serum immuno-turbidimetric ferritin OSR6 × 50 assay and read on an Olympus AU400 analyser (Olympus, Tokyo, Japan). Mean corpuscular volume, red blood cell counts (RBCs), and reticulocyte counts were measured using an automated cell counter.
Cell culture and transfection
CHO cells stably transfected with myc-tagged DMT1 isoform II (−IRE) were kindly provided by Dr P. Gros (McGill University, Montreal, QC) or CHO cells were transiently transfected with HA-tagged DMTI I (+ IRE). Cells were grown in DMEM supplemented with 10% fetal calf serum and 1% penicillin/streptomycin at 37°C with 5% CO2. Transfection of plasmids was performed using FuGENE6 (Roche Diagnostics) and siRNA oligos were transfected using HiPerFect (Qiagen), both according to manufacturer's instructions.
Immunoprecipitation and immunoblotting
Where indicated, cells were treated before lysis with 50 μM MG132 (Boston Biomedical, Boston, MA) and 400 μM chloroquine (Sigma-Aldrich). Immunoprecipitations were performed as previously described.22 Briefly, cells were lysed in buffer described22 for 30 minutes before centrifugation at 13 000g for 5 minutes to remove cell debris. The supernatant was retained, and 30-μL protein G Sepharose beads (GE Healthcare) were added along with 1 to 5 μg/mL antibody. After overnight incubation, beads were washed in lysis buffer followed by washing with phosphate-buffered saline to remove unbound proteins. Beads were then boiled for 5 minutes in Laemmli buffer to release bound proteins, and immunoprecipitated proteins were separated through 10% sodium dodecyl sulfate–polyacrylamide gel electrophoresis. Protein was transferred to polyvinylidene difluoride membrane for immunoblotting with primary antibody diluted in PBS-Tween 20, overnight at 4°C, followed by incubation with an alkaline phosphatase or Cy5-conjugated secondary antibody. Signals were detected directly on a Typhoon 9410 Variable Mode Imager (GE Healthcare) and Image Quant software (GE Healthcare).
Confocal immunofluorescence microscopy
At 24 hours after transfection, cells were fixed in 4% paraformaldehyde for 15 minutes at room temperature and permeabilized in 0.2% Triton X-100/PBS for 2 minutes. Primary and secondary antibodies were diluted in 5% skim milk in PBS to 2 μg/mL. Confocal images were captured using a Bio-Rad Radiance 2100 confocal microscope (Bio-Rad, Hercules, CA) equipped with 3 lasers: Argon ion 488 nm (14 mW), Green HeNe 543 nm (1.5 mW), and Red Diode 637 nm (5 mW), and an Olympus IX70 inverted microscope. The images were taken at 2× zoom, and the objective used was a 60× UPLAPO with NA = 1.2 water. The dual- and triple-labeled cells were imaged with 2/3 separate channels (PMT tubes) in a sequential setting. Green fluorescence was excited with an Ar 488-nm laser line and the emission viewed through a HQ515/30-nm narrow band barrier filter in PMT1. Red fluorescence was excited with a HeNe 543-nm laser line and the emission viewed through a long pass barrier filter (E570LP) in PMT2. When used far-red fluorescence was excited with the RD 637 nm laser line and the emission viewed through a long pass barrier filter (660LP). Automatically, all signals from PMTs 1 and 2 (and 3 where used) were merged, and separate images for each channel were also retained. Image analysis was performed with Confocal Assistant software for Microsoft Windows (Todd Clark Brelje, Minneapolis, MN) and LaserPix V4 (Bio-Rad) software.
Fluorescence quenching assay
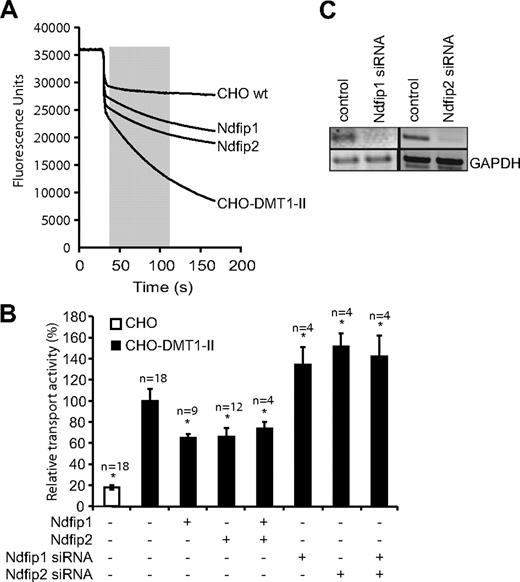
DMT1 transport activity assay was modified from Lam-Yuk-Tseung et al.34 Cells were loaded with 0.25 μM calcein-AM (Invitrogen) for 20 minutes at 37°C in loading medium (DMEM supplemented with 20 mM HEPES). Cells were washed and resuspended in transport buffer (150 mM NaCl, 20 mM of MES); 2 × 10⁵ cells were transferred to a 96-well flat-bottom transparent plate (Nalge Nunc International, Rochester, NY) in triplicate, and fluorescence was recorded using a BMG FLUOStar microplate reader (excitation 485 nm, emission 520 nm). Readings were taken every 2 seconds for the first 20 seconds to achieve a baseline reading, then every 0.5 second after injection of CoCl2 (final concentration, 100 μM; pH 6.7) for 150 seconds. CoCl2 was used in this assay because it is more stable than iron and less susceptible to oxidation, and it is known to be transported in a similar manner to iron.34 Transport activity was calculated as the rate of fluorescence quenching (slope) observed in a 1-minute period after the injection of metal ions and is displayed relative to untransfected CHO-DMT1 cells or to wild-type hepatocytes (Figure 1A).
Ndfip1 and Ndfip2 inhibit DMT1 transport activity. (A) Representative traces obtained in the fluorescence quenching assay used to determine DMT1 transport activity. A total of 100 μM CoCl2 (final concentration) was added to the cells (indicated by the arrow), and the rate of fluorescence quenching (slope of line in shaded area) was calculated as a measure of the activity of DMT1 at the plasma membrane. (B) The relative transport activity of DMT1 when Ndfip1 and Ndfip2 are ectopically expressed as measured using the fluorescence quenching assay as described in panel A. *Significant difference between transfected and control CHO-DMT1-II cells (P < .05). □ indicates CHO cells not expressing DMT1; ■, CHO-DMT1-II cells. Data are mean plus or minus SEM. (C) RT-PCR showing levels of Ndfip1 and Ndfip2 transcript after knockdown.
Ndfip1 and Ndfip2 inhibit DMT1 transport activity. (A) Representative traces obtained in the fluorescence quenching assay used to determine DMT1 transport activity. A total of 100 μM CoCl2 (final concentration) was added to the cells (indicated by the arrow), and the rate of fluorescence quenching (slope of line in shaded area) was calculated as a measure of the activity of DMT1 at the plasma membrane. (B) The relative transport activity of DMT1 when Ndfip1 and Ndfip2 are ectopically expressed as measured using the fluorescence quenching assay as described in panel A. *Significant difference between transfected and control CHO-DMT1-II cells (P < .05). □ indicates CHO cells not expressing DMT1; ■, CHO-DMT1-II cells. Data are mean plus or minus SEM. (C) RT-PCR showing levels of Ndfip1 and Ndfip2 transcript after knockdown.
Histology and tissue iron measurements
Histochoice-fixed, OCT-embedded frozen liver and duodenum sections (from 6-week-old animals) were stained using Perl Prussian blue staining with diaminobenzidine intensification (in the presence of nickel) as described previously.35 Sections were counterstained using 2% neutral red. Iron measurements were carried out on acid-digested fixed liver tissue36 using inductively coupled plasma-mass spectrometry.
Statistical analysis
Unpaired t tests assuming equal variance were used to determine statistical significance between the relative transport activities of the treatment groups, with statistical significance determined as being P < .05.
Results
Ndfip1 and 2 inhibit DMT1 transport activity
Because Bsd2p inhibits the function of Smf1p, we tested whether overexpression of Ndfips will have a similar effect on DMT1 activity. The effect on DMT1 transport activity by mammalian Ndfip1 and Ndfip2 was initially tested using CHO cells stably expressing myc-tagged DMT1-II (CHO-DMT1-II cells)34 by transiently expressing Ndfip1 and Ndfip2 in these cells and assessing the transport activity of DMT1 using a fluorescence quenching assay (Figure 1A). Expression of Ndfip1 or Ndfip2 significantly decreased the transport activity of DMT1, and expression of both proteins together did not show any further reduction in DMT1 activity (Figure 1B). Conversely, a significant increase in transport activity was observed by siRNA-mediated knockdown of endogenous Ndfip1, Ndfip2, or both genes (Figure 1B,C). These results suggest that both Ndfip1 and Ndfip2 are involved in DMT1 regulation and that these proteins act independently of each other in this process.
Ndfip1 and 2 interact and colocalize with DMT1
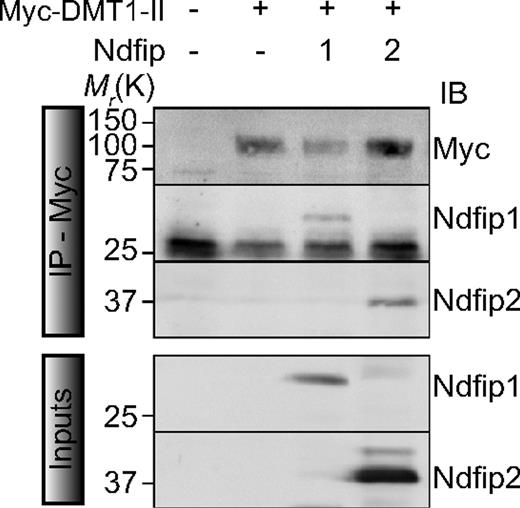
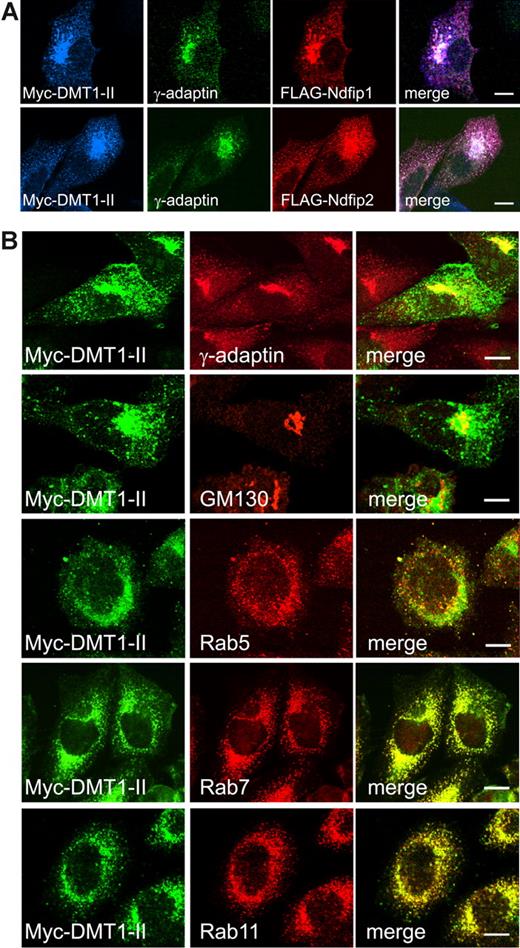
To further elucidate DMT1 regulation, we investigated the potential interaction between DMT1 and Ndfips. Using CHO-DMT1-II cells coexpressing Ndfips, DMT1-II coimmunoprecipitated with both Ndfip1 and Ndfip2, suggesting that both proteins can interact with DMT1-II (Figure 2). Furthermore, immunostaining and confocal microscopy indicated that both Ndfip1 and Ndfip2 partly colocalize with DMT1-II in discrete subcellular puncta in the perinuclear region (Figure 3A). Our previous work has shown that Ndfip1 and Ndfip2 are present predominantly in the Golgi and multivesicular bodies/late endosomes.27,28 Other recent studies have shown that DMT1 is primarily localized within the endosomal compartment, with the +IRE isoform predominantly found in the late endosomes, and the −IRE isoform found in recycling endosomes.18 Therefore, it is probable that the regulation of DMT1 by Ndfip1 and Ndfip2 occurs predominantly in the endosomal compartment. In addition, DMT1-II was found to partially colocalize with both Ndfip1 and Ndfip2 in γ-adaptin-positive vesicles, a protein associated with the sorting and trafficking of protein cargo to and from the trans-Golgi network37 (Figure 3A). Whereas only partial colocalization was observed with the Golgi-matrix marker GM130 and early endosomal marker Rab5, we observed colocalization between DMT1-II with both late and recycling endosomal markers Rab7 and Rab11 (Figure 3B). Similar analysis was performed on CHO cells transfected with DMT1-I (+ IRE) (Figure S1). We found that DMT1-I (+ IRE) isoform colocalized with γ-adaptin and Ndfip1 or Ndfip2, similar to the non-IRE isoform. We also observed colocalization with the early and recycling endosomal markers Rab5 and Rab11, respectively (Figure S1). Colocalization of DMT1 with Ndfips in the endosomal compartments suggests that Ndfips may play a role in the trafficking and regulation of the DMT1 protein.
Both Ndfip1 and Ndfip2 interact with DMT1. Coimmunoprecipitation of DMT1-II (anti-myc) with Ndfip1 or Ndfip2. Experiments were carried out as described in “Methods.”
Both Ndfip1 and Ndfip2 interact with DMT1. Coimmunoprecipitation of DMT1-II (anti-myc) with Ndfip1 or Ndfip2. Experiments were carried out as described in “Methods.”
Intracellular localization of DMT1. (A) Confocal microscopy shows that DMT1-II colocalizes with γ-adaptin (trans-Golgi network) and both Ndfip1 and Ndfip2. (B) DMT1-II only partly colocalizes with GM130 (cis-Golgi) and early endosomal marker Rab5. Colocalization is observed with late and recycling endosomal markers Rab7 and Rab11, respectively. Scale bars represent 10 μm.
Intracellular localization of DMT1. (A) Confocal microscopy shows that DMT1-II colocalizes with γ-adaptin (trans-Golgi network) and both Ndfip1 and Ndfip2. (B) DMT1-II only partly colocalizes with GM130 (cis-Golgi) and early endosomal marker Rab5. Colocalization is observed with late and recycling endosomal markers Rab7 and Rab11, respectively. Scale bars represent 10 μm.
WWP2 ubiquitinates DMT1 and inhibits its transport activity
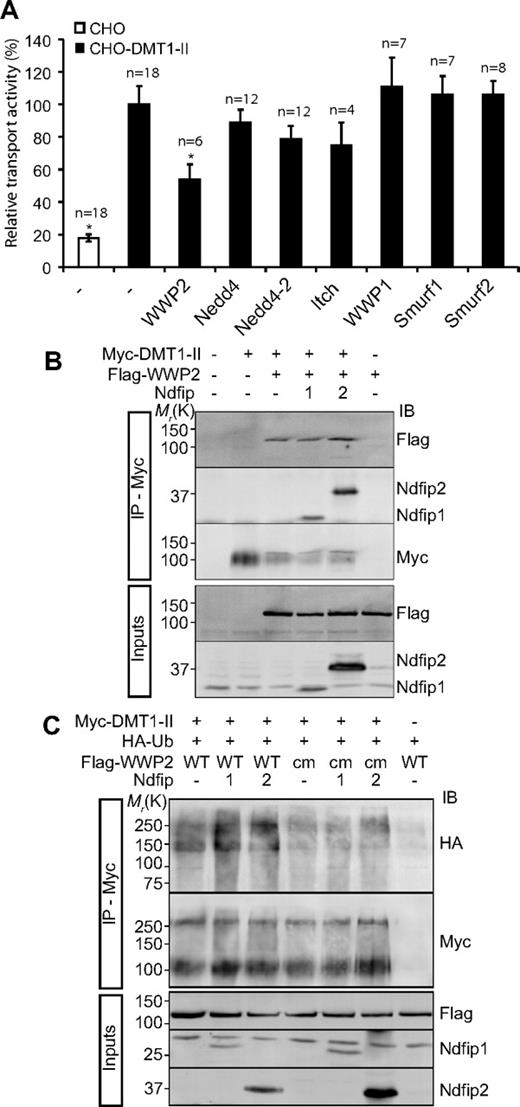
In S cerevisiae, Bsd2p interacts with Rsp5p, the only Nedd4-like protein, to recruit it to Smf1p.29,30 Among the mammalian Nedd4 family members, Nedd4 itself is most homologous to Rsp5p. Initial experiments showed that expression of Nedd4 or its close relative Nedd4-2 had limited effect on DMT1 transport activity (Figure 4A). Our previous studies have shown that both Ndfip1 and Ndfip2 interact with the WW domains of several Nedd4 family members.27,28 We therefore assessed whether E3s other than Nedd4 and Nedd4-2 could inhibit the transport activity of DMT1. Of the Nedd4 family members tested, only WWP2 showed a significant decrease in transport activity (Figure 4A). Although WWP2 is most closely related to Itch/AIP4 and WWP1, these proteins did not show any appreciable inhibition of DMT1 activity (Figure 4A). Immunoprecipitation experiments using CHO-DMT1-II cells coexpressing Ndfips and WWP2 indicated an interaction between WWP2 with Ndfip1 and with Ndfip2 (Figure 4B). However, some WWP2 was immunoprecipitated when expressed without Ndfips, suggesting that WWP2 may have some capacity to bind DMT1-II, perhaps via endogenous Ndfips.
WWP2 regulates DMT1 transport activity and ubiquitinates DMT1 in an Ndfip-dependent manner. (A) The relative transport activity of DMT1 in the presence of Nedd4 family members. *P < .05. □ indicates CHO wild-type cells; ■, CHO-DMT1-II-expressing cells. Data are mean plus or minus SEM. (B) Interaction of DMT1 with WWP2, Ndfip1, and Ndfip2. CHO-DMT1-II cells transfected as indicated were subjected to immunoprecipitation with α-myc followed by immunoblotting (IB) as indicated. (C) Ubiquitination of DMT1 by WWP2. CHO-DMT1-II cells were transfected with vector (−), WWP2 (wild-type and a catalytically inactive mutant, cm), Ndfip1, Ndfip2, and HA-tagged ubiquitin. DMT1-II was immunoprecipitated with α-myc followed by IB as indicated.
WWP2 regulates DMT1 transport activity and ubiquitinates DMT1 in an Ndfip-dependent manner. (A) The relative transport activity of DMT1 in the presence of Nedd4 family members. *P < .05. □ indicates CHO wild-type cells; ■, CHO-DMT1-II-expressing cells. Data are mean plus or minus SEM. (B) Interaction of DMT1 with WWP2, Ndfip1, and Ndfip2. CHO-DMT1-II cells transfected as indicated were subjected to immunoprecipitation with α-myc followed by immunoblotting (IB) as indicated. (C) Ubiquitination of DMT1 by WWP2. CHO-DMT1-II cells were transfected with vector (−), WWP2 (wild-type and a catalytically inactive mutant, cm), Ndfip1, Ndfip2, and HA-tagged ubiquitin. DMT1-II was immunoprecipitated with α-myc followed by IB as indicated.
To determine whether DMT1 is ubiquitinated by WWP2, CHO-DMT1-II cells were transfected with a combination of WWP2 (or a catalytically inactive mutant WWP2cm), Ndfip1, Ndfip2, and HA-tagged ubiquitin. WWP2 was able to ubiquitinate DMT1-II, and this was enhanced in the presence of Ndfip1 or Ndfip2, whereas WWP2cm was unable to ubiquitinate DMT1-II, even in the presence of Ndfip1 or Ndfip2 (Figure 4C), indicating a functional role for WWP2 ubiquitin ligase activity in the regulation of DMT1.
Ndfips facilitate WWP2-mediated inhibition of DMT1
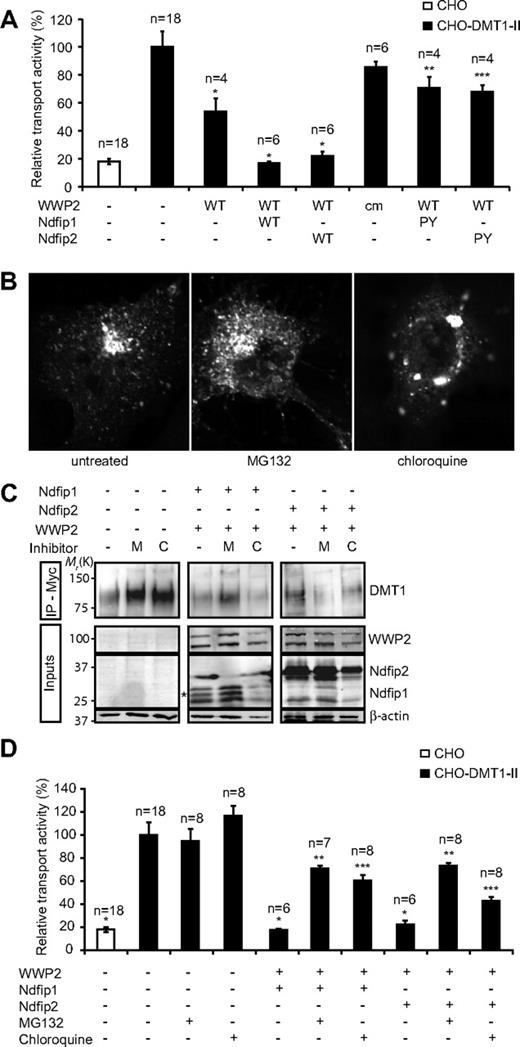
We then tested whether WWP2 has a physiologic role in the regulation of DMT1 transport activity. As also shown in Figure 4A, WWP2 alone can reduce the transport activity of DMT1 to approximately half of the control activity (Figure 5A). This reduction was significantly enhanced by expressing Ndfip1 or Ndfip2 (Figure 5A). WWP2 regulation of DMT1 transport activity requires its catalytic activity because no significant reduction in transport activity was observed when WWP2cm is expressed. Both Ndfip1 and Ndfip2 proteins contain 2 PPxY motifs that interact with the WW domains of Nedd4 family members. To investigate the significance of the interaction between Ndfips and WWP2, the double PY motif mutants of Ndfip1 and Ndfip2 (Ndfip1PY and Ndfip2PY) were used because both show a dramatic reduction in their interaction with the WW domains of Nedd4 family E3s.27,28 When CHO-DMT1-II cells coexpressed both WWP2 and either Ndfip1PY or Ndfip2PY, WWP2 was unable to reduce transport activity to the levels seen in the presence of wild-type Ndfips (Figure 5A). This suggests that the effect of WWP2 on DMT1 is dependent on its association with Ndfips via the PY motifs. Furthermore, overexpression of Ndfip1PY or Ndfip2PY reduces transport activity to the same level as that of wild-type Ndfip1 or Ndfip2 (Figure S2). Thus, whereas Ndfips can mediate a reduction of DMT1 activity independently, WWP2 is required for full abrogation of transport activity, and this depends on its catalytic activity and its association with Ndfip1 or Ndfip2.
DMT1 transport activity is decreased by WWP2 in an Ndfip-dependent manner that is reliant on the WW domain–PY motif interaction. (A) The relative transport activity of DMT1 in the presence of WWP2 (wild-type and catalytically inactive mutant, cm), Ndfip1 (wild-type and double PY mutant), and Ndfip2 (wild-type and double PY mutant) as indicated. *Significant difference between transfected and control CHO-DMT1-II cells (P < .05). **Significant increase (P < .05) from CHO-DMT1-II cells transfected with WWP2 and wild-type Ndfip1. ***Significant increase (P < .05) from CHO-DMT1-II cells transfected with WWP2 and wild-type Ndfip2. □ indicates CHO cells not expressing DMT1-II; ■, CHO-DMT1-II cells. Data are mean plus or minus SEM. (B) Immunofluorescence of Myc-DMT1 in untreated CHO-DMT1-II cells or after 4-hour incubation with MG132 (50 μM) or chloroquine (400 μM) as indicated. (C) Total levels of DMT1 in cells transfected with WWP2 and Ndfip1 or Ndfip2 and incubated for 8 hours with MG132 or chloroquine as indicated. DMT1 was immunoprecipitated using α-myc followed by immunoblotting. (D) The relative transport activity of DMT1 in the presence of WWP2 and Ndfip1 or Ndfip2 as indicated followed by incubation with MG132 or chloroquine for 8 hours as indicated. *Significant difference between transfected and control CHO-DMT1-II cells (P < .05). **Significant increase (P < .05) from CHO-DMT1-II cells transfected with WWP2 and Ndfip1 in the absence of inhibitors. ***Significant increase (P < .05) from CHO-DMT1-II cells transfected with WWP2 and Ndfip2 in the absence of inhibitors. □ indicates CHO cells not expressing DMT1-II; ■, CHO-DMT1-II cells. Data are mean plus or minus SEM.
DMT1 transport activity is decreased by WWP2 in an Ndfip-dependent manner that is reliant on the WW domain–PY motif interaction. (A) The relative transport activity of DMT1 in the presence of WWP2 (wild-type and catalytically inactive mutant, cm), Ndfip1 (wild-type and double PY mutant), and Ndfip2 (wild-type and double PY mutant) as indicated. *Significant difference between transfected and control CHO-DMT1-II cells (P < .05). **Significant increase (P < .05) from CHO-DMT1-II cells transfected with WWP2 and wild-type Ndfip1. ***Significant increase (P < .05) from CHO-DMT1-II cells transfected with WWP2 and wild-type Ndfip2. □ indicates CHO cells not expressing DMT1-II; ■, CHO-DMT1-II cells. Data are mean plus or minus SEM. (B) Immunofluorescence of Myc-DMT1 in untreated CHO-DMT1-II cells or after 4-hour incubation with MG132 (50 μM) or chloroquine (400 μM) as indicated. (C) Total levels of DMT1 in cells transfected with WWP2 and Ndfip1 or Ndfip2 and incubated for 8 hours with MG132 or chloroquine as indicated. DMT1 was immunoprecipitated using α-myc followed by immunoblotting. (D) The relative transport activity of DMT1 in the presence of WWP2 and Ndfip1 or Ndfip2 as indicated followed by incubation with MG132 or chloroquine for 8 hours as indicated. *Significant difference between transfected and control CHO-DMT1-II cells (P < .05). **Significant increase (P < .05) from CHO-DMT1-II cells transfected with WWP2 and Ndfip1 in the absence of inhibitors. ***Significant increase (P < .05) from CHO-DMT1-II cells transfected with WWP2 and Ndfip2 in the absence of inhibitors. □ indicates CHO cells not expressing DMT1-II; ■, CHO-DMT1-II cells. Data are mean plus or minus SEM.
To further elucidate the roles of WWP2 and Ndfips in DMT1 trafficking, we used proteasome and lysosome inhibitors (MG132 and chloroquine, respectively) to examine DMT1 levels and activity in CHO-DMT1-II cells. To determine whether DMT1 trafficking by WWP2 and Ndfips involves its degradation, the localization of DMT1-II was examined in untransfected CHO-DMT1-II cells treated for 4 hours with 50 μM of MG132 or 400 μM of chloroquine (Figure 5B). MG132 had little visible effect on DMT1 localization; however, chloroquine treatment resulted in the accumulation of DMT1 in large perinuclear puncta. We also observed similar alteration in DMT1-I localization after chloroquine treatment, in transiently transfected CHO cells (Figure S3). CHO-DMT1-II cells were then transfected with WWP2 and Ndfip1 or Ndfip2 and incubated with MG132 or chloroquine. The total level of DMT1 protein was then measured by immunoprecipitation and immunoblotting (Figure 5C). We found that coexpression of Ndfip1 or Ndfip2 with WWP2 significantly decreased DMTI protein levels (Figure 5C, compare lanes 4 and 7 with lane 1). In addition, MG132 prevented the loss of DMT1 caused by coexpression of Ndfip1 and WWP2 (Figure 5C, compare lane 5 with lane 4). Treatment with chloroquine did not significantly alter total DMT1 protein levels in cells expressing either Ndfip1 or Ndfip2 and WWP2 (Figure 5C, compare lane 9 with lane 7). To confirm this differential regulation of DMTI protein, we measured DMT1 transport activity in transfected cells incubated with MG132 or chloroquine for 8 hours (Figure 5D). Both MG132 and chloroquine prevented the complete abrogation of DMT1 activity seen in cells transfected with WWP2 and Ndfip1 or Ndfip2 in the absence of inhibitors. As treatment with chloroquine does not alter DMTI levels in the presence of Ndfips and WWP2 (Figure 5C), the effect on DMT1 transport activity seen is probably the result of the distinct change in DMT1 localization after treatment (Figure 5B). Together, our data suggest that the regulation of DMT1 by Ndfips is mediated in part by proteasomal degradation and partly by promoting trafficking to the endosomal compartment.
Ndfip1 modulates DMT1 and iron homeostasis in vivo
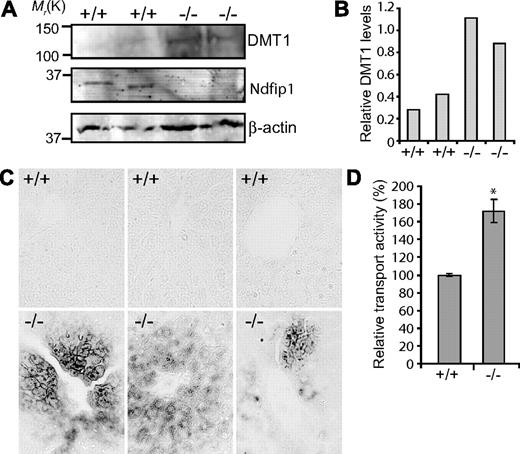
To investigate the in vivo function of Ndfip1 in regulating DMT1, we used Ndfip1−/− mice generated by Oliver et al.33 Because Ndfip1−/− mice develop an inflammatory phenotype approximately 6 to 7 weeks of age, we investigated animals before any signs of disease. From our studies, we would predict that DMT1 levels would be increased in Ndfip1−/− mice compared with Ndfip1+/+ animals. Consistent with this prediction, immunoblotting of liver extracts and quantitation of protein bands relative to β-actin loading control, showed an increase in the levels of DMT1 in the Ndfip1−/− mice compared with their Ndfip1+/+ littermates (Figure 6A,B).
Ndfip1−/− mice show increased levels of DMT1 in the liver associated with iron loading. (A) Immunoblot analysis of DMT1 in liver tissue of 6-week-old Ndfip1+/+ and Ndfip1−/− mice. There is an increase in the levels of DMT1 in Ndfip1−/− mice compared with Ndfip1+/+ mice; 10% input was probed for β-actin as loading control. (B) DMT1 protein levels were quantitated relative to the β-actin loading control and displayed graphically. (C) Perl's iron staining of paraffin-embedded liver sections. Iron (stained in black) is seen accumulating around the portal veins in the Ndfip1−/− liver. The sections were counterstained with nuclear fast red to delineate cell nuclei. Data from 3 different Ndfip1−/− animals and their wild-type Ndfip1+/+ littermates are shown. (D) Transport activity in primary hepatocytes is increased in Ndfip1−/− mice compared with wild-type littermates. The relative transport activity was measured by fluorescence quenching assay as described in Figure 1. *P < .05. Data are mean plus or minus SEM. Images were viewed with an Olympus BX51 microscope (Olympus, Center Valley, PA) using a UplanApo Lens at 40×/0.85 NA. Images were acquired using an Olympus camera model DP70 (3.0) and processed with Olysia Bioreport version 3.2 (Olympus) software. Images were compiled using Adobe Photoshop version 6.0 software (Adobe Systems, San Jose, CA).
Ndfip1−/− mice show increased levels of DMT1 in the liver associated with iron loading. (A) Immunoblot analysis of DMT1 in liver tissue of 6-week-old Ndfip1+/+ and Ndfip1−/− mice. There is an increase in the levels of DMT1 in Ndfip1−/− mice compared with Ndfip1+/+ mice; 10% input was probed for β-actin as loading control. (B) DMT1 protein levels were quantitated relative to the β-actin loading control and displayed graphically. (C) Perl's iron staining of paraffin-embedded liver sections. Iron (stained in black) is seen accumulating around the portal veins in the Ndfip1−/− liver. The sections were counterstained with nuclear fast red to delineate cell nuclei. Data from 3 different Ndfip1−/− animals and their wild-type Ndfip1+/+ littermates are shown. (D) Transport activity in primary hepatocytes is increased in Ndfip1−/− mice compared with wild-type littermates. The relative transport activity was measured by fluorescence quenching assay as described in Figure 1. *P < .05. Data are mean plus or minus SEM. Images were viewed with an Olympus BX51 microscope (Olympus, Center Valley, PA) using a UplanApo Lens at 40×/0.85 NA. Images were acquired using an Olympus camera model DP70 (3.0) and processed with Olysia Bioreport version 3.2 (Olympus) software. Images were compiled using Adobe Photoshop version 6.0 software (Adobe Systems, San Jose, CA).
We further predicted that these animals, with potentially increased DMT1 transport activity as indicated by our in vitro data, may take up more iron than their wild-type counterparts, resulting in iron loading. To test this, we stained liver (the main iron storage site), sections from 6-week-old mice (Ndfip1−/− and Ndfip1+/+ littermates) with Perl's reagent, intensified with diaminobenzidine and nickel. Livers from Ndfip1−/− mice had significant deposits of iron seen surrounding portal veins, which was not seen in any of the Ndfip1+/+ animals analyzed (Figure 6B). In addition, our preliminary data demonstrate accumulation of iron in the villi of duodenum of some Ndfip1−/− animals but not in the Ndfip1+/+ littermates (Figure S4). We also quantified liver iron levels by inductively coupled plasma mass spectrometry. Our data revealed an increased hepatic iron content (6262 ± 1592 μg/L, mean ± SEM, n = 3) in Ndfip1−/− mice compared with their wild-type counterparts (4009 ± 403 μg/L, n = 3). This is a striking result given the young age (6 weeks) of the mice and the fact that the animals were fed a normal iron diet.
Previous studies have reported that in rats iron overload leads to increased DMT1 protein at the hepatocyte plasma membrane.38 We therefore predicted that hepatocytes from Ndfip1−/− mice may have altered DMT1 transport activity. To test this, we cultured primary hepatocytes from Ndfip+/+ and from Ndfip1−/− mice and performed transport assays on these cells. Our data demonstrated significantly higher (∼ 1.8-fold) transport activity in hepatocytes from Ndfip1−/− mice compared with hepatocytes from their wild-type littermates (Figure 6D).
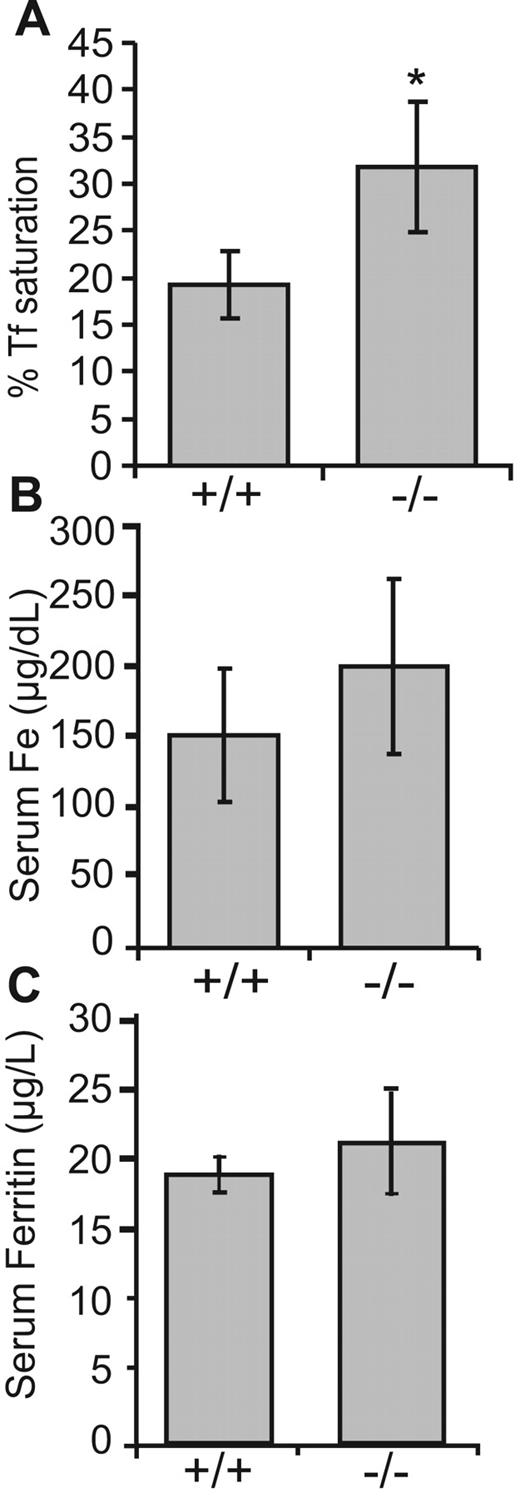
We further measured several blood markers for iron overload disorders. Although we did not observe significant differences in serum ferritin levels, there was a slight increase in serum iron levels in the Ndfip1−/− mice compared with that of wild-type littermates, and a significant increase in transferrin saturation (Figure 7). In contrast, serum transferrin levels were similar in the wild-type (3.917 ± 0.18 mg/mL, mean ± SEM, n = 3) and in Ndfip1−/− mice (3.68 ± 0.68 mg/mL, n = 3). In addition, hemoglobin levels remained unchanged in the Ndfip1−/− mice (227 ± 18 mg/mL, n = 3) compared with Ndfip1+/+ mice (207 ± 30 mg/mL, n = 3), and hematocrit analysis did not reveal significant differences in packed RBC volume from wild-type (58.4% ± 2.86%) and Ndfip1−/− mice (64.24% ± 1.33%). There were also no obvious changes in the morphology of RBCs from the Ndfip1−/− animals (Figure S5).
Ndfip1−/− animals show increased transferrin saturation. (A) Total iron levels, (B) transferrin saturation, and (C) ferritin levels in the sera from Ndfip1−/− animals and their wild-type Ndfip1+/+ counterparts were determined as described in “Immunoprecipitation and immunoblotting.” *Significant increase (P < .05) from Ndfip1+/+ animals. Data are mean plus or minus SD; n = 4.
Ndfip1−/− animals show increased transferrin saturation. (A) Total iron levels, (B) transferrin saturation, and (C) ferritin levels in the sera from Ndfip1−/− animals and their wild-type Ndfip1+/+ counterparts were determined as described in “Immunoprecipitation and immunoblotting.” *Significant increase (P < .05) from Ndfip1+/+ animals. Data are mean plus or minus SD; n = 4.
Discussion
Hereditary hemochromatosis is a widespread human disease most commonly caused by a mutation in the HFE gene.39 Hfe−/− mice show iron overload, whereas the Hfe−/− mice carrying mutations in DMT1 are unable to load iron, indicating that hemochromatosis involves DMT1-dependent iron uptake.40 Interestingly, Hfe−/− mice also show elevated levels of DMT1 and thus increased iron absorption.41 Furthermore, DMT1 mutations lead to congenital hypochromic microcytic anemia.13-16 Thus, DMT1 levels and activity directly relate to diseases of iron uptake and metabolism. As such, any cellular mechanisms that regulate DMT1 levels, either transcriptionally or posttranslationally, would result in diseases of iron transport and metabolism.
The results presented in this paper describe a new mode of regulating DMT1 levels posttranslationally. We have demonstrated that Ndfips regulate DMT1 by acting as adaptors to recruit the ubiquitin ligase WWP2 and enhancing the ubiquitination of DMT1 and subsequent degradation via the lysosome and proteasome (Figure S6). We have shown that DMT1 associates with Ndfips and WWP2 and that this probably leads to DMT1 ubiquitination and degradation. This would reduce the amount of DMT1 protein available to be transported to the cell membrane, reducing DMT1 activity and iron uptake. Consistent with presence of DMT1 protein in the Golgi and endosomal compartments, Ndfip proteins also show substantially overlapping localization in these subcellular organelles. Our data suggest that DMT1 degradation may occur both by the proteasomal and lysosomal mechanisms. Although under what circumstances these pathways are activated and what molecular mechanisms control DMT1 ubiquitination remain to be fully elucidated, our data suggest that Ndfip1 and Ndfip2 proteins may act differentially in regulating proteasomal and lysosomal degradation of DMT1.
The physiologic relevance of the findings reported here is validated by studies in Ndfip1 knockout mice that show a typical hemochromatosis phenotype with hepatic and duodenal iron accumulation, hepatomegaly,33 increased serum iron levels, and increased serum transferrin saturation. Unlike the microcytic anemia seen in most patients with DMT1 mutations, Ndfip1−/− mice showed no unusual blood cell morphology (Figure S5), and mean corpuscular volume remained unchanged. These results suggest that the regulation of DMT1 by Ndfip1 (and potentially Ndfip2 and WWP2) is essential in peripheral tissues, but not in erythrocytes. This is consistent with the findings that tissues such as the liver use non–transferrin-bound iron, whereas erythroid cells do not.14 A loss of Ndfip1, which we have shown results in the increase in DMT1 expression, would therefore increase the uptake of non–transferrin-bound iron in tissues such as the liver and result in iron overload with no effect in erythrocytes.
Given our in vitro data, we expect that deficiency of Ndfip2 and WWP2 (such as in gene knockout mice) would also result in similar iron overload phenotypes. It is intriguing that a somewhat analogous pathway of regulating a metal iron transporter exists in the yeast (S. cerevisiae). This conservation provides further support for the importance of the control of protein homeostasis by the Nedd4 family members and the Ndfip adaptors. Thus, these findings encapsulate a novel, evolutionarily conserved, pathway of regulation of an essential mammalian iron transporter by ubiquitination mediated by a ubiquitin ligase and an adaptor.
Given that misregulation of DMT1 is implicated in a number of human diseases and that Ndfips play an essential role in regulating tissue iron homeostasis, these proteins, and the ubiquitin ligase WWP2, could be potential targets for therapeutic intervention to control iron uptake and/or metabolism. Furthermore, mutations and variations in WWP2 and Ndfip genes may result in diseases of iron metabolism. For example, inactivating mutations in Ndfip1, Ndfip2, and WWP2 genes may contribute to iron overload diseases. Further characterization of WWP2 and Ndfips should provide additional understanding of this novel mechanism of regulating iron transport.
The online version of this article contains a data supplement.
The publication costs of this article were defrayed in part by page charge payment. Therefore, and solely to indicate this fact, this article is hereby marked “advertisement” in accordance with 18 USC section 1734.
Acknowledgments
The authors thank P. Gros, A. Angers, T. Imamura, J. Wrana, A. Komura, and D. Boehmann for reagents, Y. Leong for technical assistance, D. Hiwase for advice on hematologic analyses, A. Beech and M. Smart for performing inductively coupled plasma-mass spectrometry analysis, U. Putz for some tissue preparation, and V. Nathan Subramaniam for helpful discussions.
This work was supported by a grant from the National Health and Medical Research Council of Australia.
Authorship
Contribution: N.J.F., H.E.D., and S.K. designed experiments; N.J.F., H.E.D., and L.D. performed the experimental work; B.Y. and S.-S.T. provided Ndfip1−/− mice and prepared and provided some tissue samples for analysis; N.J.F., H.E.D., L.M.S.-W., L.D., and S.K. analyzed data and wrote the paper; and all authors discussed results and commented on manuscript.
Conflict-of-interest disclosure: The authors declare no competing financial interests.
Correspondence: Sharad Kumar, Department of Haematology, Hanson Institute, Adelaide, SA 5000, Australia; e-mail: sharad.kumar@imvs.sa.gov.au.
References
Author notes
N.J.F. and H.E.D. contributed equally to this manuscript.

This feature is available to Subscribers Only
Sign In or Create an Account Close Modal