Abstract
Background: Recent concerns regarding the risks of cancer and cancer-related death due to radiation from computed tomography (CT) scans (Brenner, NEJM 2007) and the lack of data demonstrating a survival advantage for surveillance CT scans following lymphoma therapy have raised questions regarding their benefit. We compared the radiation-related lifetime cancer incidence (LCI) and mortality risks (LCMR) associated with CT scans for staging and surveillance of non-Hodgkin lymphoma (NHL) and Hodgkin lymphoma (HL) with the cumulative probability of lymphoma death (CPLD) during monitoring.
Methods: Using 2008 NCCN Guidelines for HL and NHL, we estimated that the average number of scans a patient would need during 5 years of treatment and follow-up would be 10. We utilized published estimates of the cumulative organ-specific radiation doses from full-body CT scans (Brenner, Radiology 2004) and calculated the LCI and LCMR using sex-, age-, and organ-dependent cancer risks per 0.1Gy provided by the Biological Effects of Ionizing Radiations VII report. Site-specific cancer risks were summed to yield the overall LCI and LCMR as described by Brenner (Med Phys 2001). Surveillance, Epidemiology, and End Results (SEER) data were used to identify cases between 2000 and 2005 from 17 SEER Registries and calculate CPLD for specified cohorts.
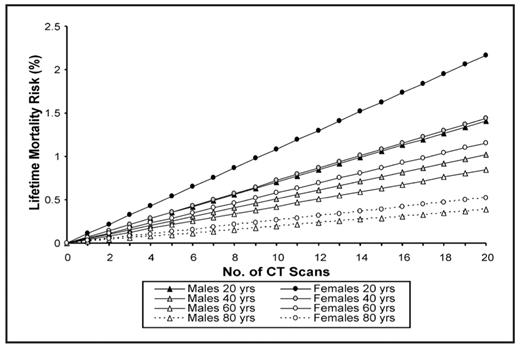
Results: LCI and LCMR were lower for males and were markedly less than the CPLD at 5 years for most patients, but relevant for younger women with HL given their low risk of HL death (Table 1). The relationship between LCMR and the number of CT scans is shown in Figure 1. Additional implications of surveillance strategies on specific cancer risks will be presented.
Conclusion: While the LCMR from CT scans is small compared to lymphoma-related deaths for most subgroups, these data should be discussed with patients in formulating plans for surveillance following lymphoma therapy.
Table 1 LCI and LCMR due to CT scans compared with CPLD for lymphoma subtypes by age at diagnosis and gender
| Lymphoma Subtype (Age at Diagnosis) . | LCI from CT* . | LCMR from CT* . | 5-year Cumulative Probability of Lymphoma Death** . | |||
|---|---|---|---|---|---|---|
| . | Males . | Females . | Males . | Females . | Males . | Females . |
| * per person exposed to the cumulative radiation dose associated with 10 full-body CT scans during 5 years from diagnosis | ||||||
| ** Age group studied were HL (20–29 & 80–84), DLBCL (60–79), FL (60–79), NHL (60–79) | ||||||
| NHL (70 yrs) | 0.0044 | 0.0057 | 0.0032 | 0.0044 | 0.31 | 0.28 |
| FL (70 yrs) | 0.22 | 0.18 | ||||
| DLBCL (70 yrs) | 0.39 | 0.37 | ||||
| HL (20 yrs) | 0.0133 | 0.0242 | 0.0070 | 0.0108 | 0.07 | 0.07 |
| HL (80 yrs) | 0.0022 | 0.0030 | 0.0019 | 0.0026 | 0.47 | 0.55 |
Disclosures: No relevant conflicts of interest to declare.
Author notes
Corresponding author


This feature is available to Subscribers Only
Sign In or Create an Account Close Modal