Abstract
Myelodysplatic syndromes (MDS) are rare malignant haematopoietic stem cell disorders in children. They have the propensity to transform into acute myeloid leukemia and, for this reason they can be considered as a pre-leukemia condition. In this study we analyzed the gene expression profile (GEP) of a large cohort of pediatric patients: 14 MDS [6 refractory cytopenias (RC), 6 refractory anemias with excess blasts (RAEB) and 2 refractory anemias with excess blasts in transformation (RAEB-t)], 50 de-novo acute myeloid leukemia (AML) and 6 normal bone marrow (BM) aspirates. Furthermore, in 5 cases, samples were available for analysis both at diagnosis and at time of secondary AML progression. Gene expression analysis was performed on the Affymetrix HG U133 Plus 2.0 oligonucleotide microarrays using Partek software packages and the leukemia classifier version 7(LCver7). Statistical analyses were performed to determine the correlation between the gene expression signature and MDS subtype. Unsupervised hierarchical clustering analysis separated the majority of MDS cases from the diagnostic AML samples and placed the normal BM specimens into the MDS cluster. Remarkably, all the MDS cases that evolved into an AML within one year, except one, clustered together inside the diagnostic AML group. Performing principal component analysis (PCA) we observed that MDS samples were clustered between the group of normal BM and AML samples. Moreover the RC samples were located proximal to the cluster of normal BM samples while RAEB and RAEB-t specimens were nearest to the AML samples cluster (Fig 1). Further, we classified the MDS samples using the LCver7 classifier, an algorithm developed inside the MILE (Microarray Innovation In LEukemia) study that gives an overall cross-validation accuracy of >95% for distinct sub-classes of pediatric and adult leukemias using gene expression profiles. The 14 MDS samples had 57.2 % and 42.8 % AML and non AML-like signatures, respectively. The Fisher exact test showed that there was a statistical concordance (p=0.008) between the FAB classification and the gene expression signature. In fact, 83% of RC patients had a non AML-like signature whereas only 17% had an AML-like signature. On the contrary 85% of the RAEB and RAEB-t patients had an AML-like signature. In conclusion, the results of unsupervised analysis not only demonstrated that gene expression technology is able to distinguish between MDS, AML and normal BM samples but, in addition, GEP can identify an AML-like signature in samples at diagnosis of MDS, with a higher risk of AML-evolution, allowing to identify a group of patients that could be eligible for a more intensive treatment.
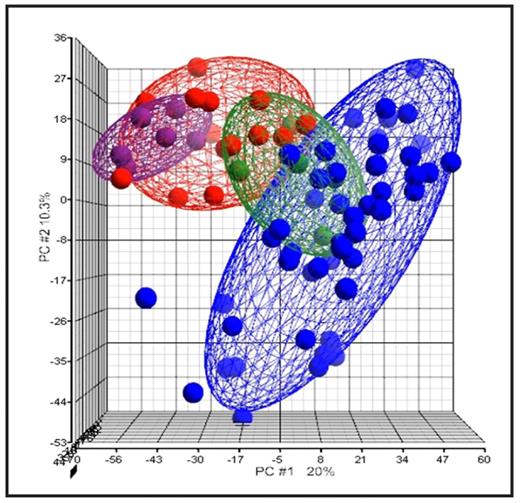
Principal component analysis (PCA) of MDS, AML and normal BM samples. Red: MDS samples, Blue: de novo AML, Green: secondary AML, Violet: normal BM. RC samples are placed closer to the normal BM specimens. The three MDS patients that will evolve into secondary AML are included into the green ellipsoids.
Principal component analysis (PCA) of MDS, AML and normal BM samples. Red: MDS samples, Blue: de novo AML, Green: secondary AML, Violet: normal BM. RC samples are placed closer to the normal BM specimens. The three MDS patients that will evolve into secondary AML are included into the green ellipsoids.
Disclosures: No relevant conflicts of interest to declare.
Author notes
Corresponding author


This feature is available to Subscribers Only
Sign In or Create an Account Close Modal