In the online data supplement and on page 3852 in the May 1, 2007, issue, there were errors in several figures.
In online Figures S1 and S7, the authors spliced lanes without indicating that they had done so. Figures S1 and S7 and the figure legends were corrected in the online version. The corrected supplemental figures now show with vertical lines the positions at which extraneous lanes from the blot were digitally excised.
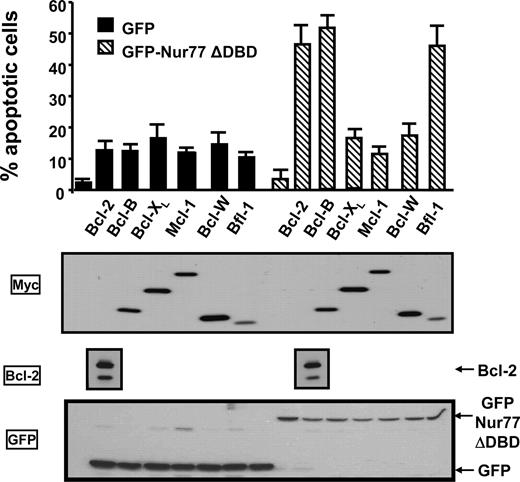
Figure 2 contains lane duplications in the Bcl-2 Western blot. The entire experiment was repeated because the primary data from this experiment were not sufficiently documented to allow reconstruction of the figure. The corrected Figure 2 and figure legend are shown.
Nur77 collaborates with Bcl-2, Bfl-1, and Bcl-B to induce apoptosis. HeLa cells in 12-well plates were cotransfected with 0.3 μg plasmids encoding either GFP or GFP-Nur77ΔDBD in combination with 1 μg plasmids encoding the 6 antiapoptotic Bcl-2 family members. After 1 day, cells were washed with PBS, fixed with 3.7% formaldehyde, and stained with DAPI to visualize nuclei by UV microscopy. The percentages of apoptotic cells were determined by counting 200 GFP-positive cells, scoring cells having nuclear fragmentation and/or chromatin condensation. Data are reported as means plus or minus SE (n = 3). For assessing protein expression (bottom 3 panels), lysates were prepared from transfected cells, normalized for total protein content, and analyzed by SDS-PAGE/immunoblotting using Bcl-2, Myc, and GFP antibodies. The Bcl-2 data were derived from a single blot, and the bands were aligned with the apoptosis results for clarity of presentation.
Nur77 collaborates with Bcl-2, Bfl-1, and Bcl-B to induce apoptosis. HeLa cells in 12-well plates were cotransfected with 0.3 μg plasmids encoding either GFP or GFP-Nur77ΔDBD in combination with 1 μg plasmids encoding the 6 antiapoptotic Bcl-2 family members. After 1 day, cells were washed with PBS, fixed with 3.7% formaldehyde, and stained with DAPI to visualize nuclei by UV microscopy. The percentages of apoptotic cells were determined by counting 200 GFP-positive cells, scoring cells having nuclear fragmentation and/or chromatin condensation. Data are reported as means plus or minus SE (n = 3). For assessing protein expression (bottom 3 panels), lysates were prepared from transfected cells, normalized for total protein content, and analyzed by SDS-PAGE/immunoblotting using Bcl-2, Myc, and GFP antibodies. The Bcl-2 data were derived from a single blot, and the bands were aligned with the apoptosis results for clarity of presentation.


This feature is available to Subscribers Only
Sign In or Create an Account Close Modal