Abstract
Poster Board I-600
Acute myeloid leukemia (AML) is a heterogeneous disease which harbors various genetic alterations. Among theses genetic events, Mutations of FLT3, NPM1, MLL and other genes often predict prognosis, particularly in cases cytogenetic normal (CN-AML). Could these be criteria for risk stratification in Pediatric AML ?
155 cases of de novo AML were diagnosed routinely according to morphology, immunology, cytogenetics, and molecular biology examination on bone marrow (BM) aspirates between Jan. 2002 and Dec. 2008. All patients received chemotherapy according to the AML-XH-99 protocol, which consist of Daunorubicin, Cytosine arabinoside, Etoposide, Homoharringtonine. For acute promyelocytic leukemia, all-trans retinoic acid and Arsenic trioxide were also included. Meanwhile, total RNA of leukemic cells form all diagnostic BM samples were extracted, and then reverse transcribed. MLL partial tandem duplication (MLL/PTD) fusion transcripts were screened by real-time quantitative polymerase chain reaction. FLT3 internal tandem duplication (FLT3/ITD), FLT3 tyrosine kinase domain mutation (FLT3/TKD) and NPM1 mutation were examined by High resolution melting analysis.
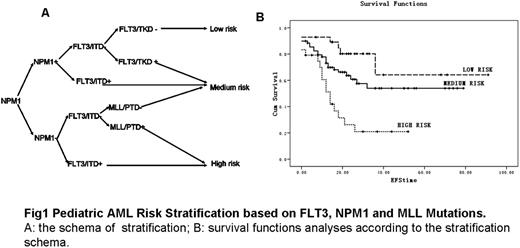
Of the 155 children with de novo AML, 121(78.1%) had received chemotherapy for more than one week with data available for analysis. Among them, 55(45.5%) was cytogenetically normal (CN-AML). In this total cohort of patients 49(27.09%) had FLT3/ITD (32.70% in CN-AML), 14 (9.03%) had FLT3/TKD (7.30% in CN-AML), 62 (40%) had NPM1 mutation (49% in CN-AML), and additional 8 (5.16%) had MLL/PTD (5.50% in CN-AML). In this cohort of patients 98 (63.22%) had at least one mutation. The clinical outcomes were listed in table 1. Generally, patients with FLT3 mutation (ITD or TKD mutation) usually have worse results after chemotherapy, as reported previously by other researchers. Meanwhile, NPM1 mutations usually predict better prognosis in our cohort of AML patients. MLL/PTD always predicts the worst outcome in AML as other MLL rearrangements in leukemia. Among CN-AML patients, 5-year EFS and OS were similar to whole cohort of patients according to those mutations. Cox regression analysis in a univariate model revealed that the presence of FLT3/ITD and NPM1 was significant prognostic factor of EFS, (P<0.05). We therefore proposed a molecular-risk classification of pediatric AML patients based on the data we got in this study. For the newly classified groups of low, medium and high risk groups, EFS rate was 62.03%±8.42%, 45.42%±4.52%, and 14.85%±2.99%, respectively, P=0.00. CRD for the 3 groups was 27.69±21.34 months, 22.62±19.64 months, 13.26±11.95 months, respectively, p=.022. Our results indicate that combinations of these couple of molecular events may be the useful tool for further classify AML in children.
The clinical outcomes of pediatric AML patients with different gene mutations
| Mutations/wild . | First course CR (%) . | 5-year EFS (%) . | 5-year OS (%) . | CR Duration (Month) . |
|---|---|---|---|---|
| FLT3/ITD | 50/76.5 (p = 0.004) | 24.65 ± 3.93/55.01 ± 5.09 (p = 0.007) | 49.13 ± 7.08/62.24 ± 4.96 (p = 0.173) | 18.58 ± 17.37/23.71 ± 20.09 (p = 0.185) |
| FLT3/TKD | 72.7/68.2 (p = 0.527) | 43.68 ± 9.79/50.48 ± 4.319 (p = 0.373) | 49.21 ± 9.25/60.595 ± 4.31 (p = 0.233) | 38.45 ± 29.84/20.55 ± 17.05 (p = 0.003) |
| NPM1 Mutation | 72.3/66.2 (p = 0.308) | 61.41 ± 6.26/36.30 ± 4.24 (p = 0.014) | 75.45 ± 5.29/47.12 ± 5.18 (p = 0.001) | 27.15 ± 20.93/19.03 ± 17.78 (p = 0.024) |
| MLL/PTD | 25/70.1 (p = 0.091) | 8.50 ± 3.10/50.98 ± 4.18 (p = 0.04) | 14.33 ± 1.76/60.39 ± 4.19 (p = 0.091) | 8.5 ± 6.19/55.65 ± 19.53 (p = 0.024) |
Pediatric AML Risk Stratification based on FLT3, NPM1 and MLL Mutations. A: the schema of stratification; B: survival functions analyses according to the stratification schema.
Pediatric AML Risk Stratification based on FLT3, NPM1 and MLL Mutations. A: the schema of stratification; B: survival functions analyses according to the stratification schema.
No relevant conflicts of interest to declare.

This icon denotes an abstract that is clinically relevant.
Author notes
Asterisk with author names denotes non-ASH members.


This feature is available to Subscribers Only
Sign In or Create an Account Close Modal