Abstract
Abstract 2120
Poster Board II-97
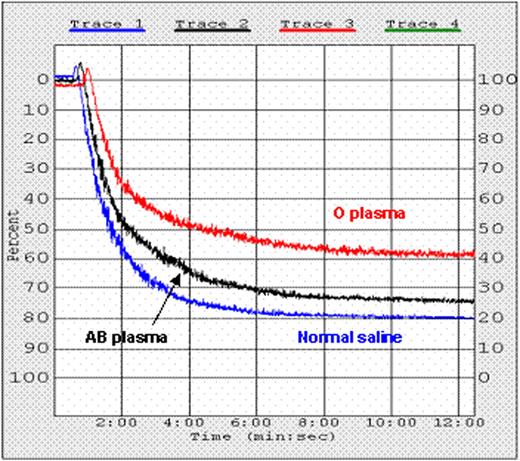
Background: Transfusion of ABO non-identical red blood cells (RBCs) can cause immune mediated hemolytic transfusion reactions. Therefore, only ABO identical RBCs are transfused, except in emergencies, when group O RBCs are transfused. Use of exclusively ABO identical plasma and platelet (PLT) transfusions is not uniformly practiced nor always feasible despite reports of hemolytic reactions. Since PLTs and soluble plasma proteins possess A and B antigens, ABO non-identical PLTs could, theoretically, be activated and/or rendered hypofunctional by anti-A and anti-B antibodies (Abs) in transfused or recipient plasma. Recent findings demonstrate that transfusion of ABO non-identical PLTs is associated with increased bleeding in surgical patients and patients with leukemia. Blunt trauma patients who received at least one ABO non-identical blood product transfusion demonstrated a significantly higher RBC usage (12.3 ± 6.9 SD versus 8.4 ± 9.9 SD, p-value 0.0011) compared to those patients who received only ABO identical transfusions (Transfusion. 2007;47:192A). ABO identical PLT transfusions in leukemia patients were a significant predictor of survival (Leukemia. 2008;22:631-5). In a multi center retrospective analysis of more than one million cancer patients over a period of 9 years, Khorana et al. demonstrated an overall venous thromboembolism (VTE) rate of 4.1%. In multivariate risk factor analysis, the association between blood transfusions and VTE had an odds ratio of 1.35 (1.31-1.39, 95% CI) with a p value of < 0.001 (Arch Intern Med. 2008;168:2377-81). We hypothesized that PLTs activated by ABO Abs might have altered function. Methods and Materials: PLT function was evaluated by testing aggregation in platelet rich plasma (PRP). Aggregation was performed with PRP from 7 type A and 6 type B normal blood donors following a 10 min incubation period at 37°C with either normal saline, group O or AB plasma. PLTs were activated by 20 mM ADP and aggregation quantitated from the maximum change in OD. Similar experiments were repeated utilizing different titration of the commercial anti-A and anti-B anti-sera. Results: Following incubation with O plasma, PLT aggregation was inhibited by a mean of 38% and 18% for group A and B PLTs, respectively (P ≤ 0.005) (Figure). A trend toward inhibition was observed when type A PLTs were incubated with control AB plasma (average of 14%, P = 0.187), whereas type B PLT showed no inhibition when incubated with AB plasma (P = 0.939) (Table 1). PLT aggregation with the anti-sera showed gradual inhibition correlated with the antibody titer (Table 2). Conclusion: Mediators in group O plasma, most likely anti-A and anti-B Abs, cause impaired PLT aggregation in ABO non-identical PLTs. These in vitro findings may explain, at least in part, clinical observations that patients receiving ABO non-identical PLT transfusions experience more bleeding than recipients of ABO identical PLT transfusions.
PLT aggregation of A and B PRP with saline, O and AB plasma.
| Blood Donor Type . | N . | Average Percentage of Platelet Aggregation (SD) . | ||||
|---|---|---|---|---|---|---|
| Normal Saline . | “O” Plasma . | P value* . | “AB” Plasma . | P value . | ||
| A | 7 | 92 (7.4) | 54 (9.9) | < 0.005 | 78 (2.9) | 0.187 |
| B | 6 | 85 (6.8) | 67 (9.8) | 0.005 | 85.3 (7.9) | 0.939 |
P value < 0.05 is considered statistically significant.
PLT function of type A PRP incubated for 10 min at 37°C with O or AB plasma, or normal saline.
PLT function of type A PRP incubated for 10 min at 37°C with O or AB plasma, or normal saline.
PLT aggregation of A and B PRP with different titration of the commercial anti-A and anti-B anti-sera.
| Anti-sera/Plasma . | Type A PRP . | P value . | Type B PRP . | P value . |
|---|---|---|---|---|
| Baseline | 93.7 (3.1) | — | 83.4 (11) | — |
| 1:1024 | 48.7 (8.5) | 0.006 | 36.3 (7.8) | 0.0005 |
| 1:512 | 57.3 (2.5) | 0.0001 | 47.7 (7.5) | 0.002 |
| 1:256 | 59.5 (3.5) | 0.008 | 59.5 (0.7) | 0.002 |
| 1:128 | 55.5 (3.5) | 0.006 | 67 (2.8) | 0.027 |
| AB plasma | 87.7 (3.2) | 0.08 | 81.2 (16) | 0.88 |
No relevant conflicts of interest to declare.
Author notes
Asterisk with author names denotes non-ASH members.


This feature is available to Subscribers Only
Sign In or Create an Account Close Modal