Abstract
Abstract 3411
Poster Board III-299
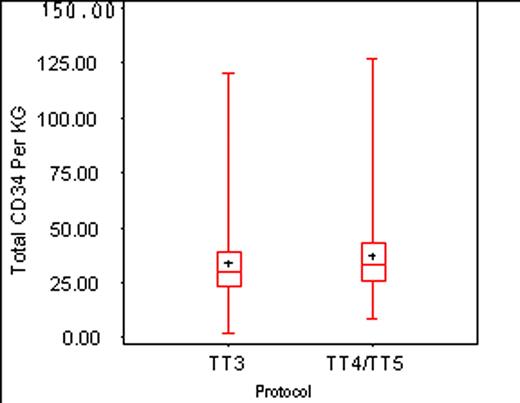
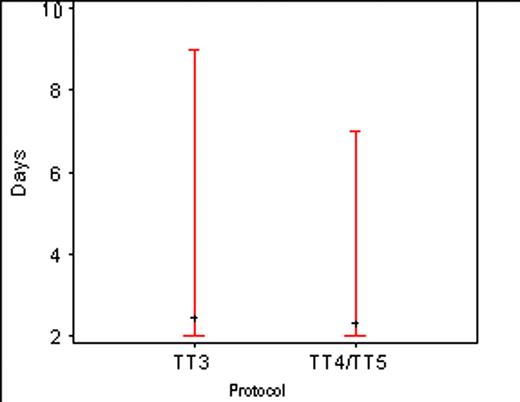
Based on profound outcome differences in Total Therapy 3 (TT3) among patients with gene expression profiling (GEP)-defined low- and high-risk groups, TT4 for low-risk MM randomizes patients between standard and light version of TT3, whereas TT5 for high-risk MM applies dose-dense treatment sequences. Both trials employ M-VTD-PACE combination therapy for induction followed by HPC collection with the objective of collecting a minimum of 20 × 106 CD34 cells per kg body weight. The M-VTD-PACE regimen includes M (melphalan, 10mg/m2) as a test-dose after a preceding bortezomib test-dose (1.0mg/m2), each of which is followed 48hr later by GEP studies to examine prognostically relevant and drug-unique GEP alterations. There was obvious concern that the M test-dose might interfere with HPC collection. Here, we examined the CD34 yield and the days required in the first 84 patients in comparison to predecessor TT3 protocols.
Box-plots were used to display the total CD34 collections and the CD34 collection days. Comparisons were made using the Wilcoxon Rank Sum Test.
As is evident from the appended Figure, the addition of M did not adversely affect CD34 total yield or the kinetics of procurement. Results will be presented on the engraftment kinetics and early outcome results for this first personalized medicine trial in MM.
We were able to introduce M pharmaco-genomic investigations in this first-in-kind risk-directed front-line protocol for MM without compromising HPC mobilization.
| . | X 106CD34 / kg . | Days of collection . | ||||||
|---|---|---|---|---|---|---|---|---|
| Protocol . | Minimum . | Median . | Mean . | Maximum . | Minimum . | Median . | Mean . | Maximum . |
| TT3 | 1.45 | 30.03 | 33.99 | 120.11 | 2.00 | 2.00 | 2.46 | 9.00 |
| TT4/TT5 | 8.10 | 32.73 | 37.07 | 126.86 | 2.00 | 2.00 | 2.33 | 7.00 |
P-value for medians of totals, 0.133; for medians of days, 0.360
van Rhee:Genzyme Corporation: Honoraria, Membership on an entity's Board of Directors or advisory committees, Research Funding.
Author notes
Asterisk with author names denotes non-ASH members.


This feature is available to Subscribers Only
Sign In or Create an Account Close Modal