Abstract
Abstract 4375
Our previous studies have focused on the role of TXNIP/ROS/TRX axis and hyperglycemia in breast cancer (Clin Cancer Res.13:3724-30, 2007). A main function of thioredoxin-interacting protein (TXNIP) is to bind and inactivate thioredoxin (TRX) leading to increased reactive oxygen species (ROS) production and apoptosis. While ROS and TRX have been examined in CLL, no studies have been performed on TXNIP levels. Based on the fact that CLL is known to have high levels of ROS compared to normal individuals and that TRX has been shown to have a protective function in CLL, we wanted to first determine if there was any correlation between TXNIP RNA and ROS production, and whether there was any relationship with TRX levels in patient plasma.
Venous blood samples were obtained from the first ten consecutive patients with definite diagnosis of CLL during their routine clinic visits. Patients were selected without regard to demographics or stage or grade of disease. Prior treatment for CLL was not an exclusion criterion. Cells were purified using a Ficoll density gradient. ROS activity was measured using DCFDA by flow cytometry and reported as mean fluorescence intensity. TXNIP and TRX RNA levels were assessed by semi-quantitative PCR. Thioredoxin levels in plasma were measured using a thioredoxn-1 Elisa. Gene profiling of our patient extremes was accomplished using the Human Stress Response 96 StellARray plate and analyzed using Global Pattern Recognition software
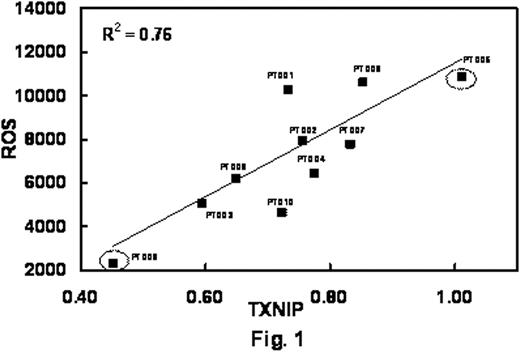
Over a four week period, 10 CLL patients were seen in our clinic and participated in this study. Six out of the 10 patients were either actively being treated or had finished treatment for CLL. The rest were under observation. Three out of the 10 patients had trisomy 12 on FISH and the remaining had normal cytogenetics. We examined the levels of TXNIP RNA in our samples. The median level of TXNIP was 0.77 relative ratio (range: 0.45-1.01). The median ROS levels in our patient samples was 7108 (range 2340-10861). We found a statistically significant correlation between the level of TXNIP RNA and ROS (Fig. 1). TRX RNA levels did not significantly differ among the patients. We also measured TRX levels in the patient plasma and found a median level of 33 ng/ml (range: 18-46 ng/ml) not significantly correlating with TXNIP, TRX RNA levels or ROS levels (R2 = 0.48). Based on the correlation between TXNIP and ROS, 2 patients at either end of our spectrum (see Fig. 1, circled squares) were chosen for further analysis by targeted microarray. Patient (PT009) with the low TXNIP/ROS (currently undergoing treatment) was set as our baseline and the patient (PT005) with high TXNIP/ROS (observation only) was used as test comparison. The microarray has 96 genes involved in cellular stress response pathways. Comparing PT005 to PT009 we found of the 96 genes, 15 genes were up-regulated greater than 2-fold and 21 genes were down-regulated. Among the up-regulated genes were superoxide dismutase (SOD1), FOXO1 transcription factor, catalase (CAT) and members of the catenin family of proteins. Down-regulated genes included BAX and BCL2L1, GSK3-B, and thioredoxin reductase.
In conclusion, we measured the expression of TXNIP in CLL patient samples. We found a range of TXNIP expression that robustly correlates with the level of ROS production, and is associated with differences in the stress response signature the clinical or biological relevance of which deserves further investigation.
Turturro:Celgene: Speakers Bureau; Genentech: Speakers Bureau; Merck & Co: Research Funding.
Author notes
Asterisk with author names denotes non-ASH members.


This feature is available to Subscribers Only
Sign In or Create an Account Close Modal