Abstract
Abstract 1342
Today's front-line treatment of Multiple Myeloma is frequently based on the MIRT experience with Total Therapy 3 (TT3). We developed prognostic models and a web tool based on those models to predict survival and progression free survival.
Data from 303 patients enrolled on UARK 2003-33 and 177 patients treated on UARK 2006-66 was examined. Multivariate Cox regression analysis was used to determine the best prognostic model for overall survival (OS) and event-free survival (EFS) both in the presence and absence of baseline GEP-based risk information.
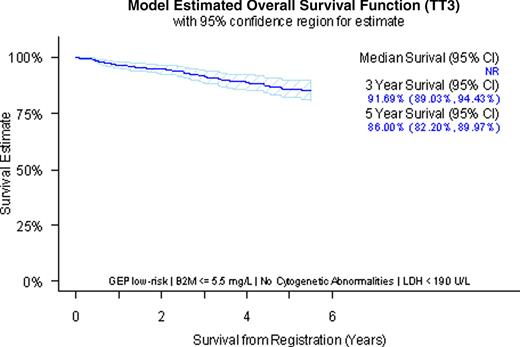
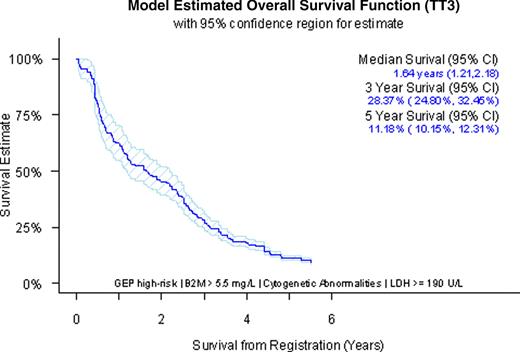
Variable selection resulted in consistent models; both OS and EFS models contained similar elements when the selection process terminated. When GEP-defined 70-gene risk information was available, variable selection for OS resulted in a model containing GEP-risk, β2M, cytogenetic abnormalities and LDH. All variables were chosen to be dichotomous. When GEP-defined 70-gene risk information was not available, we obtained two competing models for both OS and EFS. The variables significant for those models were β2M, cytogenetic abnormalities and LDH. In addition to those variables, albumin entered the competing model. Cumulative R squared, measuring the amount of statistical variability accounted for in a statistical model, was comparable in both. We therefore chose the model that is complementary to the model derived when GEP- based risk information was available. All statistical models used for predicting survival and event-free survival have a cumulative R squared of at least 30. The parameter estimates determined in those models were used to evaluate the predicted OS and EFS for a patient with specific baseline features. Two examples for a predicted OS curve with available GEP data are shown below. Figure 1 shows predicted overall survival with 95% confidence interval for a patient with low risk GEP, no cytogenetic abnormalities, β2M ≤ 5.5 mg/L and LDH < 190 U/L. Figure 2 displays the predicted overall survival with 95% confidence interval for a patient with high-risk GEP, cytogenetic abnormalities, β2M > 5.5 mg/L and LDH ≥ 190 U/L.
A web tool was developed with radio-buttons that enable selection of variables based on observed baseline features of a specific patient. The tool then evaluates and displays the predicted OS and EFS curves with 95% confidence intervals based on the parameter estimates of the underlying multivariate model described above.
Predicted Overall Survival and 95% confidence interval for a patient with low risk GEP, no cytogenetic abnormalities, β2M ≤ 5.5 mg/L and LDH < 190 U/L.
Predicted Overall Survival and 95% confidence interval for a patient with low risk GEP, no cytogenetic abnormalities, β2M ≤ 5.5 mg/L and LDH < 190 U/L.
Predicted Overall Survival and 95% confidence interval for a patient with high-risk GEP, cytogenetic abnormalities, β2M > 5.5 mg/L and LDH ≥ 190 U/L.
Predicted Overall Survival and 95% confidence interval for a patient with high-risk GEP, cytogenetic abnormalities, β2M > 5.5 mg/L and LDH ≥ 190 U/L.
No relevant conflicts of interest to declare.
Author notes
Asterisk with author names denotes non-ASH members.


This feature is available to Subscribers Only
Sign In or Create an Account Close Modal